According to the consent order signed by Judge David Lee, a plan of action for the provision of the constitutional Leandro rights must ensure a system of education that includes “an assessment and accountability system that reliably assess multiple measures of student performance against the Leandro standard and provides accountability consistent with the Leandro standard.”
A report from the Southern Regional Education Board states: “To ensure North Carolina continues to meet the requirements of ESSA, provides a sound basic education for all, and ensures transparency of a school’s strengths and weaknesses, there is a need to review the current model and determine needed revisions.”
This is the third piece in a week-long series that will examine each of the components of the Leandro consent order through the lens of schools and communities in North Carolina. Follow along with the entire series here.
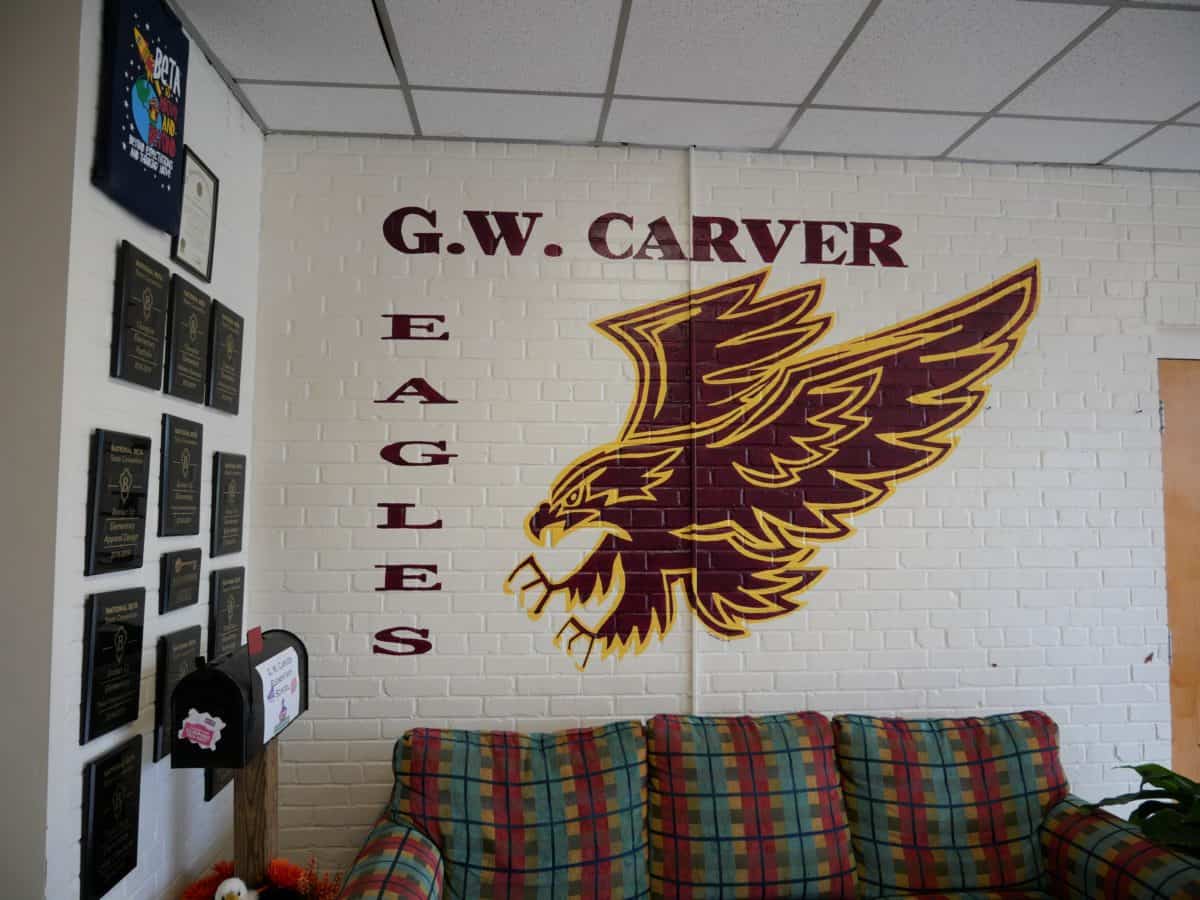
The educators at G.W. Carver Elementary School in Edgecombe County have a lot to be proud of. Last year, their school ranked in the top 2% statewide for academic growth and exceeded growth in all student subgroups except one. But on North Carolina’s latest school report card, Carver received a “C” letter grade.
That’s the product of North Carolina’s school performance grade model, part of the state’s accountability system that assigns an A-F letter grade to each school based on a formula that weights academic achievement at 80% and academic growth at 20%.
Thomas Holland, principal at Carver Elementary, said this grade sends the wrong message and is based on a flawed model.
“It just doesn’t make sense to put a label on a school as a C or D … when the reality is that our kids are growing more than 98% of the schools in the state,” said Holland. “But the factor is what the public sees from that. And what is relayed very simply on a report card is to push our teachers, our staff, and our students down.”
Holland pointed out that Carver is a pre-K-5 school, but its school performance grade only measures academic achievement and growth for third, fourth, and fifth graders, leaving the remaining students out of the calculation altogether.
Then there’s the issue of the formula itself, which weights academic achievement more heavily than academic growth. While Holland acknowledges that achievement will always be an important factor to consider when it comes to standardized tests, he said that it assumes all students start from the same place.
“The gap for our students doesn’t start when they get to school — the gap starts well before they get here. It’s about what they’re exposed to prior, about the opportunities they have at home prior to that,” said Holland. “The reality is in a lot of our Title 1 schools … they come with a year to a year and a half deficit day one of kindergarten. And so from that point forward, we’re trying to play catch up.”
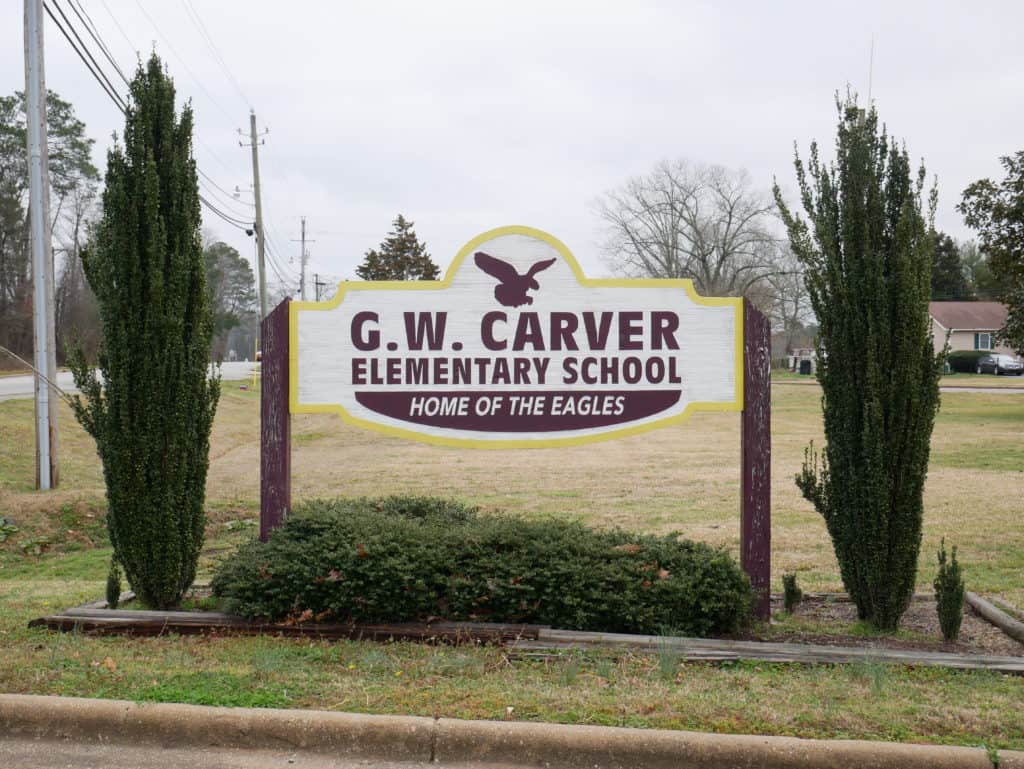
G.W. Carver Elementary School
– Location: Pinetops, North Carolina
– District: Edgecombe County Public Schools
– 50.1% of students are economically disadvantaged
– 44.3% of students entering kindergarten are proficient
– Exceeded growth four of the last five years
That’s why Holland thinks academic growth is such an important factor — it reflects how far his teachers were able to take their students from where they started when they first walked in the school building. If the formula were 50% achievement and 50% growth, Carver would have received a “B” letter grade in the 2018-19 school year.
Holland isn’t alone in this regard. For years, there have been efforts to reform North Carolina’s school performance grades, with some proposing the formula be flipped (20% achievement, 80% growth), others proposing it should be split 50/50, and still others advocating for the removal of school performance grades altogether.
Now, with West Ed’s Leandro report and Judge David Lee’s consent order both drawing attention to the need for an accountability model that tracks progress towards all students having the opportunity to a sound basic education, there is renewed focus on how the state’s assessment and accountability models should change.
A primer on school performance grades
School performance grades began in 2013 when the General Assembly passed a law mandating each school be assigned a letter grade of A-F based on its performance. The grades are calculated using two components — school achievement scores and school growth scores.
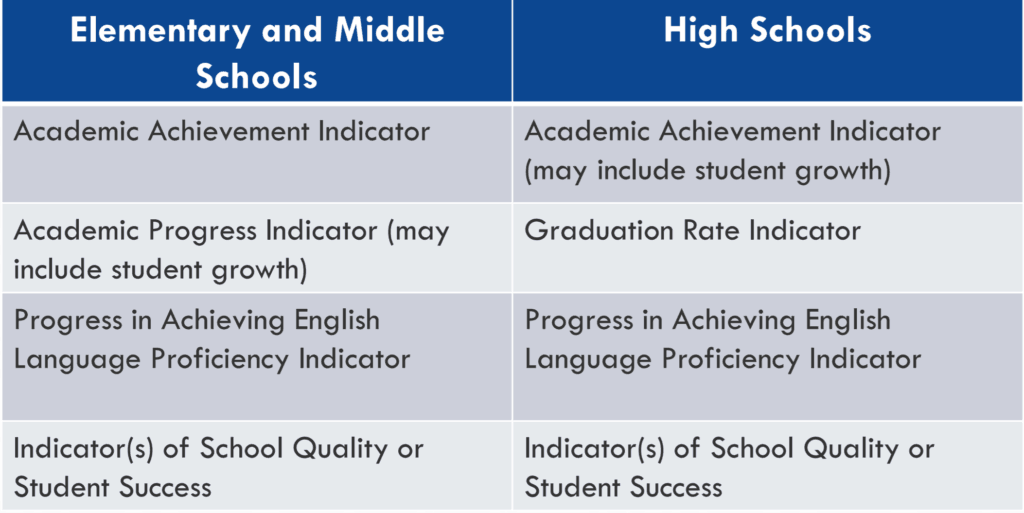
School achievement scores are derived from a combination of factors including test scores (ex. End-of-Course, End-of-Grade, and ACT test results), English language proficiency, measures of workforce readiness, and graduation rates. The exact metrics used to calculate achievement vary between elementary/middle schools and high schools.
School growth scores are calculated using the Education Value-Added Assessment System (EVAAS). Academic growth is a measurement of how much a student has learned. It is determined by measuring expected progress against actual progress. Eight other states also use value-added models to measure student growth. For more on the various ways that states measure student growth, click here.
| Note: Beginning in the 2020-21 school year, all NC Final Exams will be eliminated as part of the statewide testing program to assess teacher performance and professional growth. However, the bill that eliminated those exams preserved the End-of-Course and End-of-Grade tests used to determine achievement and growth, so the formula for school performance grades is unchanged by these testing reductions. |
A school’s overall school performance score is calculated by adding the school achievement score (80% weight) and school growth score (20% weight). That score is converted to a 100-point scale and then assigned a letter grade. A school performance score of at least an 85 is an A, a school performance score of at least a 70 is a B, and so on in 15-point increments.
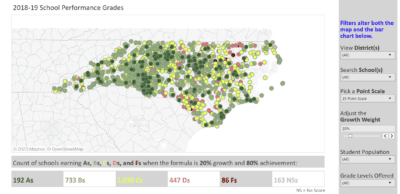
To see how school performance grades would look using a different formula, use our interactive map.
What does ESSA require?
Under the federal Every Student Succeeds Act (ESSA), states have more flexibility in their accountability systems than they did previously under No Child Left Behind, allowing them to “reimagine and redefine what a high-quality education should mean for their students.”
Among other things, ESSA mandates that states include at least one nonacademic measure in their accountability model, and that academic factors, in aggregate, be given more substantial weight in the model than nonacademic factors. Those nonacademic factors could be things like school safety, student engagement, access to advanced coursework, and postsecondary readiness — but ESSA leaves it up to individual states to determine which nonacademic indicator to use, how much weight to give it, and if they want to use more than one.
Additionally, ESSA requires that a state’s accountability system meaningfully differentiates between schools by providing them with a summative determination from among at least three distinct and understandable categories — such as star ratings or letter grades.
For more, here’s a resource from the Education Commission of the States comparing all 50 states’ accountability models in 2018.

Where does North Carolina go from here?
In Session Law 2019-154, the General Assembly charged the State Board of Education with studying the weighting of school achievement and school growth scores and the reporting methods used to differentiate schools on their annual school report cards.
That State Board task force met in late January along with representatives from the Southern Regional Education Board (SREB), a consulting group that was asked to conduct the study.
Then, at the State Board of Education’s monthly meeting in early February, representatives from SREB presented a summary of the task force’s work.
According to SREB’s findings, North Carolina and Vermont are the only two states that weight achievement at 80%, the highest in the nation, with many states weighting it at 40%. While ESSA requires that student achievement be the larger weight among all measures, most states include multiple measures in their overall rating, allowing achievement to take on a smaller percentage. Additionally, only 12 states use an A-F grading model — others use indexes, star ratings, tiers of support, summative ratings, and descriptive formats.
For example, in Ohio, school performance grades are the product of six measures — achievement, progress, graduation rate, gap closing, improving at-risk K-3 readers, and preparedness for success.

So, what would it look like for North Carolina to have a Leandro-aligned, ESSA-compliant accountability model?
The SREB’s study of North Carolina’s accountability system came to the preliminary conclusion that “the state should broaden its measures of school performance and to rely less exclusively on student achievement on year-end exams.” The State Board approved this report on the study’s efforts so far and referred it to the General Assembly’s Joint Legislative Education Oversight Committee.
What measures should be included to track progress toward providing all students with the opportunity for a sound basic education, as recommended in the West Ed report?
The SREB report mentions measures like K-3 readiness, college and career readiness, and school quality, among other things. Holland mentioned including attendance rates, something his school is especially focused on through their success mentor program that works to reduce chronic absence. And the list goes on.
Then there’s the question of how to weight the various measures in the accountability model. In its initial report to the State Board, SREB recommended that “state shareholders come to an agreement on a vision and goals,” then the state should consider “multiple measures of school performance,” before finally determining “a weighting for each measure that provides a more holistic view.”
In the meantime, Holland continues to celebrate the growth of the teachers and students at Carver Elementary. His primary goal is to continue ensuring the school is exceeding growth not only as a school, but also among all student subgroups.
“The only thing we need to focus on is growing our students no matter where they’re at and what challenges they face,” Holland said. Later, he added that the “second that we let what the state has kind of put as a measuring stick … (when) we let that be what defines us and defines our story, it is never going to be a fair story. It’s never going to get what we’re really doing here out.”
Leandro resources
Everything you need to know about the Leandro litigation by Ann McColl
Sound Basic Education for All: An Action Plan for North Carolina (WestEd Report)
Executive Summary of WestEd’s Report
WestEd’s supporting reports:
- Statewide assessment system
- Statewide accountability system
- Cost adequacy, distribution, and alignment of funding
- Supporting student learning by mitigating student hunger
- High-poverty schools: Assessing needs and opportunities
- School success factors
- Attracting, preparing, supporting, and retaining educational leaders
- Educator supply, demand, and quality
- Developing and supporting teachers
- Best practices to recruit and retain well-prepared teachers
- Retaining and extending the reach of excellent educators
- How teaching and learning conditions affect teacher retention and school performance
Supplement to the Investment Overview and Sequenced Action Plan in the WestEd Report
Judge David Lee’s consent order
Draft priorities from the Governor’s Commission on Access to Sound Basic Education
- Finance and Resources Work Group
- Teacher Work Group
- Principal Work Group
- Early Childhood / “Whole Child” Work Group
- Assessment and Accountability Work Group

Recommended reading