
The Education Value-Added Assessment System, commonly known as EVAAS, is a program developed by SAS to measure the growth of students across the state. But confusion exists about the purpose of EVAAS, how it functions, the algorithms it uses, and whether it is an accurate reflection of student performance.
Thomas Tomberlin, director of Educator Human Capital Policy and Research at the state Department of Public Instruction, and John White, director of EVAAS at SAS, spoke about the way EVAAS functions and how it is used in North Carolina.
What is EVAAS?
EVAAS has existed in the state for more than two decades but has only been used as a formal part of the statewide teacher evaluation and accountability system since 2012. Last year, the State Board of Education decided to no longer use growth as an official part of the state’s evaluation of teachers.
In 2010, the state was applying for a grant from Race to the Top, a federal program under No Child Left Behind. As part of the grant application, the state needed to have a measure of student growth. A group which included teachers assessed different models of measuring growth. EVAAS was one of those, and in the end, the group recommended it for the state. In the same year, the state contracted with EVAAS and rolled it out statewide two years later.
The state is paying SAS a little more than $18 million over six years to use the system—a cost of about $3 million a year. Tomberlin estimates school systems around the state collectively spend about $40 million on traditional evaluations—more than double the cost of EVAAS. Tomberlin says traditional evaluations do not give teachers as much data to help improve performance.
EVAAS is used statewide in five states: Tennessee, Ohio, Pennsylvania, South Carolina, and North Carolina.
How does EVAAS work?
Two major data measures in education are achievement and growth.
Academic achievement shows whether a student knows what he or she is supposed to know at any particular grade level. A student is considered proficient if he or she demonstrates on a standardized test that he or she knows the grade level material.
Academic growth is a measurement of how much a student has learned. It is determined by measuring expected progress against actual progress. The measurement is complex because it is independent of whether the student knows what he or she should know in a given grade.
For teachers, the data offers information on how well students perform on their exams and how much they are learning. These two factors are used to calculate the state’s school performance grades—a measurement often used by schools and parents.
School performance grades are calculated using a formula that includes 80 percent academic achievement and 20 percent academic growth. The composition of the formula has caused controversy because some believe it offers too much emphasis on achievement and that growth is a better measurement of whether students are learning.
Achievement measures how well students do on end-of-grade and end-of-course tests at a single point of time. Beginning in the third grade, students across the state take mandatory end-of-grade exams to determine their proficiency in subjects like English and math. The results are collected by the state as a signpost for how schools are performing.
The state sets a benchmark percentage performance on the end-of-grade exams that it considers proficient and assigns it a score of 3. Proficiency is labeled on a 1-5 scale.
The proficiency score accounts for only one data point taken from a single point in time: the day of the test. The student may demonstrate proficiency because of excellent teachers or excelling in knowledge, but a student may also show proficiency because he or she is advanced for his or her age and already possessed the knowledge. The cause of proficiency is not reflected in the score.
The second factor, growth, measures a student against him or herself when compared to average progress across the state. For example, a fourth-grader, compared against all other students taking the same test in the same subject, may be in the 35th percentile for the entire state. That means that 65 percent of students performed better and 34 percent of students performed worse. If, in the next year, the student scores in the 40th percentile, then the student has increased their relative achievement by 5 percentage points. If a group of students does this on average from one year to the next, it is considered more growth than expected.
The state places students in one of three growth categories: did not meet expected growth, met expected growth, or exceeded expected growth. Growth expectation is based on the average amount of academic growth for all students across the state. Growth levels for a district or school are based on the average amount of academic growth for all students in that school or district. Growth can be measured for specific subjects and grades, and these measurements can be combined to create an overall growth measure across subjects and grades. If the students, on average, grow academically more than expected, then the growth level exceeds expected growth. If, on average, they did not grow academically as much as expected, then the level is did not meet expected growth.
EVAAS does not generally present growth data at the individual student level. Instead, it takes all the students in the school and determines whether or not, as a whole, the school met, exceeded, or did not meet growth.
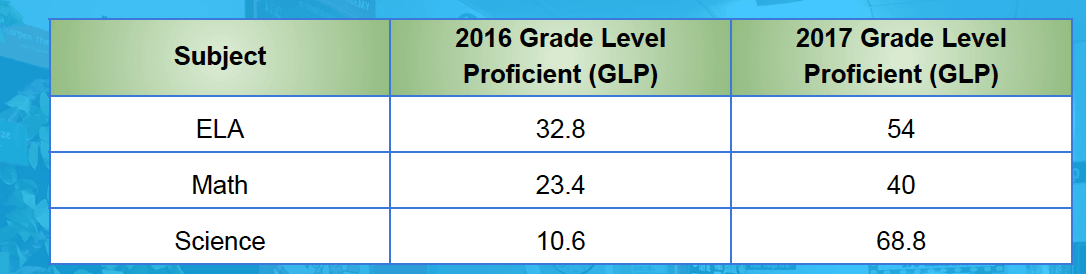
At a recent Charter School Advisory Board meeting, there was discussion about the validity of these growth scores. A charter school, Hope Charter Leadership Academy, struggled last year in achievement. This year, their achievement levels skyrocketed, yet, as a school, they only met growth. Some Board members were baffled at the result, given the high increase in achievement scores.
In an elementary school, grades 3 through 5 are tested each year. If the school performed poorly on achievement, it had a certain set of students in those grades 3 through 5. The next year, if the school performed better, there could be a different set of students taking the tests.
Growth measures how well students perform when compared to themselves in the previous year. There are many possible reasons why the achievement levels increased the next year without a corresponding increase in growth scores. Perhaps some of the kids that were proficient the previous year were in fourth grade and they continued to learn on track and be proficient in fifth grade. Perhaps the students who were in second grade the year before were advanced for their age and performed exceptionally well the next year in third grade. Maybe the fifth graders from the previous year were not on grade level and so, on average, did not meet proficiency. Most of those students probably left the school for sixth grade and were not included in the recent year’s testing.
Any one of these factors, or a host of other factors, could have led to an increase in achievement scores without a resulting increase in academic growth.
It is also important to note that science is only measured in 5th grade in elementary schools. Hope Charter’s achievement gains were largest in science. However, many if not all the students taking the science exams in 2017 would have been new.
Growth versus Achievement on School Letter Grades
Because school performance grades are weighted toward achievement, some critics say they are unfairly biased against poor students. There is a strong correlation between achievement and students’ economic situations. Schools where the majority of the kids are economically disadvantaged tend to get Ds and Fs.
The public EVAAS site does not allow access to achievement data, but that information is available on the restricted site for users with logins, like teachers.
But Tennessee’s Department of Education also uses EVAAS and includes achievement on the public site. This chart shows economic status versus achievement for 3rd grade math in 2015, the most recent year available.
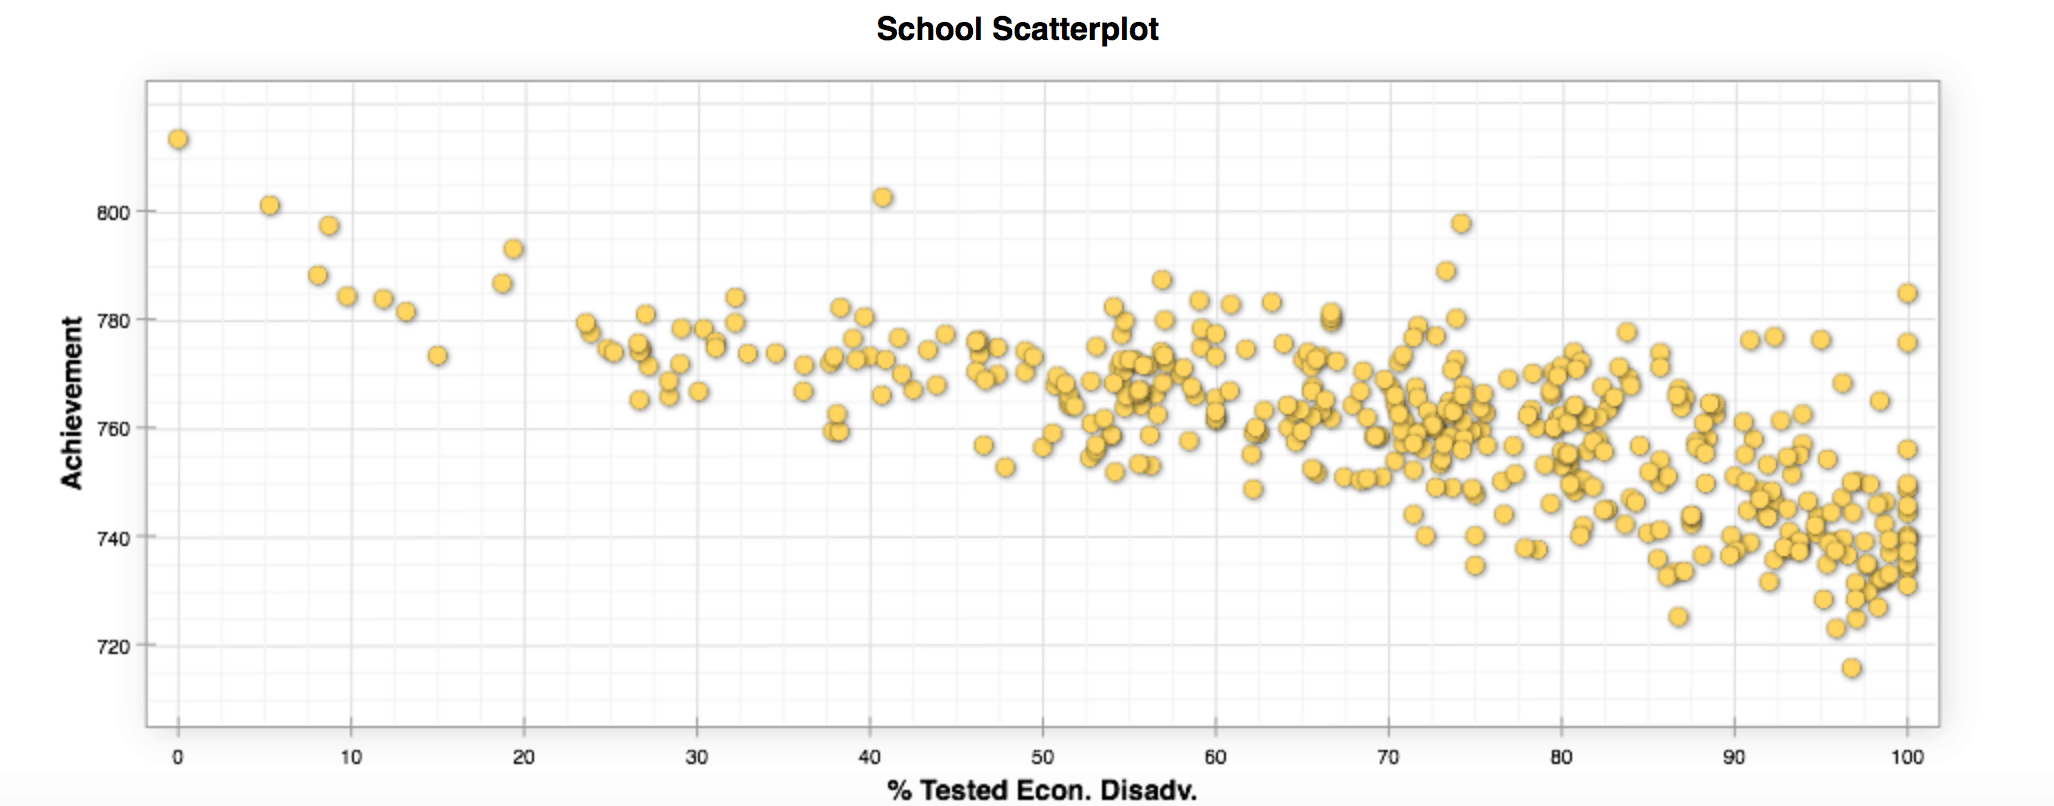
The chart shows a correlation between economic status and achievement. The bottom axis shows the percent of economically disadvantaged kids from 0 on the left to 100 on the right. The left side axis is the level of achievement going from lower towards the bottom and higher towards the top. From left to right on the graph, the number of economically disadvantaged students increases as achievement levels decrease.
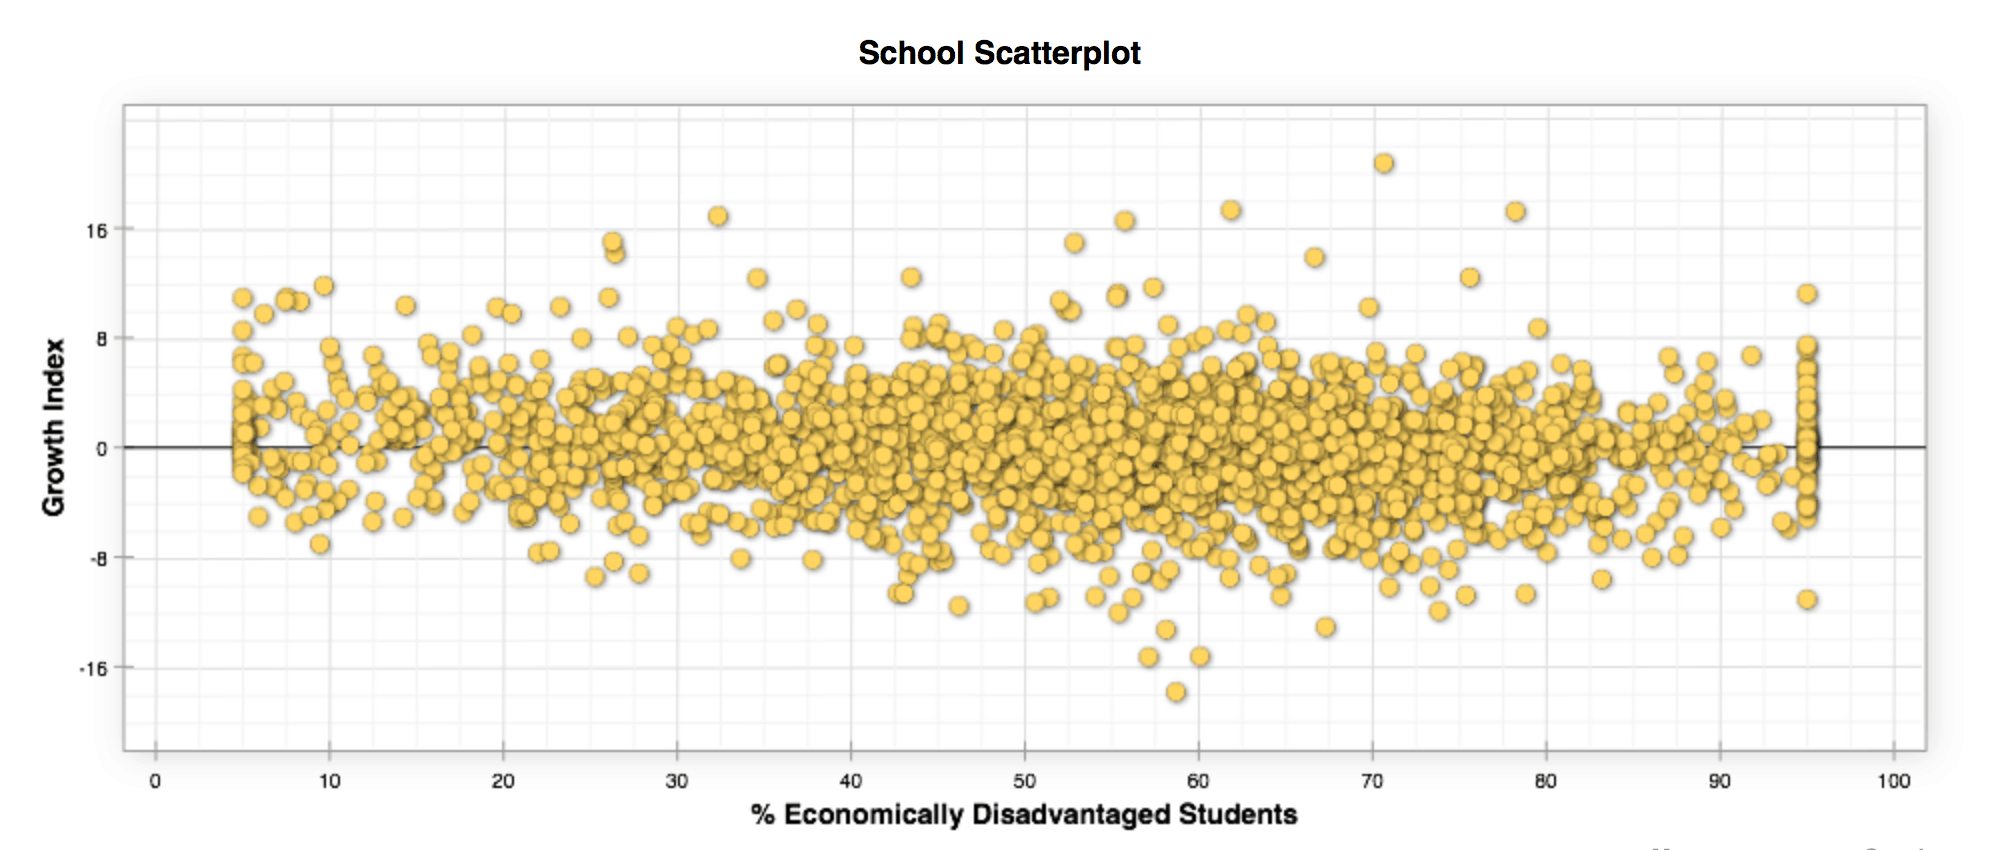
There is not, however, a strong correlation between growth and economic disadvantage. If you look at a chart measuring student growth against students’ economic status, it is much more flat because, no matter how well a student is doing in regards to achievement, every student may grow. Low achieving students can meet or exceed growth. The same is true of high achieving students.
North Carolina’s public system does allow a comparison of growth and economic status. This chart compares growth to economic status for all students in North Carolina for 2017.
Teachers can not see all the data used to calculate growth. Growth data was used as an official part of a teacher’s evaluation by the state until the State Board voted to end it in April 2016. It is not presently used in the state’s teacher evaluations.
Teachers, what do you think about EVAAS? We want to hear about your experiences. Tell us your thoughts:
Editor’s Note: SAS and the Goodnight Educational Foundation are contributors to EducationNC.

Recommended reading