
Hunt Institute and Data Quality Campaign shed light on student growth complexities


In the realm of assessing student performance, two main education data measures are often discussed: student growth and student achievement. Measures of student growth use an individual student’s test score data at multiple points over time to evaluate an aspect of that student’s performance. Unlike student achievement, which reflects performance on a single test at a single point in time, student growth metrics allow for a richer picture of student performance.
But the term “growth” doesn’t mean just one thing. Rather, it’s defined, tracked, and implemented differently across all 48 states and the District of Columbia that have committed to measuring student growth under their Every Student Succeeds Act (ESSA) plans. This was the topic of the Hunt Institute’s most recent Intersection webinar held on Wednesday. Allison Goff, associate policy analyst at the Hunt Institute, spoke with Taryn Hochleitner, senior associate of policy & advocacy at Data Quality Campaign, about the complexities of student growth data.
Hochleitner highlighted key takeaways from a Data Quality Campaign report released in January entitled “Growth Data: It Matters, and It’s Complicated.” While student growth measures are available to the public in school report cards, they are often difficult to understand. This was one of the driving forces behind developing the report.
“Even though growth measures have been around for a long time in the education policy community, these measures are not necessarily familiar or household names to regular people — people who might be using these report cards to understand school performance,” said Hochleitner. “And we haven’t come up with good language to explain growth measures, and they’re not always intuitive.”
The main point of the webinar was this: Not all growth measures are created equal. According to Hochleitner, each of the following types of growth measures lead to different conclusions that answer different questions about what’s happening with a student’s performance.
“You can think of a growth measure as a complicated math problem,” said Hochleitner. “What these measures have in common is they all use the same student’s longitudinal performance data on assessments, but they use different methods and different math to analyze that data.”
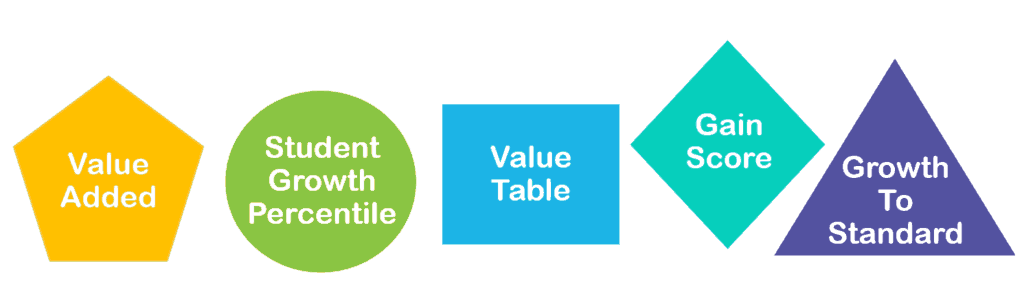
During the webinar, Hochleitner briefly reviewed the five most common growth metrics.
- Value added: Measures the impact of adults on student achievement. These measures take into account things about a student — like past performance or socioeconomic status — and then predicts what a student would score on an assessment. Then, it compares that prediction with how the student actually performs and contributes any differences in performance to the teacher. This measure is used in North Carolina, South Carolina, Pennsylvania, Ohio, and a few other states. For more on EVAAS, click here.
- Student growth percentile: Measures how a student’s performance ranks compared to academic peers. These measures group a student with other students across the state who received the same score on a previous standardized test. Then, it ranks students compared to their peers based on how they perform this year.
- Value table: Measures change in student progress between performance levels year to year. States create performance level bands made up of test score ranges and then track when students move between performance levels from year to year.
- Gain score: Measures student progress year to year, similar to simple subtraction of scores between years.
- Growth to standard: Measure a student’s distance from learning goals. Consider how long it will take a student to attain proficiency by a certain time. Reflect if a student is on track to achieve proficiency.
According to Hochleitner, value added and student growth percentile measures are useful for identifying low-performing schools and drawing comparisons but do not look at student progress relative to learning goals. In contrast, value table and gain score measures look at how students are doing relative to learning goals but can be subject to the same limitations as proficiency rates, such as being highly correlated to a student’s socioeconomic status or race.
The following map shows which growth measures states committed to using under their ESSA plans, but states have the flexibility to change which growth measure they use during implementation.
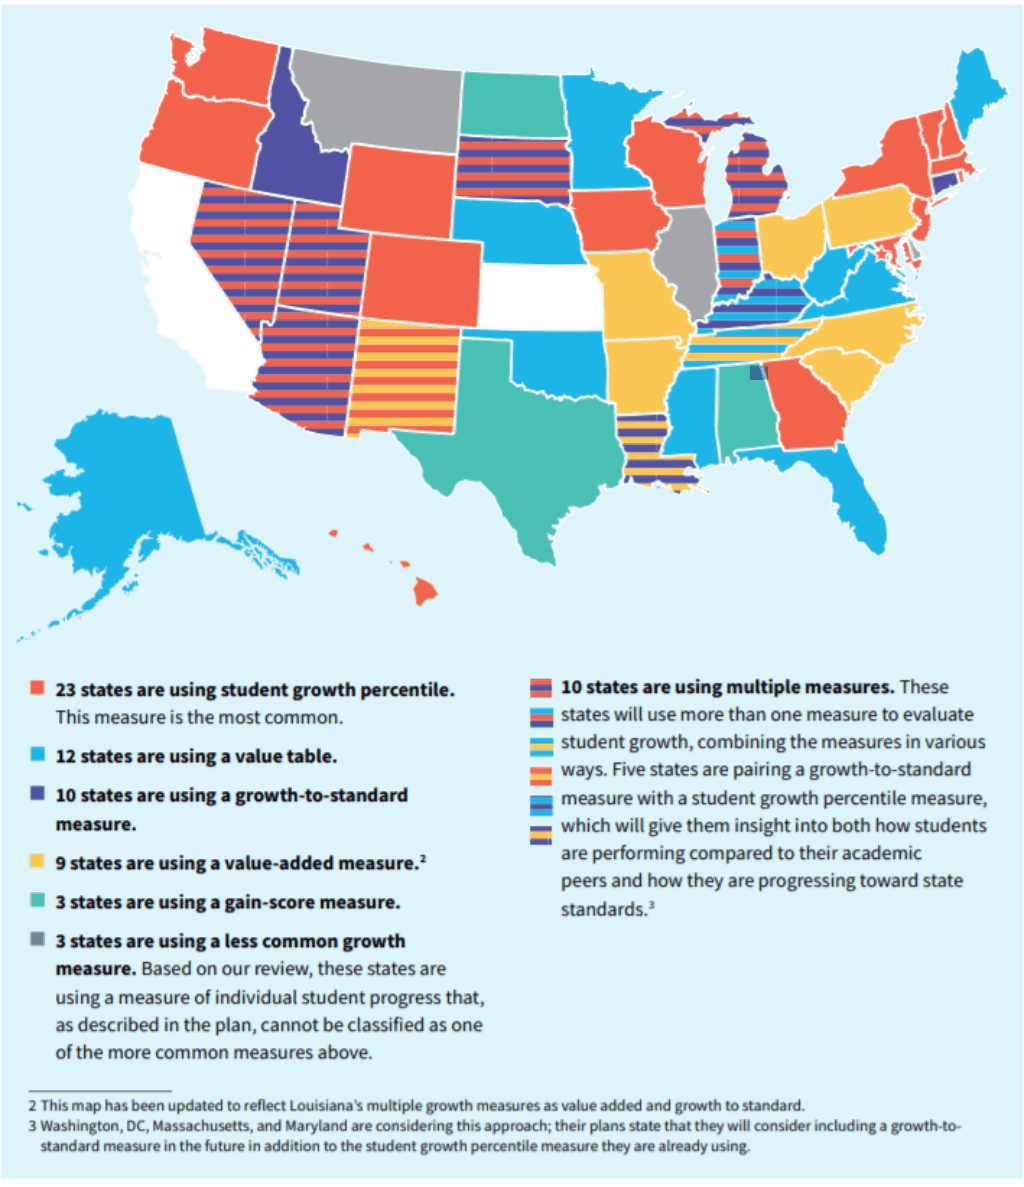
Even though North Carolina and South Carolina both use value added measures, they aren’t the exact same measure. States have the flexibility to customize exactly how these growth measures are calculated and how they are implemented into their ESSA systems. According to Hochleitner, this means that virtually no two states are doing the exact same thing when it comes to measuring student growth, even if they use a common measure.
The Hunt Institute’s Intersection webinar series is held bi-weekly. The next webinar on Feb. 27 will address the inclusion of equity in postsecondary attainment goals with Dr. Tiffany Jones of The Education Trust.