
This fall, we’re back to school and back to mapping school grades after a two-year hiatus. Former features on Consider It Mapped covered grades from the 2013-14, 2014-15, and 2015-16 school years and the controversy over the equations used to derive the grades. This year, we’re expanding the functionality of the map and accompanying data visualization with a number of filters so users can play out different scenarios, pulling information for like districts and schools.
A quick primer before we dive in
- The Department of Public Instruction (DPI) reports school performance grades annually. Reporting of grades in their current form began in 2013-14.
- Academic achievement, including measures of student progress like test scores (ex. End-of-Grade, End-of-Course, and ACT test results), graduation rates, and measures of work readiness, makes up 80 percent of a school’s grade. School growth, measured by the extent to which students met or exceeded the state’s performance expectations for that school for that year, makes up the other 20 percent.
- Currently, DPI reports grades on a 15-point scale. 1
- The way that DPI calculates grades changed in 2017-18. Changes encompassed adding, removing, and combining variables, and adjusting guidelines for student-level analyses. 2 For this reason, users should proceed with caution when comparing 2017-18 grades with those from prior years. At a high level, comparisons may provide perspective, but users cannot assume a one-to-one relationship regarding increases or decreases in school grades between the 2016-17 and 2017-18 school years.
- Finally, we want to emphasize that school grades are just one method of school assessment. Dr. Tammy Howard, Director of Accountability Services at DPI, phrased it well in an interview with WRAL: “We always stress with any kind of data that it’s one piece of information and should be taken in the context of what it is reporting.”
Now that we’re all on the same page, let’s get into the map and data viz.
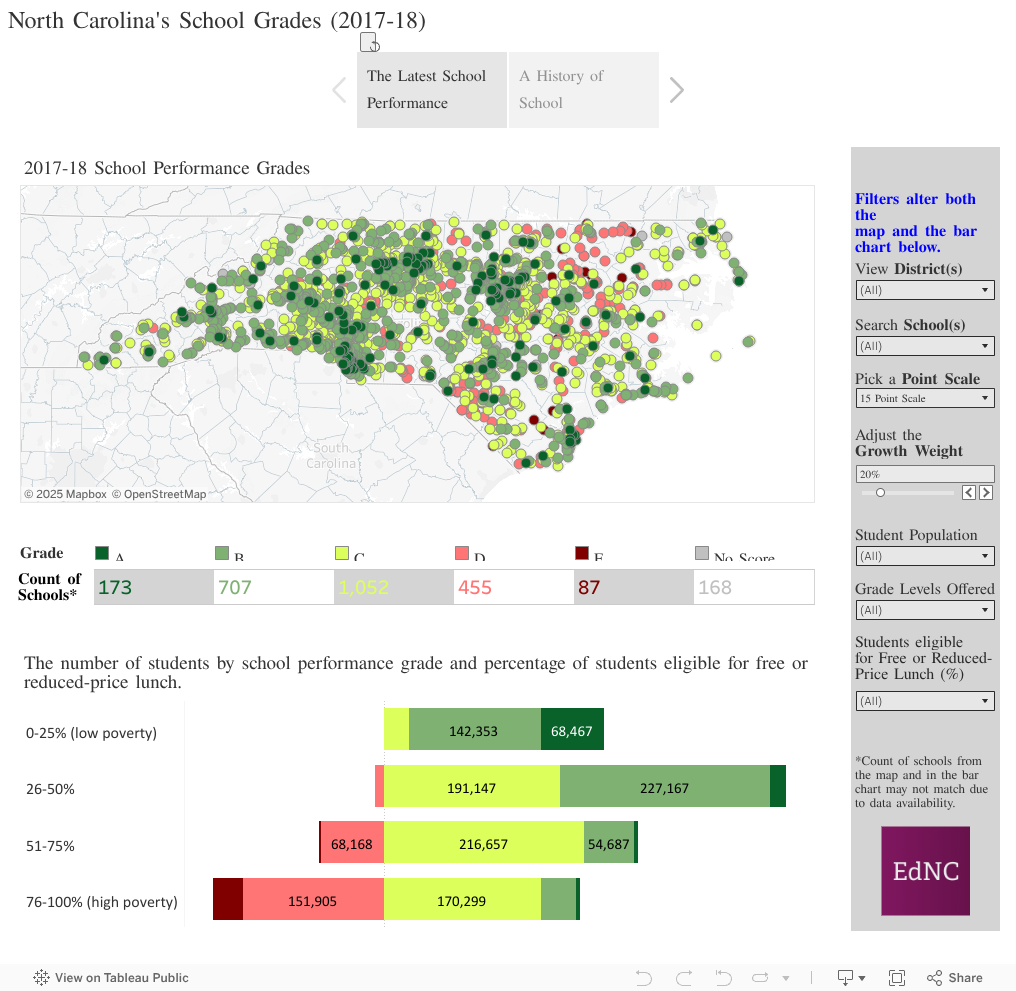
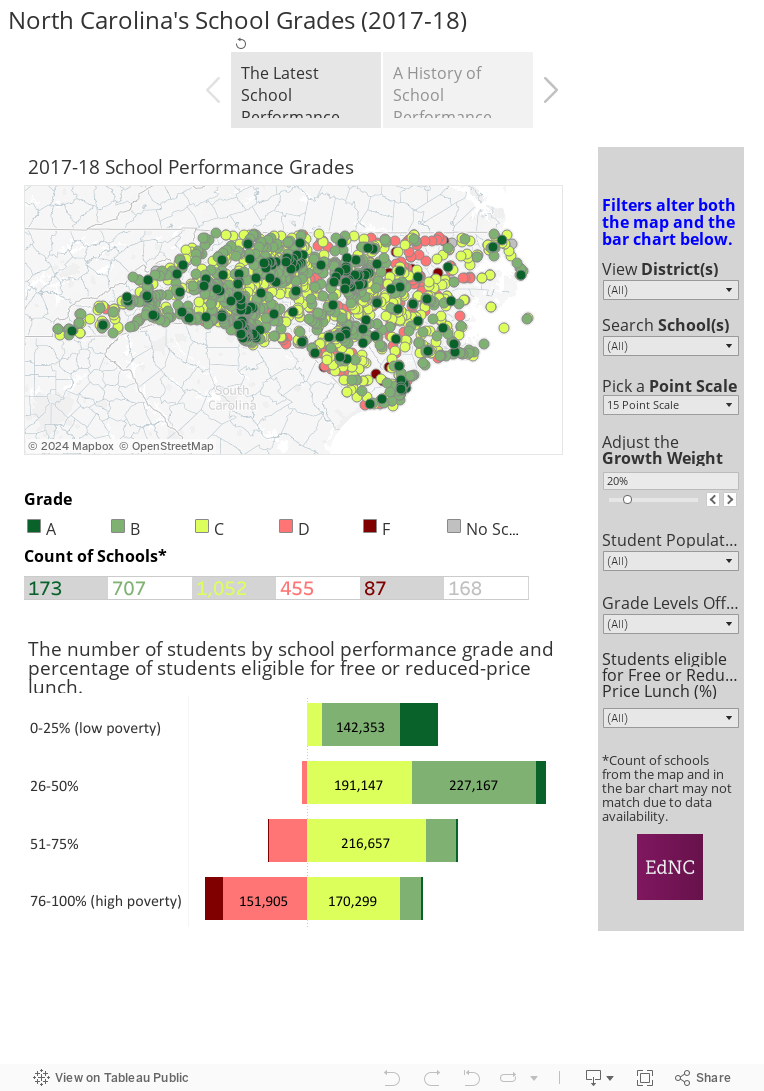
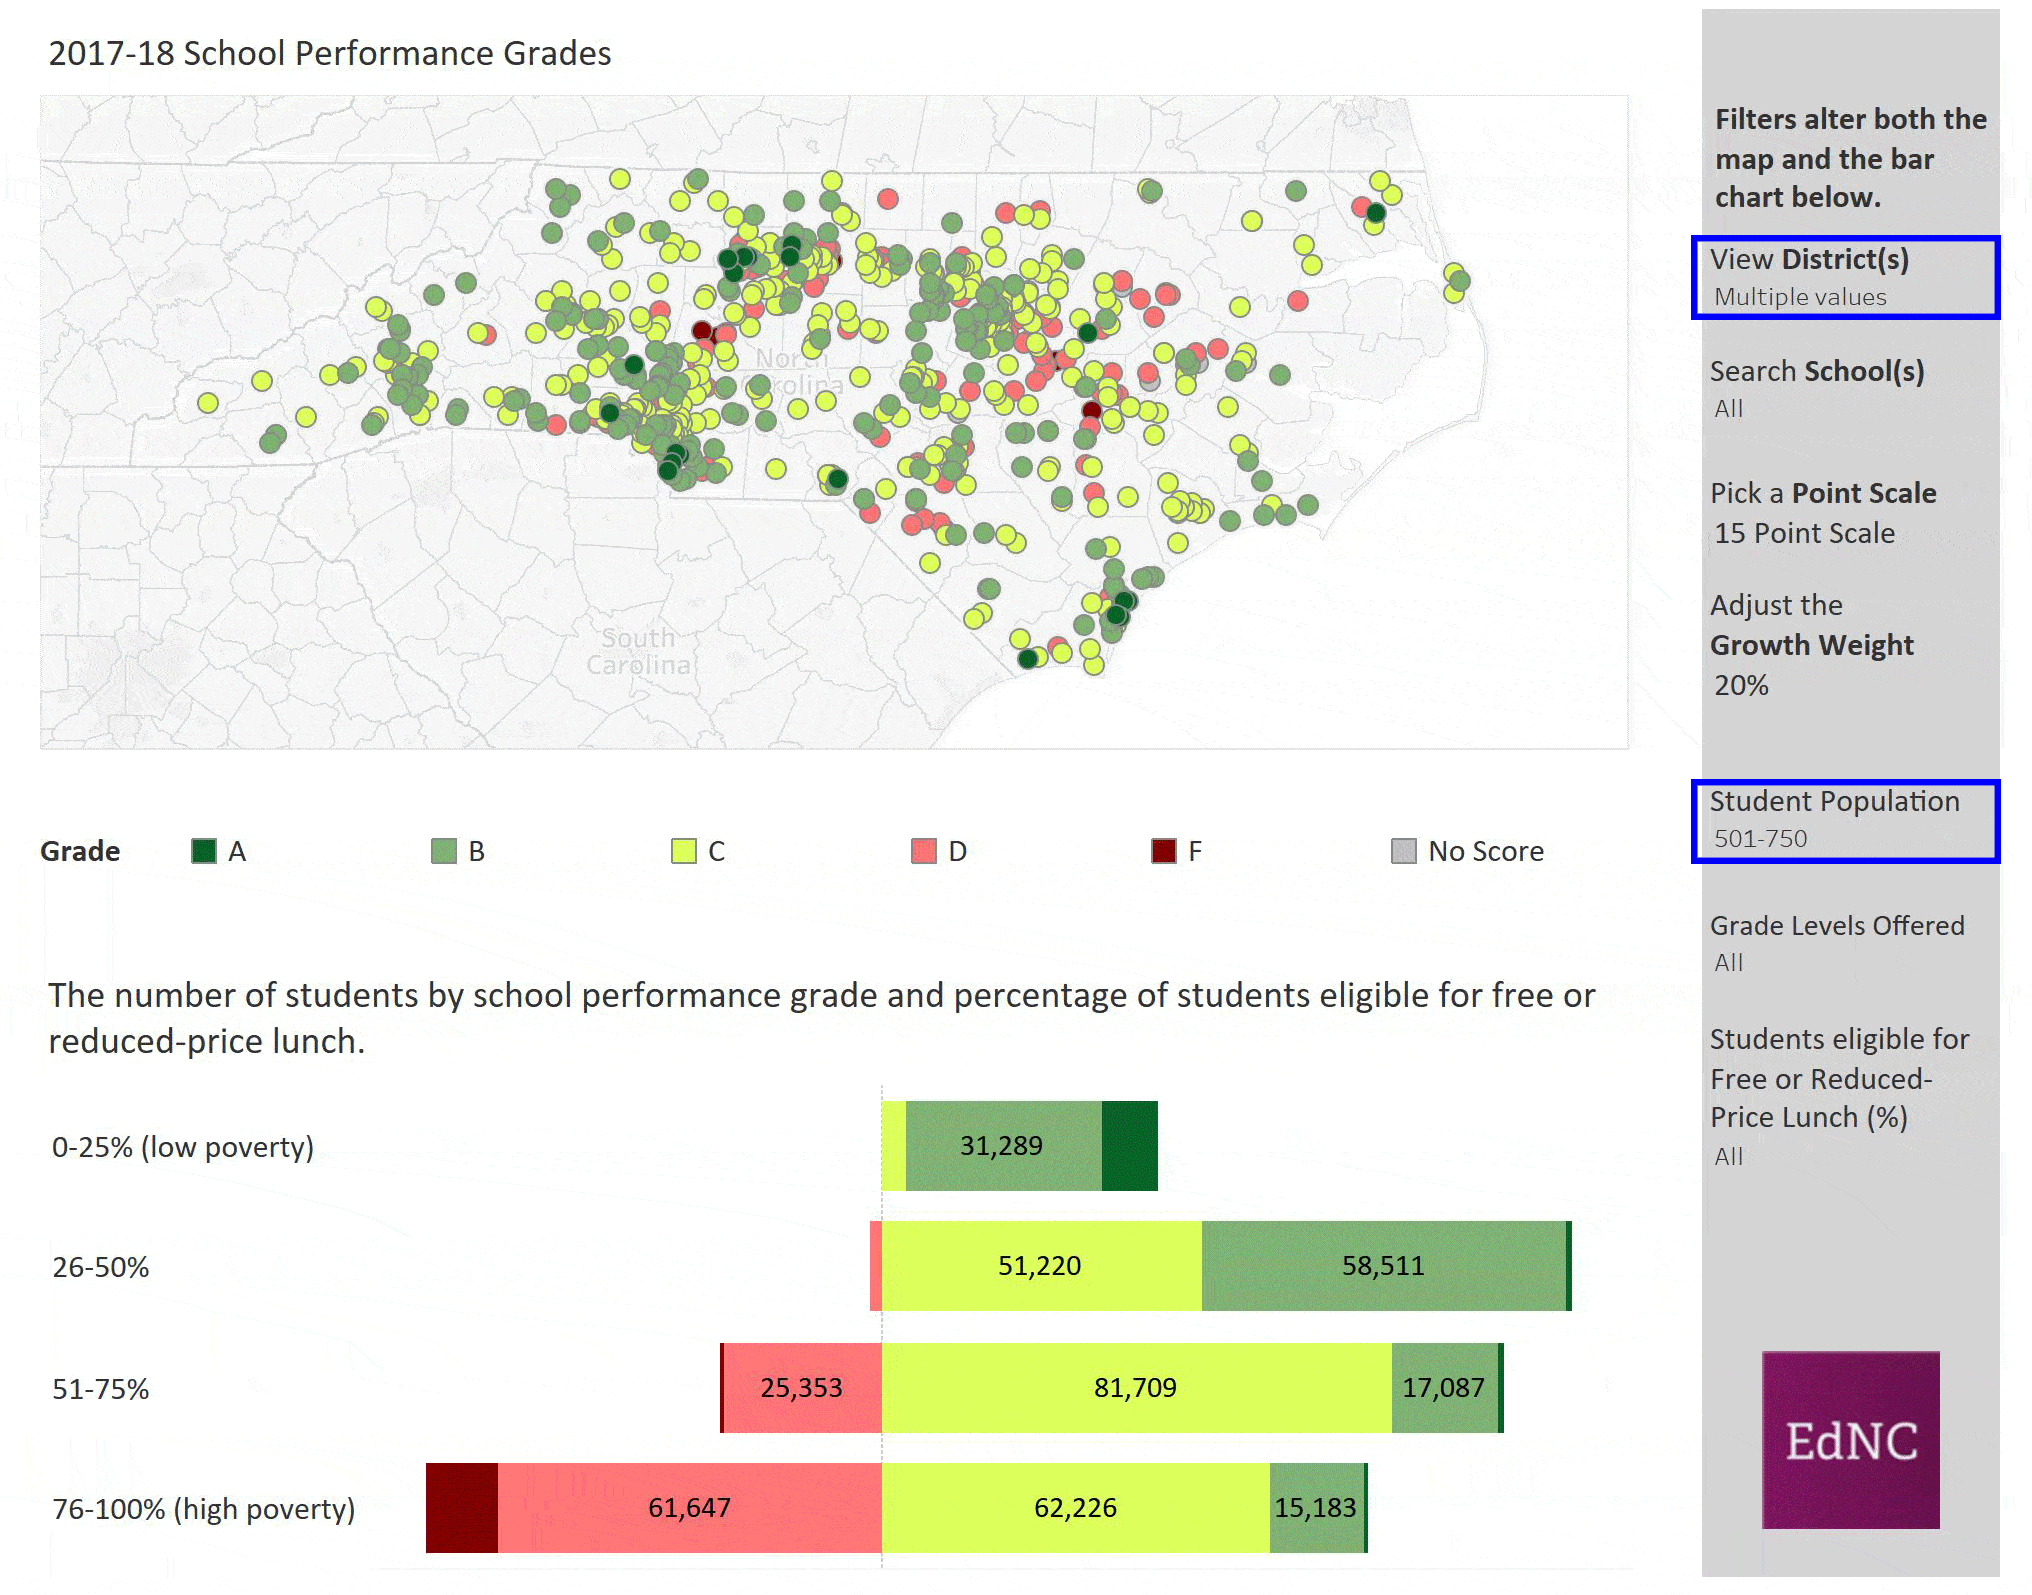
This year, our map displays grades for the 2017-18 school year. As in previous maps, users can adjust the growth weight (set at the current 20 percent) and point scale (set at the current 15-point) and search for their district or school. Further, we’ve added three additional filters, one for student population (a proxy for school size), one for grade levels offered, and one for percentage of students eligible for free or reduced-price lunch (FRL) (a proxy for student poverty). All filters in the sidebar control the map and accompanying bar chart below.
The bar chart shows the number of students by the letter grade their school earned. The bar chart is further subdivided by percentage of students eligible for free or reduced-price lunch at each school, which we are using as a proxy for student poverty: eligibility of 0-25 percent indicates lower levels of student poverty in a school and eligibility of 75-100 percent indicates high levels of poverty.
Let’s go through three scenarios to demonstrate the functionality of the map and bar chart:
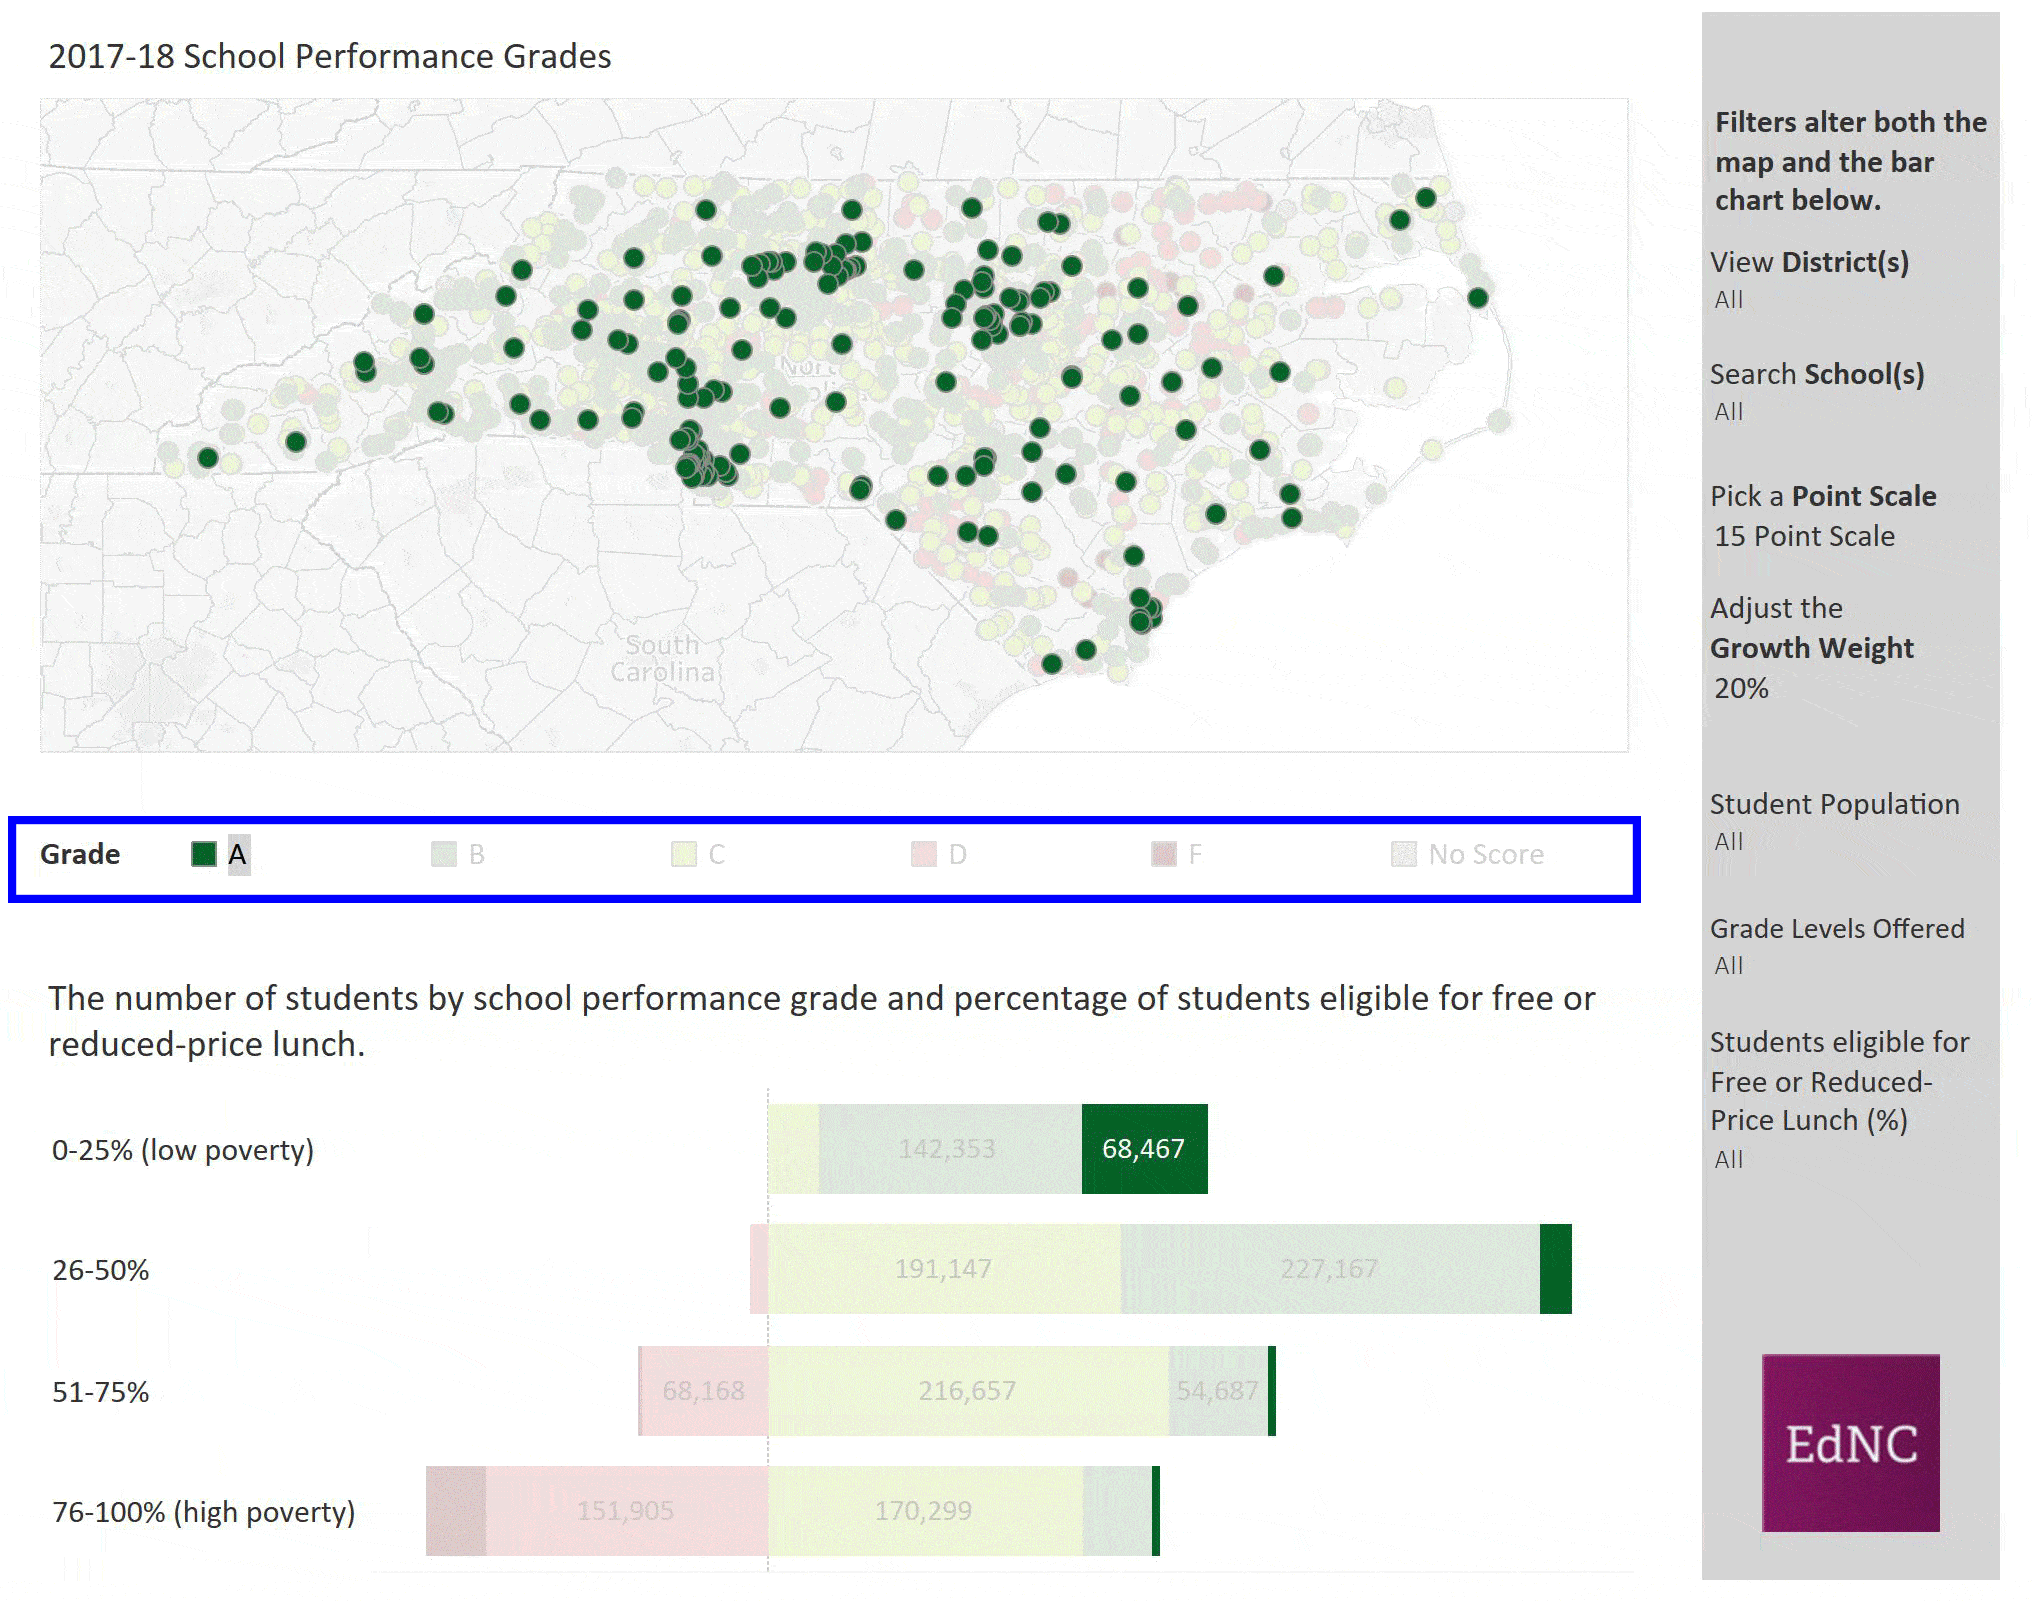
1. Click on the letter grades in the legend individually to show the distribution of schools statewide earning each grade. The bar chart below highlights the number of students in schools earning each letter grade, cross-referenced with the percentage of students eligible for FRL.
With the current state parameters (80 percent academic achievement, 20 percent growth, 15-point grade scale), you will see that the majority of schools earning As have low rates of student eligibility for FRL (0-25%). School performance grades of B and C are most common and occur throughout the state. FRL eligibility varies in these schools, with student representation at every tier.
Finally, the distribution of Ds and Fs statewide is sparse, but these grades tend to occur in schools with high rates of FRL eligibility. That said, the overall percentage of students in schools earning As, Bs, and Cs outweighs the percentage of students in schools earning Ds and Fs (hover your mouse over each section of the bars for percentage of students).
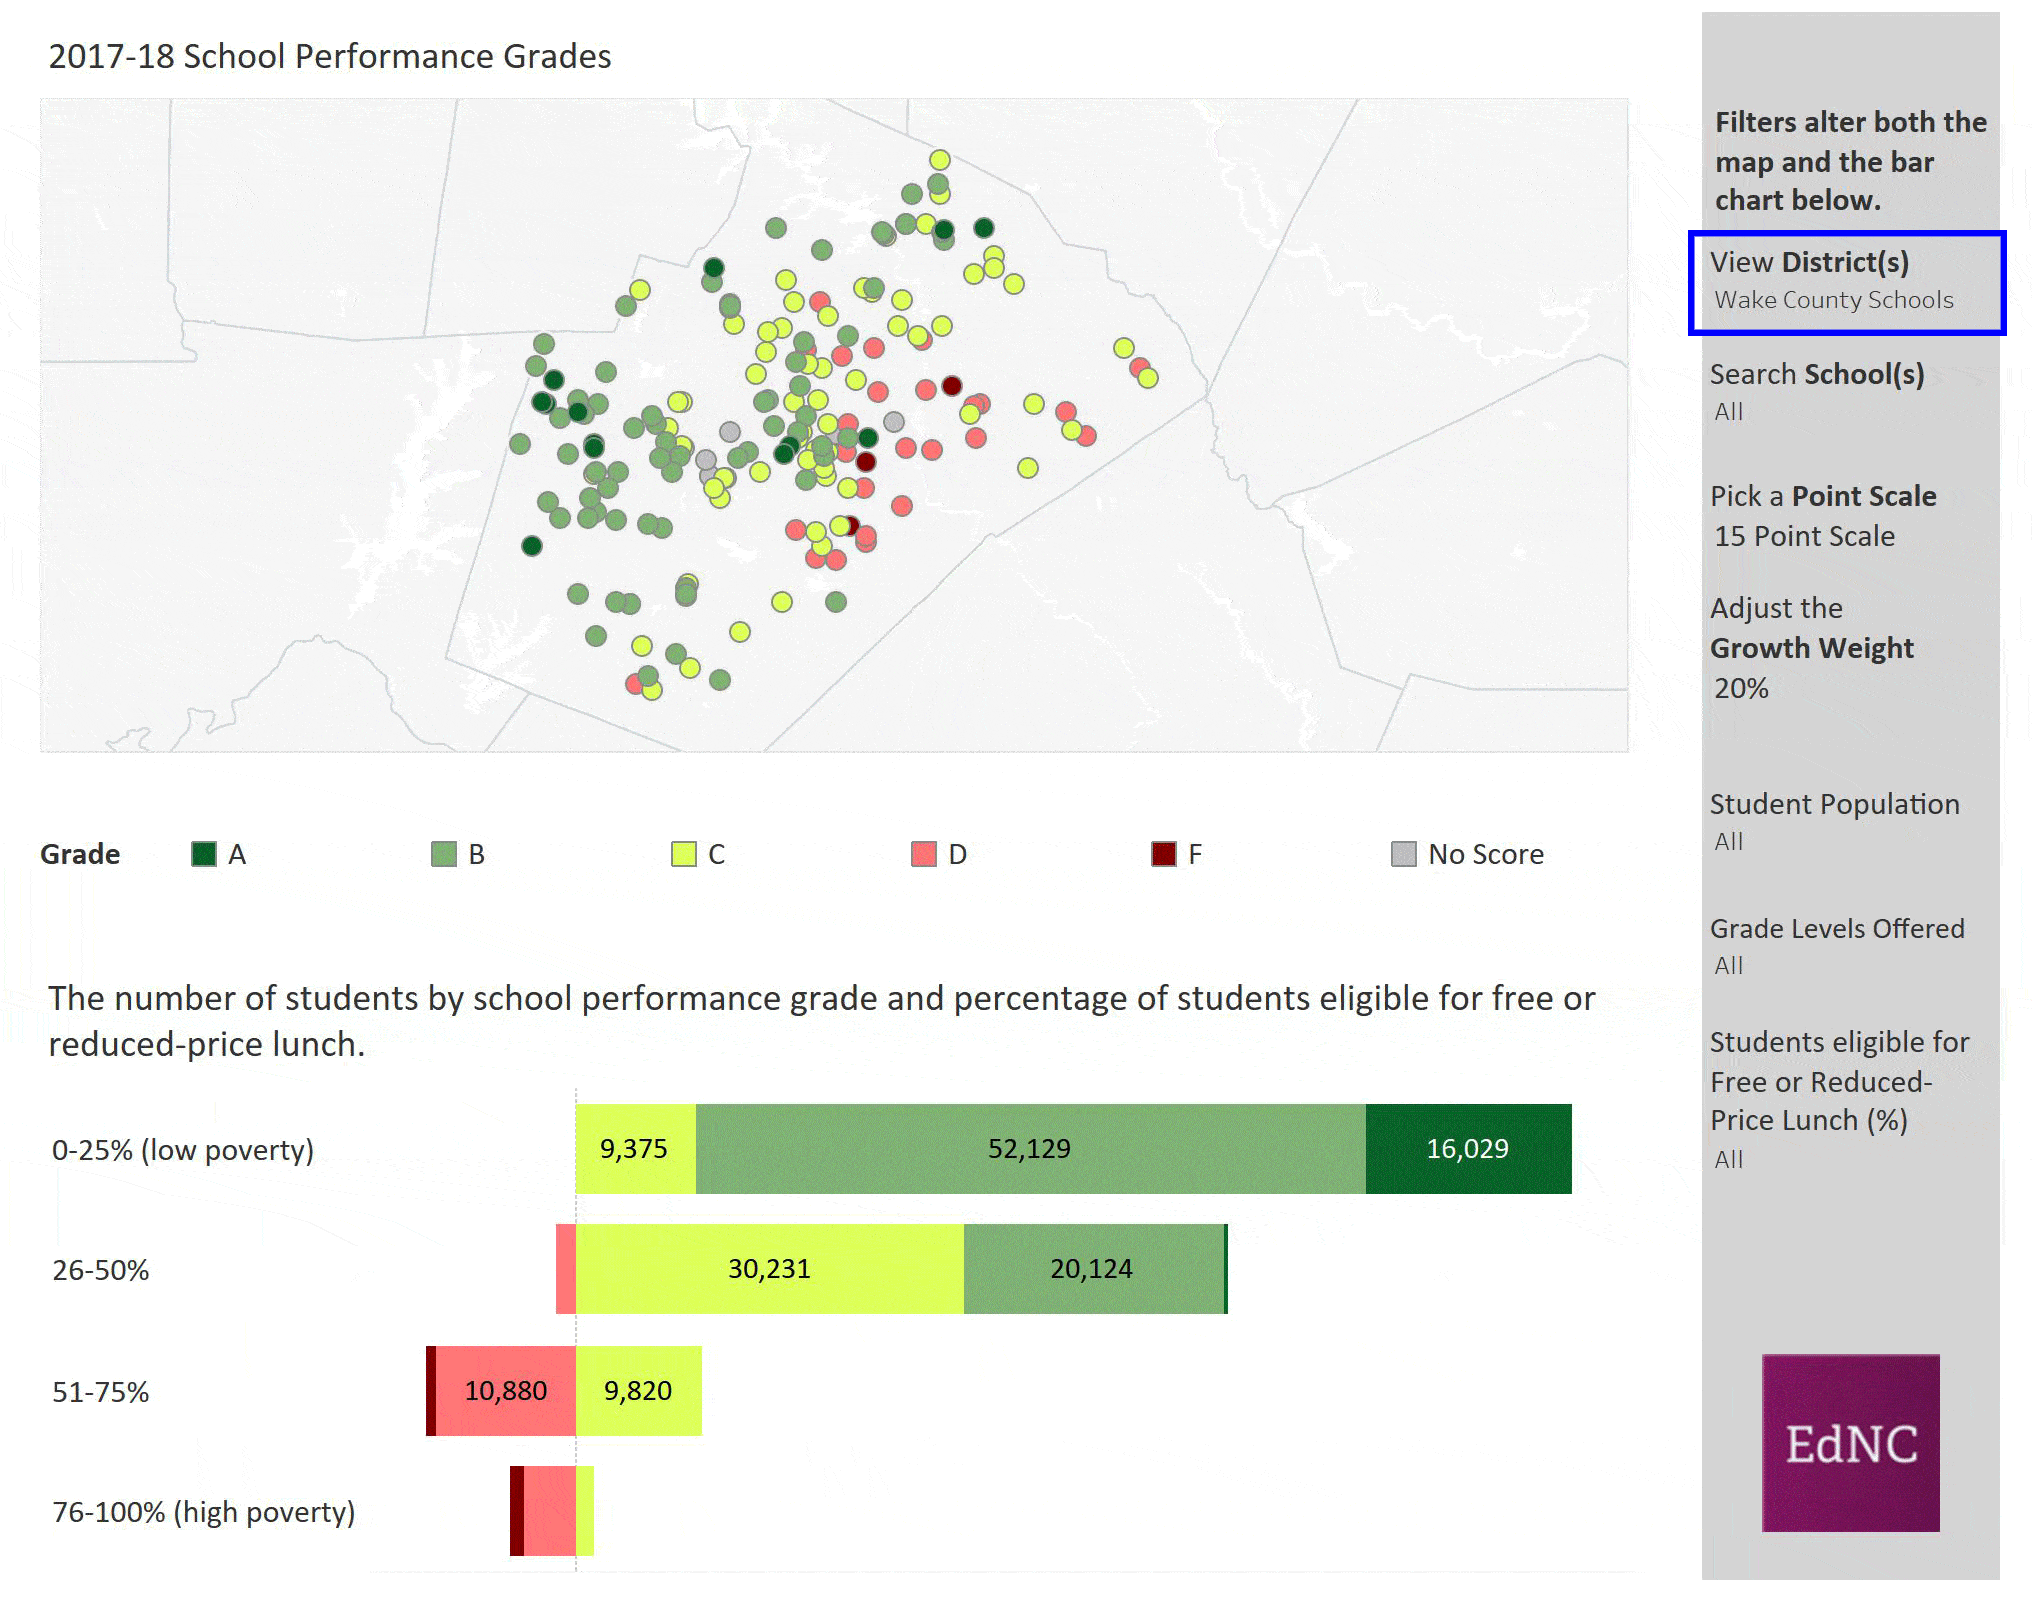
2. Now, let’s zero in on a specific county – Wake. Again the map shows the distribution of schools by letter grade across the district, and the bar chart shows the number of students in schools earning each grade crossed with FRL. Based on the current configuration of the school grades, about 88 percent of Wake County students attend schools with performance grades of A, B, or C.
If we change the growth weight to 50 percent (meaning academic achievement weight is also 50 percent), 94 percent of students would attend schools earning As, Bs, or Cs, and no schools would earn Fs.
However, if we return to the original parameters (20 percent growth, 80 percent academic achievement) but change the point scale from 15-point to 10, about 56 percent of students would attend schools earning As, Bs, or Cs. The percentage of students attending schools earning Ds or Fs would shift from roughly 13 percent under the 15-point grading scale to 45 percent under the 10-point scale.
3. Finally, let’s examine a specific scenario using some of our new filters. First, we want to look at only public schools, so under the “View Districts” filter, we uncheck “Charter Schools”. Then, we want to examine mid-sized primary schools with student populations of 501-750, so we select “501-750” under “Student Population” and “1-Primary” under “Grade Levels Offered.”
Here, you can conduct a similar exercise where you click on each grade in the legend and examine the distribution statewide. As before, clicking on the grades in the legend will highlight students by FRL eligibility in the bar chart below. Now, you can adjust your growth weight percentage and grade point scale to see how mid-sized elementary schools as a group would fare if the state adjusted these parameters for calculating school performance grades.
A final word
In the beginning of this article, we cautioned against comparing the 2017-18 school performance grades with those of prior years because of adjustments in the formulas. Even so, many might be wondering, “Did the new configuration improve my school’s grade?”
The second tab at the top of the visualization titled “A History of School Performance Grades 2013-18” allows you to look up reported grades for each school for each year, starting with the 2013-14 school year. Search for your district, search for your school, and check out the changes over time. While users cannot attribute 2017-18 grade improvements or declines to changes in variables from the 2016-17 year, users can determine if the new calculations are in their favor.
Did your school or your child’s school fare better, worse, or on par with your expectations? Please share your thoughts and reactions with us in the comments or on Facebook and Twitter.
About the author