Editor’s Note: There appear to be some rounding errors with the publicly-available data used to generate this year’s map. We are working to correct mistakes, and we appreciate any feedback from users who detect errors we miss. The issue appears to be isolated to scores on the border between two grades (e.g., between a B and a C).
It’s hard to believe, but fall is already here and we’re revisiting school assessment with the release of the state’s school grades for the 2015-16 school year. Our format is the same as it was for our 2013-14 and 2014-15 maps. In the 2015-16 iteration, we’ve included grades from past years and we’ve pulled out some new nuggets to share.
A quick primer
In the 2013-14 school year, North Carolina started to evaluate school performance in a new way by assigning schools letter grades A through F. Eighty percent of a school’s grade is based on school-wide achievement, including measures of student progress like test scores (i.e., End-of-Grade, End-of-Course, and ACT test results), graduation rates, and measures of work readiness. The other 20 percent of the score is based on school growth, measured by the extent to which students met or exceeded the state’s performance expectations for that school for that year.
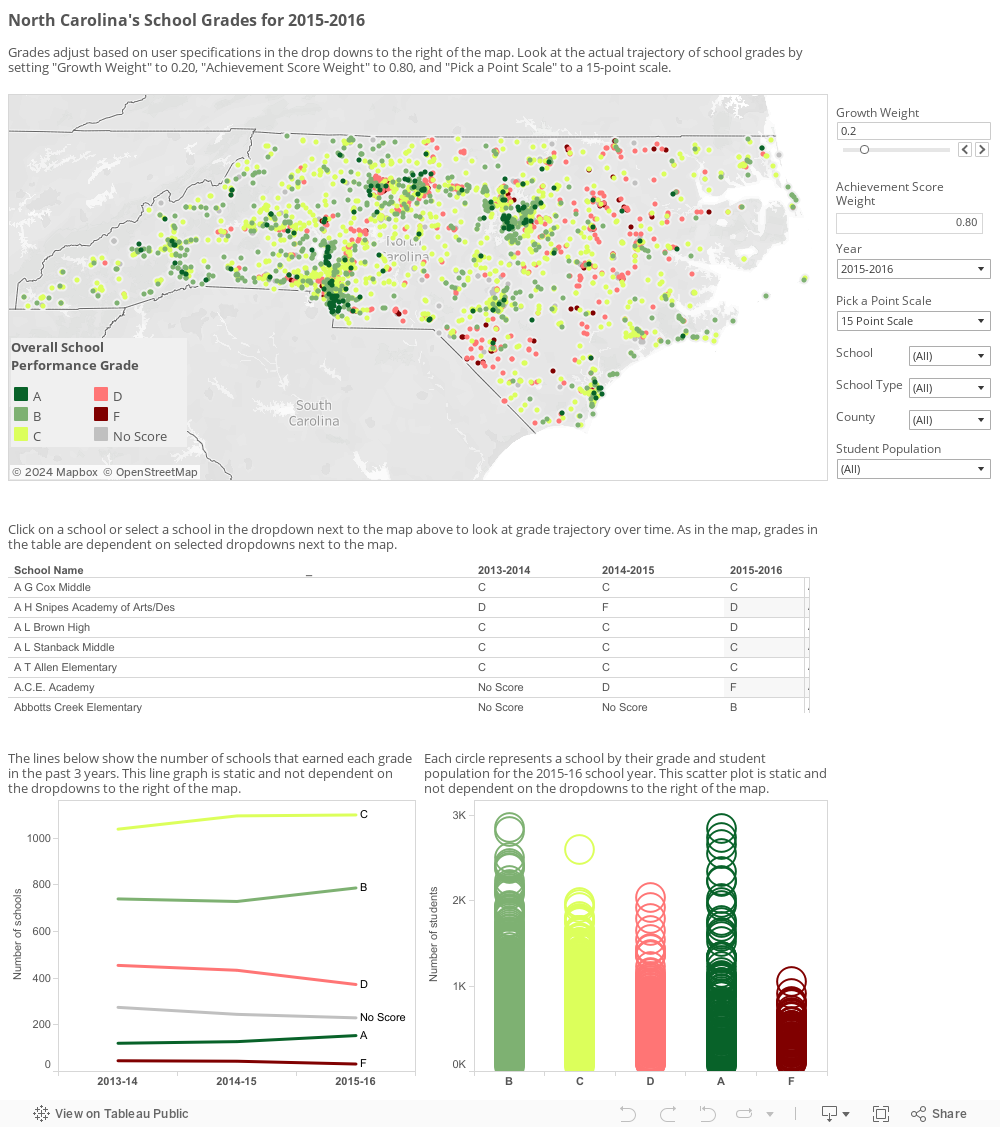
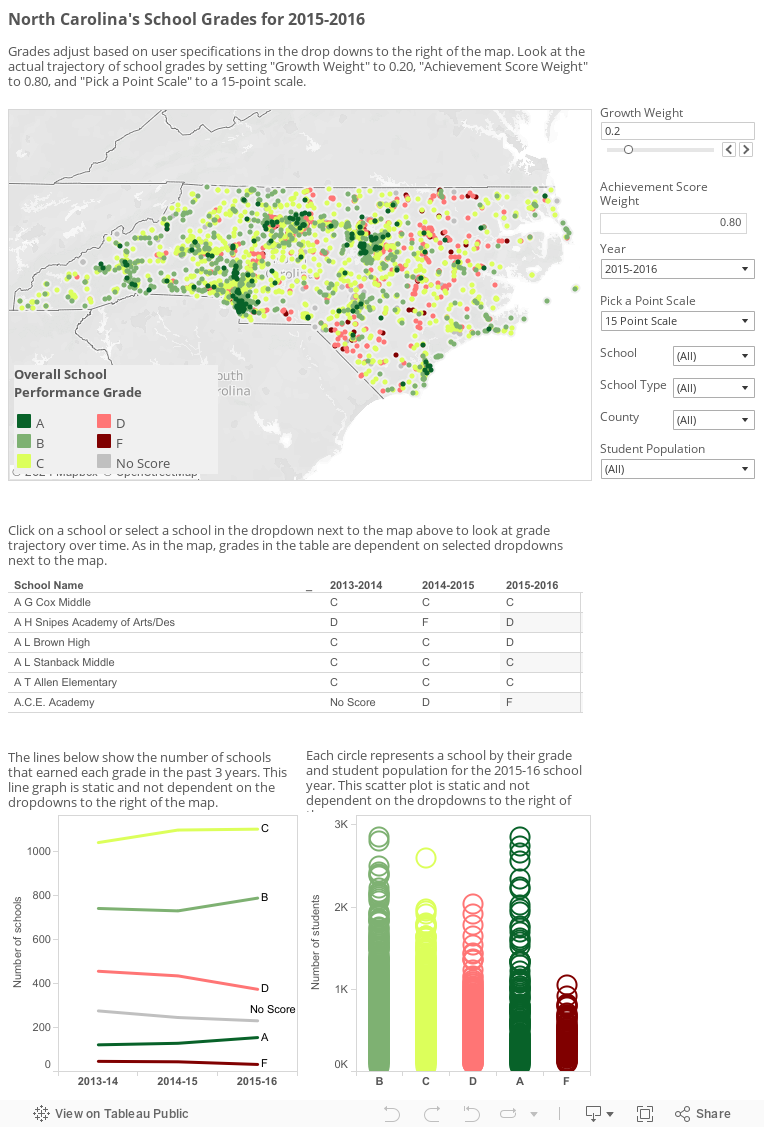
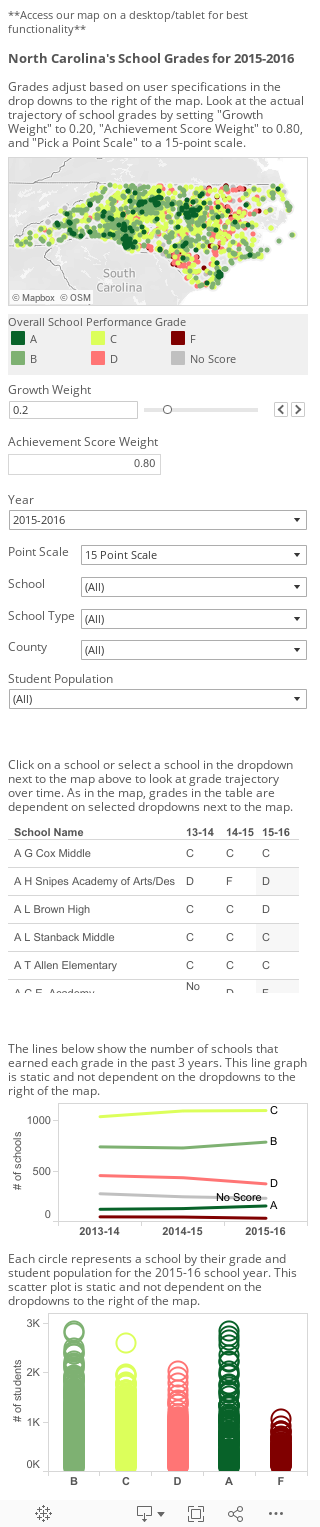
These grades have been controversial since their initial release. For instance, there have been calls to change the weight of the student achievement and school growth in the overall grade calculations, and changing the grade scale from 15 points to 10 was considered last year. To understand the impact policy changes like these would have on the grades, this year’s map, like last year’s, allows users to adjust the weighting of student achievement and growth scores using a growth-weight slider scale (the scale is initially set to 0.2, or 20 percent, and as you adjust the growth weight, the achievement weight will adjust to keep the overall total at 100 percent). It also allows users to switch views from a 15-point scale to 10. For more about the map’s functionality, please see the article that accompanies the 2013-14 map, linked above.
What’s new
We now have three years of data to share, so this year we wanted to look at the trajectory of grades by school over time. In addition to showing this information on the map, we also included a new table. The grades in this table are calculated based on the maps’ filter settings, so you can look at the actual trajectory of school grades (by setting the achievement score weight to 0.80, the growth score weight to 0.20, and the grading scale to the 15-point scale) or trajectory based on whatever combinations of hypothetical achievement score and growth score weightings and point scale you want to explore. The table presents the information by school, and will filter down to show only specific schools when you select a school (or schools) in the map filter drop-down list above, or by simply clicking on a school (or schools) in the map.
In the line graph next to the table, we take a look at the number of schools earning each grade over time. The lines show that, across all three years, C’s are the most common grade and F’s the least common among schools statewide. In addition, A’s, B’s, and C’s have increased while D’s and F’s have decreased, though the changes over time have been slight.
For consideration
As we’ve mentioned in the past, a school is not defined only by its grade. Similarly, a school’s grades cannot be attributed to any one factor. We’ve talked about this concept many times on Consider It Mapped, but it bears repeating here:
Very often in education, there are a host of factors that contribute to any one outcome.
In this case, school grades are composed of various student achievement measures, but to what extent are students’ achievements products of good teaching? School resources? The surrounding community? Following this line of thinking, school grades could also be influenced by the proportion of students in need of financial assistance, dollars funneled into school resources and teacher training, and so much more.
While we can’t look at the interplay of all of these factors without a more in-depth statistical analysis, we did want to look at at least one factor this year that some of you have asked about in the comments sections for past maps: school size.
There are two ways we chose to look at school size this month: 1) through a scatter plot showing school grade and student population; and 2) through a drop-down option on the map that allows you to select groups of schools based on the sizes of their student populations. The scatter plot shows that the distribution of A’s and B’s includes the widest range of student populations – small schools earn A’s, large schools earn A’s. The distribution of C’s and D’s is relatively similar. The most interesting piece of the scatter plot is that the distribution of F’s tends to lean toward smaller schools.
But is the size of the school the reason for the F grades, or is there some other factor that influences both school size and school grade? For instance, the grade and the school population may both be a product of geography, the prevalence of student poverty, or even the grade levels these schools serve: e.g., are these mostly elementary, middle, or high schools?
We can use the map to start to answer some of these deeper questions. For instance, to explore whether these grade patterns might have anything to do with location, use the Student Population drop-down menu to select only schools with student populations below 750, then click on “F” in the map’s legend. You’ll see that these smaller schools are not clustered in any one county or region.
As we’ve said in many other editions of Consider It Mapped, it is really important to caution our readers at this point that, while the maps can help us identify potential relationships between factors that may be worth further research, they don’t provide us with the information we would need to draw conclusions. So, even if it appears in the map that a school’s grades are not strongly correlated with student population or location alone, this is not to say that these factors are not part of a larger group of variables that contribute to grades, if we included these factors alongside others in a more rigorous statistical analysis. It’s also possible we’re not using the right lens: with location, for instance, maybe it’s not about general physical location, but more about neighborhood characteristics, so thinking about location at a more precise level (say, by ZIP code) could yield different results.
All of this is to say that school grades in North Carolina are ripe for study. Unfortunately, the analysis is more than we can cover in our monthly feature, but it is our hope that if you are interested, you will pursue some of the leads we’ve mentioned above. I think we can all agree that schools shouldn’t be defined by one grade and that each grade is not attributed to only one factor, but there’s not yet consensus about what contributes to making a school an “A” school. However, with deeper analysis using the school grades, we can add another dimension to this conversation moving forward.
As always, we’d love to hear your thoughts. What do you think are some of the factors that contribute to consistently successful schools? Reach out to us on social media or in the comments to share.
About the author