The new public school reports cards are in. Wonder how your school fared? We’ve got you covered.
We’ve updated our maps from last year, now including both sets of data so you can easily compare progress from one year to the next. We’ve also included charter school grades for the first time.
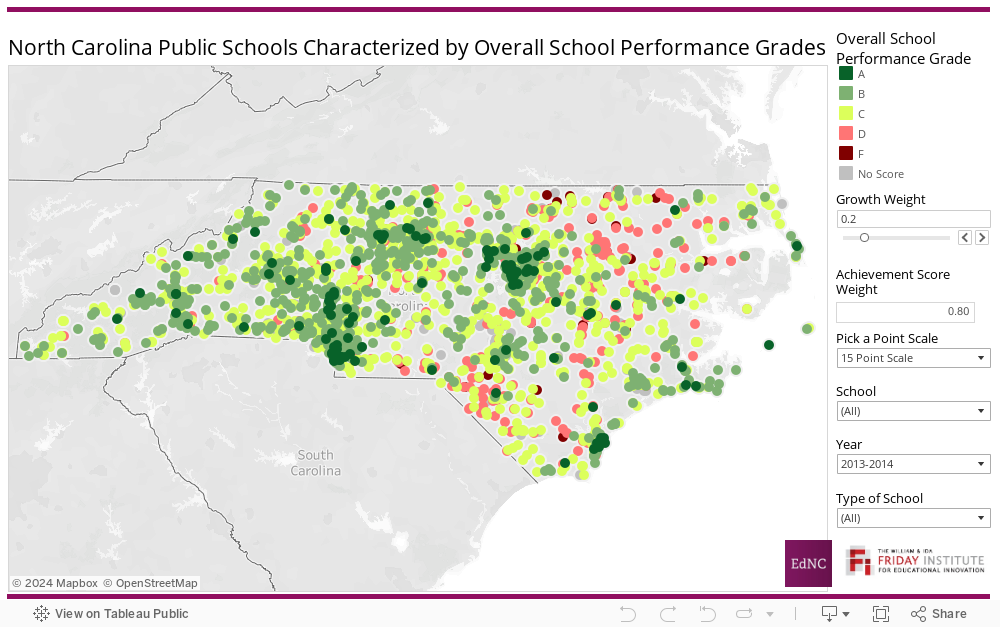
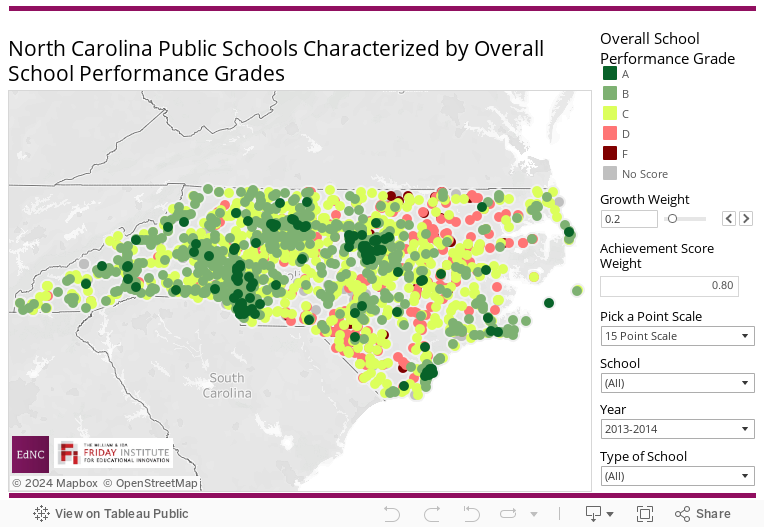
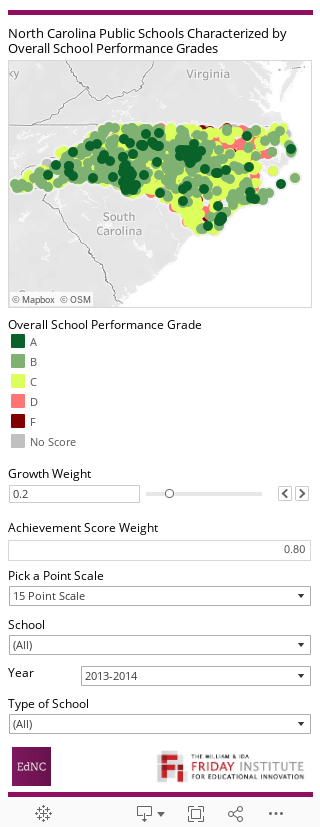
Remember, 80 percent of the school performance score is based on school-wide achievement, which includes scores from several measures of student progress (like End-of-Grade, End-of-Course, and ACT test results) as well as graduation rates and measures of students’ readiness for work. The other 20 percent of the score is based on school-wide measures of growth, or the extent to which students in a school met or exceeded performance expectations for that year. The map allows you to envision alternative approaches to grading by changing the growth score weight. For example, some have argued for the school growth score to be weighted as much as 50 percent (higher than the current 20 percent).
The options in the map’s sidebar further enable the user to zoom to specific counties or schools and even to choose between the current 15-point grade scale and the 10-point grade scale the state will use in a few years, letting the user view all of the data currently available in a variety of contexts.
Use the navigation in the right-hand column of the maps below to switch between years and hover your cursor over one of the dots, which are color-coded by grade type, to get more information about a school. You can use the magnifying option in the upper left-hand side of the map to dig down to a particular area of the state.
Data is important. It gives us a chance to quantify progress from year-to-year, but it should never be the sole definition of a school or its performance or the final word on a school’s worth to its community.
In each of those “D” and “F” schools, there are students who have made incredible strides in their academic performance. There are teachers who have forever changed a student’s life. There are principals who have changed the culture of a place. There are counselors who have helped a struggling child or her family.
As I noted in my first article on the 2013-’14 school grades:
“While schools that received high marks certainly have something to share and to be proud of, schools with low marks also should be offered the chance to share their accomplishments that are not reflected in their grades. We should all remember, too, that, just as we aren’t defined by an “F” we received on a physics test in high school, there is also so much more to our schools than their grades.”
As EdNC’s Mebane Rash noted when reflecting upon her son’s school’s “D” grade:
“Performance and growth matter. But I encourage parents who send their children to schools that receive low letter grades to circle in. Invest your time, energy, and resources in the school so that every child has access to a high-quality education, as measured by a wide variety of criteria determined not just by policymakers, but by students, teachers, administrators, and parents themselves.”
From A to F, we want to hear your stories of our schools and what you think of the letter grades.
About the author