

At one point or another, we’ve all experienced that feeling of pride that comes with getting a good review or grade that is hard-earned. Whether it offers you a bump in your reputation or the satisfaction of personal achievement, that’s a great feeling right? It’s likely that we’ve all experienced the opposite as well – a poor grade or review that you feel didn’t really reflect your efforts. If you’re like most people, you probably felt frustrated and wanted to explain the extenuating circumstances that kept you from performing your best.
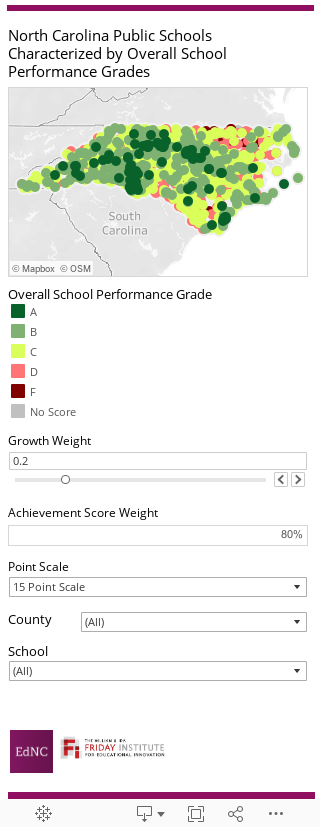
Earlier this year, the state of North Carolina changed the way that overall school performance is reported by assigning an A-through-F letter grade for every school across the state, and many school administrators, teachers, parents, and students were left with those same feelings of pride or frustration. For an example of both, look no further than this account from Durham. Eighty percent of the school performance score is based on school-wide achievement, which includes scores from several measures of student progress (like End-of-Grade, End-of-Course, and ACT test results) as well as graduation rates and measures of students’ readiness for work. The other 20 percent of the score is based on school-wide measures of growth, or the extent to which students in a school met or exceeded performance expectations for that year.
Since their release, the grades have generated controversy. Some believe that measuring school achievement using a universal grading system will help identify exemplary schools that can share their strategies for success, and also help identify struggling schools in need of more support. Others believe that the school grades do not accurately reflect the quality of the schools, that school growth should be worth more than 20 percent of the overall grade, and that achievement should be based on more than a few high-stakes measures. As the first installment of our new feature, Consider It Mapped, EdNC, in partnership with the Friday Institute, wanted to create a tool that would help facilitate this conversation.
With our interactive map, users can highlight schools in each school grade group. In this way, the map can be used as a tool for identifying schools with high marks to begin the process of determining successful strategies, as well as for identifying schools with lower marks to begin the process of strategizing ways to increase achievement in those schools. The map also allows users to envision alternative approaches to grading by changing the growth score weight. Some have argued for the school growth score to be weighted as much as 50 percent (higher than the current 20 percent). The options in the map’s sidebar further enable the user to zoom to specific counties or schools and even to choose between the current 15-point grade scale and the 10-point grade scale the state will use in a few years, letting the user view all of the data currently available in a variety of contexts.
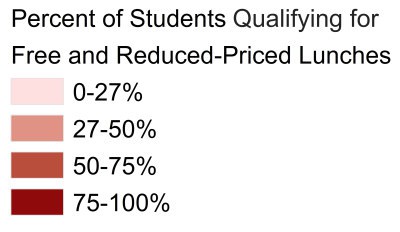
We hope that parents, school administrators, and policy makers will use this map to start a conversation about how or whether this current system of measuring school achievement should be changed. Other questions to consider could include: Are school scores related in any way to differences in the affluence of their communities, and, if so, should these differences be factored into the overall grades? Are there other ways to measure growth beyond using high-stakes testing progress from year to year? What other factors should be included in the overall school grades?
While schools that received high marks certainly have something to share and to be proud of, schools with low marks also should be offered the chance to share their accomplishments that are not reflected in their grades. We should all remember, too, that, just as we aren’t defined by an “F” we received on a physics test in high school, there is also so much more to our schools than their grades.
Highest concentration of school grades A-F compared to percent of students qualifying for free and reduced lunches
About the author