This is an excerpt from “E(race)ing Inequities: The State of Racial Equity in North Carolina Public Schools” by the Center for Racial Equity in Education (CREED). Go here to read the full report and to find all content related to the report, including the companion report Deep Rooted.
In 2016-2017, North Carolina students took end-of-grade (EOG) tests in English Language Arts and Mathematics in grades 3 through 8. Science EOGs were taken by students in grades 5 and 8. End-of-course (EOC) tests in Biology, English II, and Math I were administered in high school at the completion of the associated coursework. EOGs and EOCs are intended to measure students’ proficiency on the North Carolina Standard Course of Study (NCSCOS) for each subject or grade level. Assessment results are used for school, district, state, and federal accountability reporting. Student performance is reported as a scale score based on the number of correct items. Scale scores fall in the 400s for EOGs and the 200s for EOCs. Based on scale score, students are assigned one of five achievement levels: 1 = Limited Command, 2 = Partial Command, 3 = Sufficient Command, 4 = Solid Command, or 5 = Superior Command.
Methodology
For the purposes of this report, we position EOG and EOC assessment primarily as outcome indicators indicating point-in-time mastery of course content. While student performance is partially a reflection of access and opportunity to learn, students do not have differential access to the administration of assessments. North Carolina does administer alternative EOG and EOC assessments for students receiving special education services (NCEXTEND), but we do not examine them in this report.
In the sections that follow we analyze the EOG/EOC performance of all students who took the assessment in the 2016-2017 school year. We report differences in mean scale score and mean achievement level by race/ethnicity for all assessments. We also built prediction models that analyzed scale score and achievement level as a factor of race/ethnicity while controlling for the effect of other potentially relevant factors, including gender, free/reduced lunch status, language status, special education status, and giftedness.
Analysis
Mean Scale Score
Tables 14.1, 14.2, 14.3, and 14.4 present EOG/EOC mean scale scores by race/ethnicity.
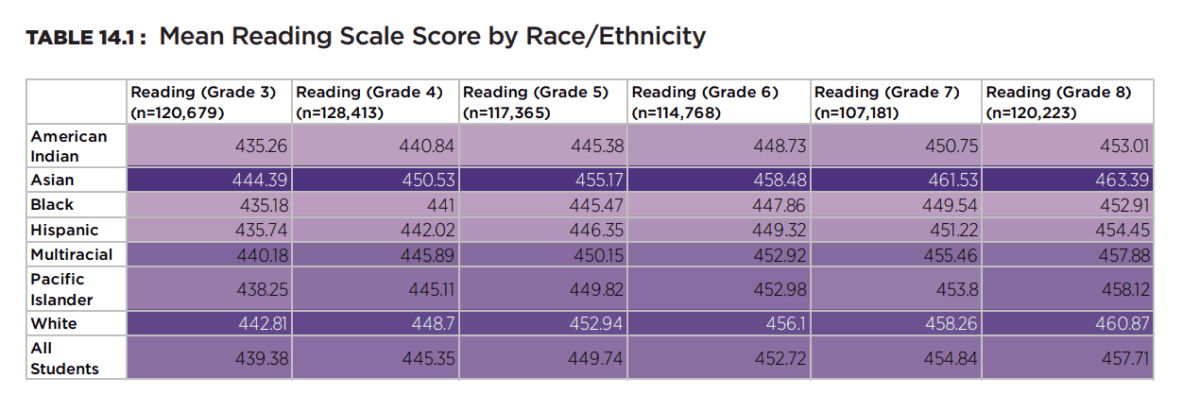
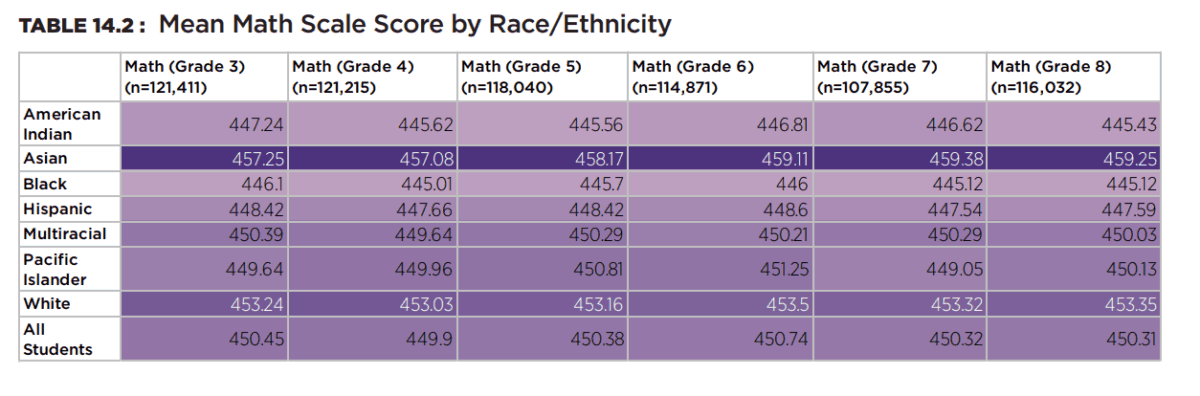
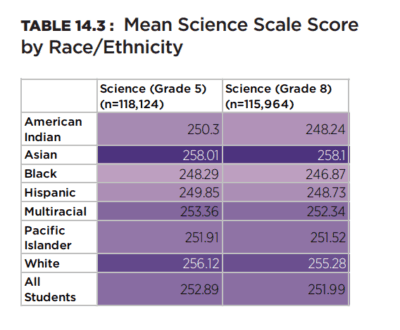
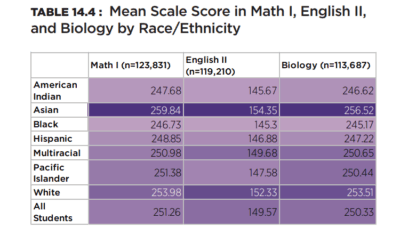
The pattern of racial/ethnic differences in EOG/EOC scores across all subjects and grade levels is remarkably consistent. Asian students have the highest mean scale scores on every assessment followed by White students, and both groups scored above the statewide average on all EOGs/EOCs. Multiracial and Pacific Islander students’ mean scores are close to one another and hover around the statewide average, but in all cases are higher than American Indian, Black, and Hispanic students’ mean scores. With very few exceptions, Hispanic students outperform American Indian students who outperform Black students. Mean scores for American Indian, Black, and Hispanic students fall below the statewide average on all assessments.
Mean Achievement Level
Tables 14.5, 14.6, 14.7, and 14.8 present EOG/EOC mean achievement level (1 – 5) by race/ethnicity. The state deems a score of 3 or higher to mean students are proficient in that subject.
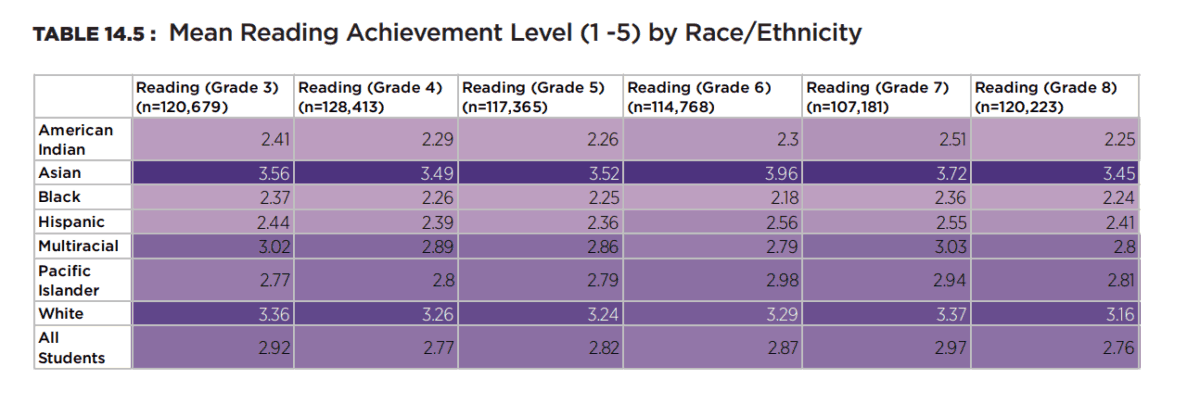
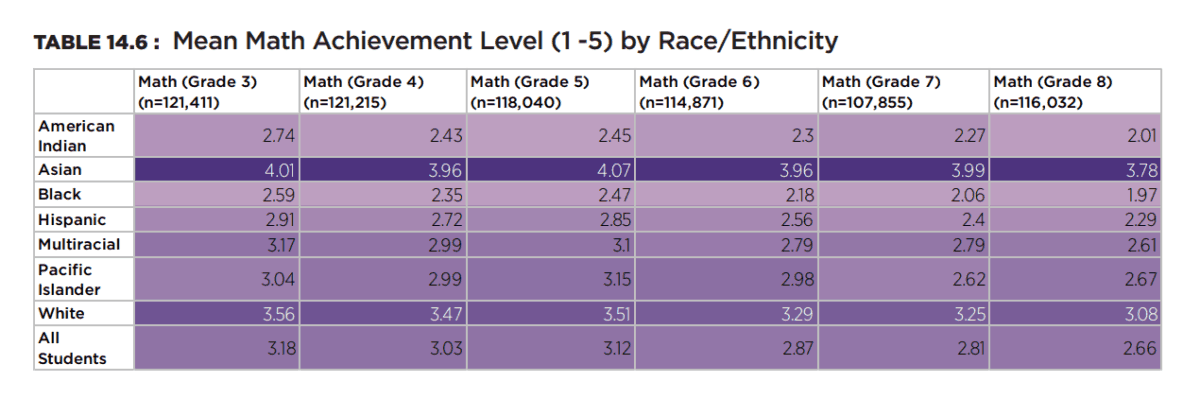
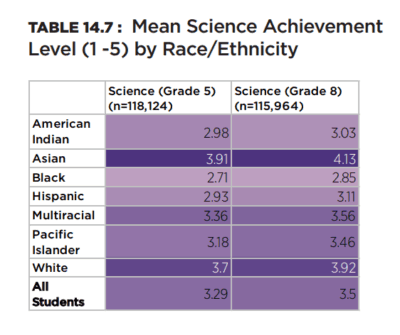
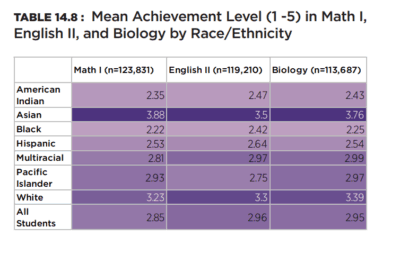
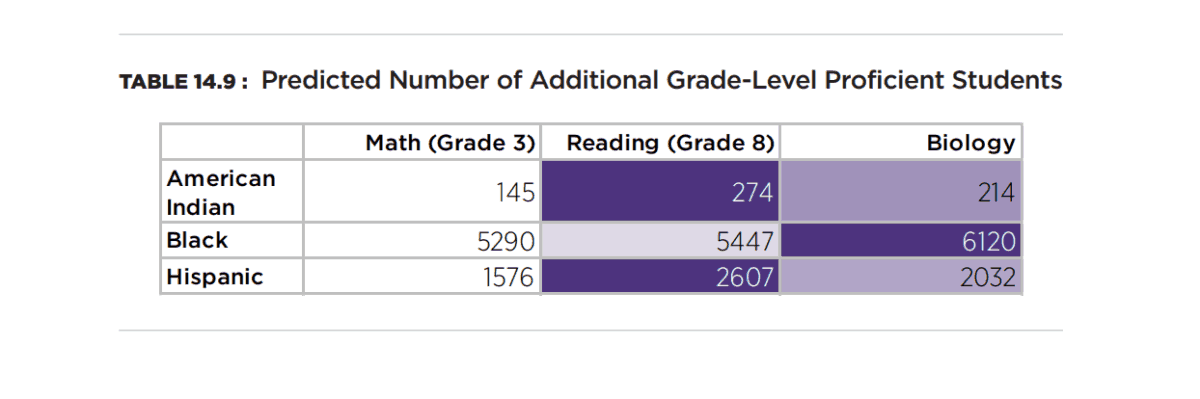
The same pattern observed in scale scores also applies to achievement level, with students’ racial/ethnic groups stratified into bands such that Asian and White students have the highest scores and score above the state average on all assessments. Multiracial and Pacific Islander students hover at the state average and without exception score higher than American Indian, Black, and Hispanic students. Black students have the lowest mean achievement level on all assessments. Table 14.9 shows the predicted number of additional American Indian, Black, and Hispanic students that would be grade-level proficient if those groups were to perform at the current statewide average in 3rd grade math, 8th grade reading, and biology.
Predicted Scale Score
Often in statistical analysis of large data sets, the degree of consistency observed for racial/ethnic patterns of mean scale score and achievement level indicates that another variable (or other set of variables) is influencing the relationship. To better test the effect of race/ethnicity on EOC/EOG outcomes, we built prediction models that isolated the effect of race/ethnicity to the greatest extent possible by controlling for gender, free/reduced lunch status, language status, special education status, and giftedness.
Tables 14.10, 14.11, 14.12, and 14.13 present the results of the prediction models. The figures listed represent the predicted net change in scale score for each student group of color as compared to White students while controlling for those factors.
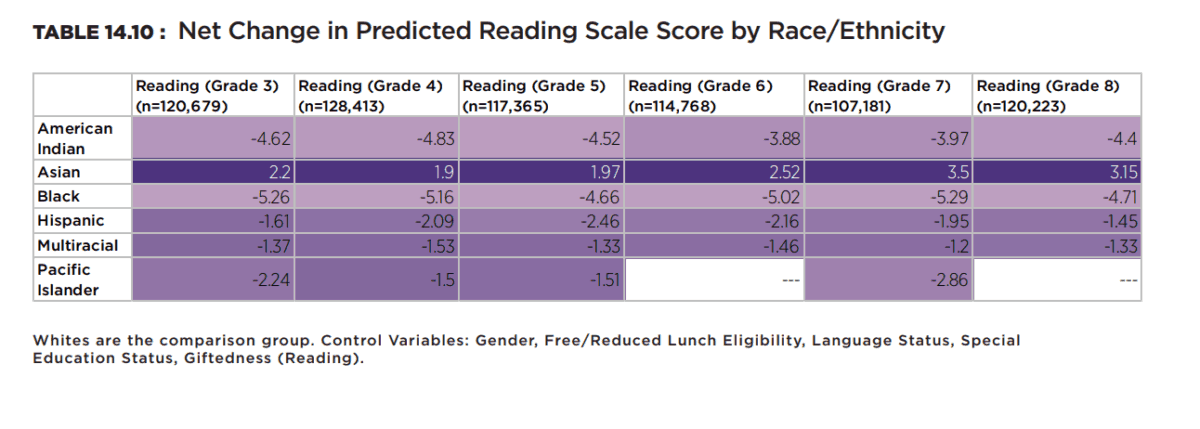
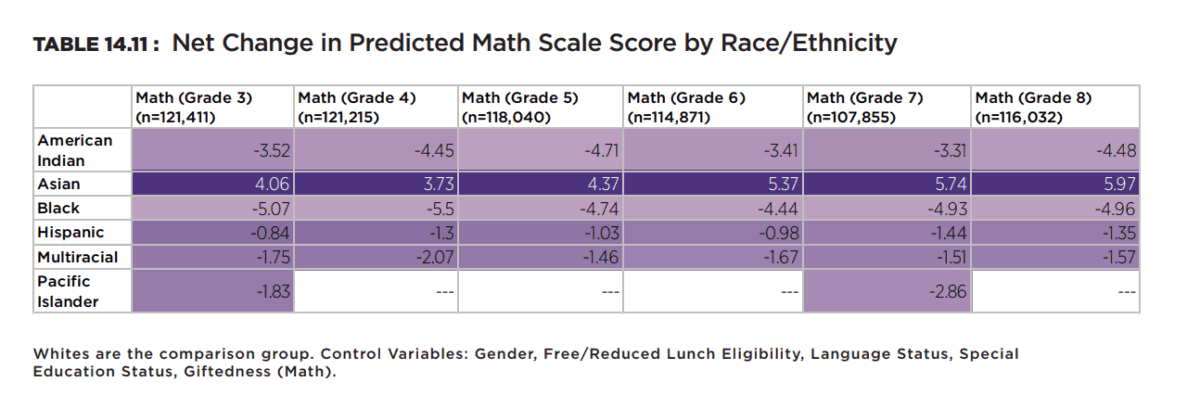
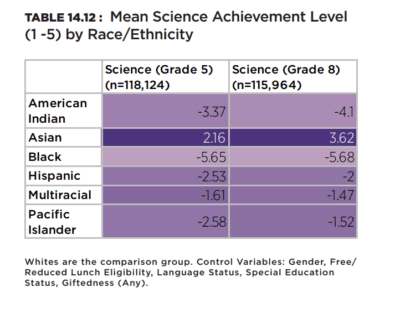
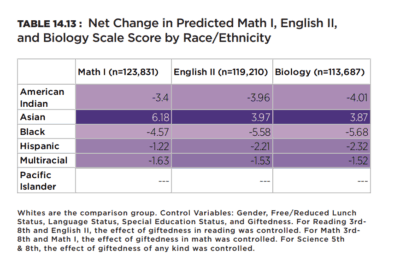
With few exceptions, the pattern of racial/ethnic differences in predicted EOG/EOC scale scores is similar to what we observed for mean scores. In comparison to White students and while controlling for other relevant factors, Asian students have the highest predicted scale score on every assessment. Hispanic students tend to compare more favorably than Multiracial student to Whites in math assessments across grade levels. The reverse is true for reading and science assessments. With controls applied, Pacific Islander students are similar to Whites across most assessments. American Indian and Black students again have the lowest predicted net scale scores on all assessments.
Predicted Achievement Level
The figures listed in the tables below represent the predicted net change in achievement level for each student group of color as compared to White students while controlling for other relevant factors.
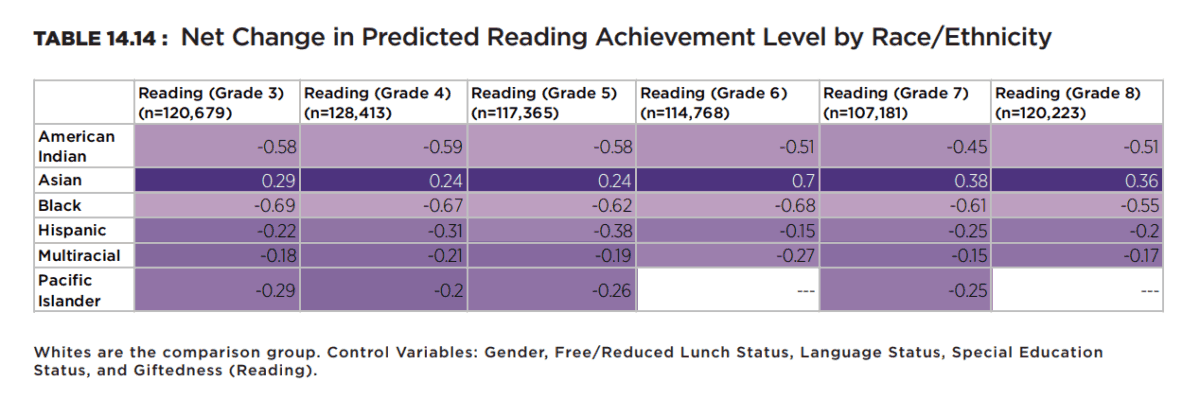
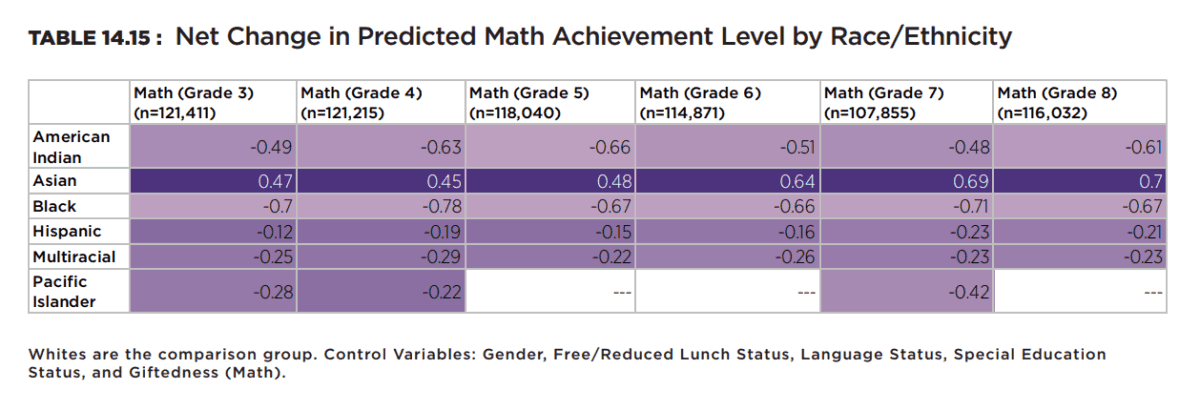
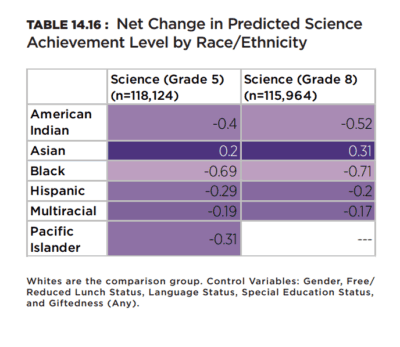
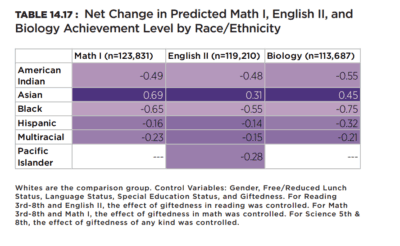
Results for predicted achievement level follow a now well-established pattern. Asians outperform all students. Whites outperform all non-Asian student groups of color. Hispanic, Multiracial, and Pacific Islander students perform below Whites and Asians, but vary by subject area when compared to each other. American Indian and Black students were predicted to consistently perform below all other groups, and predicted achievement levels for Black students were the lowest on every assessment.
Takeaways
North Carolina public school students are clearly and consistently stratified by EOG/EOC performance across all subjects and grade levels. Asians perform far above other groups on every measure, followed by White students. American Indian and Black students have the lowest performance across all measures. Hispanic, Multiracial, and Pacific Islander students fall between those extremes. While other factors like free/reduced lunch status, special education status, language status, giftedness, and gender (for some subjects) account for some of the observed variance in aggregate EOG/EOC performance, race/ethnicity remains a statistically significant and powerful predictor of both mean scale score and mean achievement level after controlling for those other factors.
To give just a few examples from our results, after controlling for other factors in the models, being Black (as compared to White) is a stronger predictor of achievement level than free/reduced lunch status in nine of the 15 assessments. This pattern is strongest in elementary math and middle school science results. In 5th and 8th grade science, a Black racial designation (as compared to White) better predicts achievement level than does students’ academically/intellectually gifted status. The American Indian racial designation (as compared to White) approaches but does not exceed the influence of free/reduced lunch status on several assessments as well.
When we look at the magnitude and direction of racial/ethnic differences across all subjects and grade levels, the consistency of observed patterns is truly remarkable. Not only does EOG/EOC performance produce clear stratifications between racial/ethnic groups, but the size of differences between groups across all measures is surprisingly consistent as well. This level of uniformity is rare in statistical modelling that includes numerous predictor variables like the kind employed in this report.
Given the strength of race/ethnicity as a factor in EOG/EOC performance, along with the consistency of the effect in terms of direction and magnitude, it is difficult not to conclude that powerful, institutional factors are at play in the observed results. If we were to accept that some racial/ethnic groups begin school “behind,” which we do not, the strong effect of race/ethnicity on elementary math for instance might be partially understood. However, such explanations become untenable when observed patterns persist through middle and high school. Recall that being Black is a stronger predictor of achievement level in 8th grade science than being academically gifted. Overall, explanations related to the systemic inequities in access and opportunity found across numerous indicators elsewhere in this report appear to be much more plausible in explaining highly stratified racial/ethnic results in EOG/EOC scores and achievement levels.
Editor’s note: James Ford is on contract with the N.C. Center for Public Policy Research from 2017-2020 while he leads this statewide study of equity in our schools. Center staff is supporting Ford’s leadership of the study, conducted an independent verification of the data, and edited the reports.


Recommended reading