This is an excerpt from “E(race)ing Inequities: The State of Racial Equity in North Carolina Public Schools” by the Center for Racial Equity in Education (CREED). Go here to read the full report and to find all content related to the report, including the companion report Deep Rooted.
Leaving school before graduation has dramatic effects on the future employment, earnings, health, and overall well-being. According to the U.S. Department of Labor (2018), high school dropouts are over three times more likely to be unemployed than college graduates. Even when employed, high school dropouts earn about $10,500 a year less than high school graduates and approximately $35,000 a year less than college graduates (U.S. Department of Labor, 2017). Decades of research have also linked lower educational attainment to negative physical, mental, and cognitive health outcomes (Hahn & Truman, 2015). Scholarship has also examined the relationship between race/ethnicity, dropout, and educational attainment (Balfanz, Bridgeland, Fox, DePaoli, Ingram, & Maushard, 2014; Hahn, Truman, & Williams, 2018) leading researchers to call for reforms intended to close “gaps” in educational attainment between students of color and their White and Asian counterparts (Hahn & Truman, 2015).
Students can legally drop out from almost all North Carolina schools when they reach the age of 16. They are not required to obtain parent permission or meet any other requirements for leaving school (N.C. Gen. Stat. § 115C-378). In 2015, the State Board of Education gave Hickory Public Schools and Newton-Conover Schools permission to raise the minimum school dropout age from 16 to 18 as part of a study intended to determine if increasing the dropout age would help keep kids in school (SB 402, sec. 8.49). State reports have correlated the pilot program with small decreases in dropout rates but have also reported difficulty enforcing the raised dropout age. Twenty-five states and the District of Columbia do not allow students to drop out before turning 18, and 11 states have set the permissible dropout age at 17.
North Carolina General Statute 115C-12(27) requires an annual report on dropout data in the state. Each LEA and charter school reports an “event dropout rate,” which is the number of students in a particular grade range dropping out in one year divided by total students in that same grade range. LEAs and charter schools are also responsible for compiling a list of dropouts for each school and transmitting dropout files to North Carolina Department of Public Instruction (NCDPI) on a designated date each year.
NCDPI defines a dropout as an individual who:
- was enrolled in school at some time during the reporting year;
- was not enrolled on day 20 of the current year;
- has not graduated from high school or completed a state or district approved educational program; and does not meet any of the following reporting exclusions:
- transferred to another public school district, private school, home school or state/district approved educational program (not including programs at community colleges),
- temporarily absent due to suspension or school approved illness, or
- death.
Between 2007-2008 and 2015-2016, the published statewide dropout rate has seen year-over-year decreases from approximately 5% to 2.3%.
Methodology
Over 12,000 students were identified as dropouts in North Carolina in 2016-2017. The data from North Carolina included dropouts from grades as early as first grade. In order to ensure that we captured dropout rates consistent with the traditional perception of dropouts, we only considered students in grades 9-131, which corresponds to the grades when most students reach the legal dropout age. We examined data on approximately 475,000 students attending roughly 550 schools in grades 9-13 to identify dropout patterns. There were approximately 10,700 dropouts that met this criterion in the 2016-2017 data.
Analysis
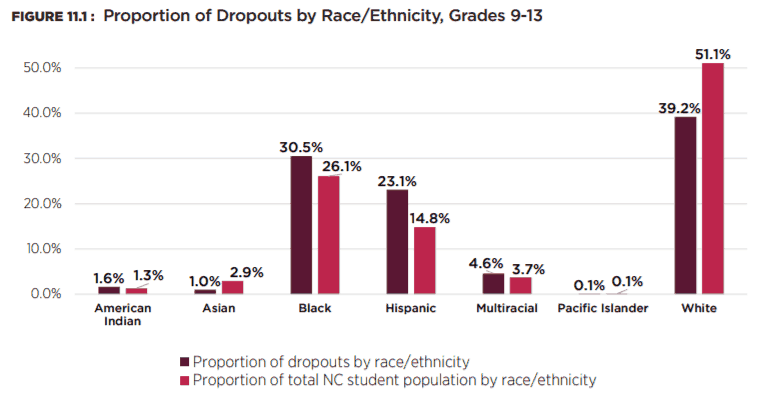
Asians and Whites are under-represented among dropouts in comparison to what would be expected if racial groups’ proportion of dropouts was similar to their proportion of the population. Pacific Islanders are proportionately represented. Black, Hispanic, American Indian, and Multiracial students are over-represented. Hispanic students have the highest dropout rates (3.5%), followed by Multiracial (2.8%), American Indian (2.8%), Black (2.6%), Pacific Islanders (2.1%), White (1.7%), and Asian (0.7%) students.
Predicting Dropout
We also built statistical models to predict the likelihood of a student dropping out based on race/ethnicity after controlling for gender, socioeconomic status, language status, special education status, giftedness, and suspension with Whites as the comparison group. Model 1 included only race/ethnicity. Model 2 included gender, language status, special education status, giftedness, and eligibility for free/reduced lunch. In the final model, Model 3, we entered a dichotomous variable indicating if a student had been suspended at least once during the year of dropout. Figure 11.2 presents the results of the prediction models.
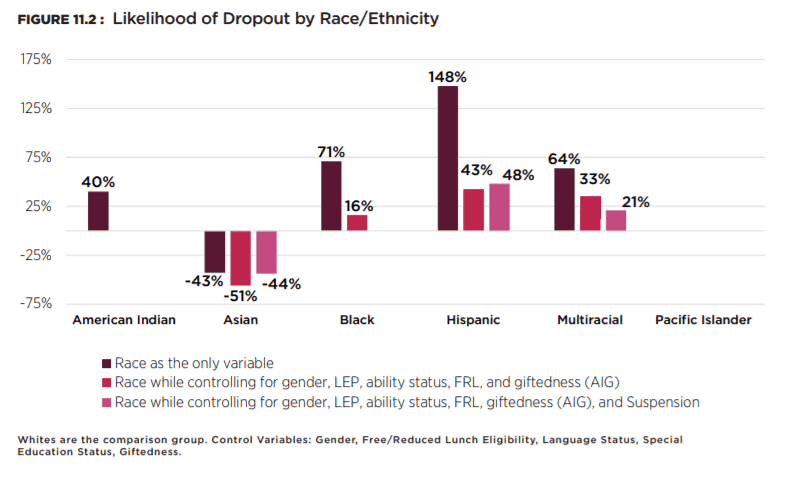
In Model 1 (race/ethnicity only), Asians were 43% less likely to drop out and Pacific Islanders were similarly likely to drop out compared to their White student peers. American Indian (40%), Black (71%), Hispanic (148%), and Multiracial students (64%) were all more likely to drop out than their White student peers.
In Model 2, which controlled for gender, Limited English Proficiency, special education status, giftedness, and eligibility for free/reduced lunch, the model predictions remained largely unchanged for Asians and Pacific Islanders as compared to Whites. American Indian students were no longer significantly different from Whites. The likelihood of dropout for Black (16%), Hispanic (43%), and Multiracial (33%) students remained higher than those of Whites, although the magnitude dropped substantially.
In the final model that included a control for if a student had been suspended at least once during the year, Asians remained less likely than Whites to drop out and American Indian and Pacific Islander students remained similarly likely to drop out compared to Whites. With the inclusion of suspension, Black students were no longer significantly different from Whites. Net of all other factors, Hispanic students were predicted to be 48% more likely and Multiracial students were predicted to be 21% more likely than Whites to drop out.
Overall, results of the prediction model showed Pacific Islander students had similar odds of dropping out, and Asian students were approximately half as likely as White students to drop out after controlling for all other factors. While American Indian and Black students had higher overall dropout rates than White students, when we controlled for other factors, race/ethnicity no longer appeared to be a powerful predictor of dropout for those groups. Multiracial and Hispanic students remained significantly more likely to dropout than Whites net of other predictors.
The dramatic drop in the likelihood of dropout for Hispanic students between Models 1 and 2 is likely due to the over-representation of Hispanics among Limited English Proficient students. The strength of suspension as a predictor of dropout is also worth noting. After controlling for other factors, including race/ethnicity, students that were suspended at least once during the year they dropped out were 230% more likely to drop out than those were not suspended. By adding suspension to the prediction model and controlling for its influence, Black students were no more likely than Whites to drop out of high school.
Reasons for Dropout
We also wanted to analyze the reasons students drop out. The state reports data on 21 reasons for dropout. A reason of “unknown” was provided for approximately 1300 students. Given its inherent ambiguity, we do not include these students in our analysis of the reported reasons for dropout. Approximately 1200 students reported dropping out to attend community college or community college high school. While the state considers these students dropouts, we do not interpret leaving high school for community college as representing the same degree of detriment as other reasons, such as discipline problems, academic problems, or social-emotional problems. These students are also excluded from our analysis of the reported reasons for dropout. We do not include students who moved for similar reasons.
Table 1 in Appendix A shows the percentage of all dropouts by reason. Attendance is far and away the most cited reason for dropout, accounting for 43% of instances. Unknown reasons are the next highest (12.2%), followed by community college (11.7%), lack of engagement with school/peers (6.4%), choice of work over school (6.0%), and moving (4.4%).
We also wanted to know whether students from different racial groups provided different reasons for dropping out. To do so, we made pairwise comparisons between all racial groups based on the reasons for dropout. We do not interpret racial differences within the reason unknown based on its inherent ambiguity or decision to pursue community college and moving, as we do not interpret these as representing the same degree of future detriment as other reasons, such as discipline problems, academic problems, or psychological/emotional problems. To remain consistent with other analyses in this report, we focus on differences between student groups of color and their White counterparts (Whites are the comparison group).
Table 11.1 shows the reasons student groups of color cited for dropout at significantly higher rates than Whites, and the reasons Whites cited at significantly higher rates than other racial/ethnic groups (also see Appendix A, Table 2).
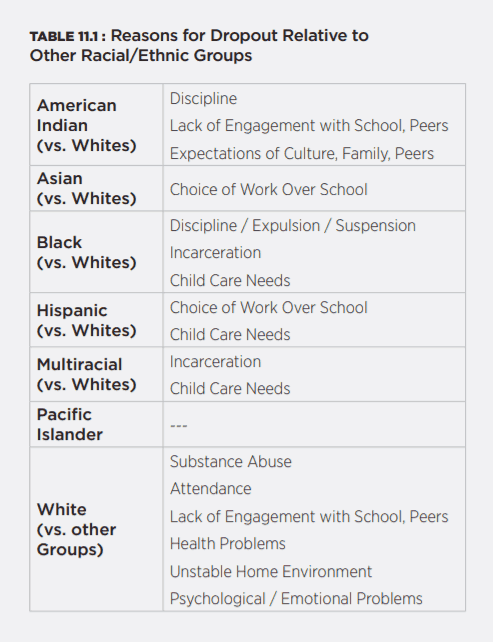
As compared to Whites, school discipline and the criminal justice system (incarceration) factor prominently in the reasons for American Indian, Black, and Multiracial students dropping out. The choice of work over schools appears to precipitate dropout among Asian and Hispanic students as compared to Whites. The need for childcare is a factor for Black, Hispanic, and Multiracial students versus their White counterparts. American Indians report a lack of engagement with peers and the expectations of culture, family, peers more often than Whites.
In general, White students tended to differ significantly from only Black and Hispanic students in their reported reasons for dropout. As compared to Blacks and Hispanics, White students were more likely to cite attendance, substance abuse, health problems, lack of engagement with school/peers, unstable home environments, and psychological/emotional problems as reasons for dropout.
Takeaways
Overall, statewide dropout rates follow a familiar pattern, with Asian and White students below the state average and American Indian, Black, Hispanic, Multiracial, and Pacific Islanders above the state average. Unlike many other metrics in this report, race/ethnicity does not appear to retain a substantial effect on dropout rates in our prediction models after controlling for other variables for Black and American Indian students. Yet, dropout data demonstrates how race/ethnicity can still condition educational outcomes indirectly through differential representation of racial groups within other metrics (such as free/reduced lunch eligibility and suspension). While Black and White students have a similar likelihood of dropping out when we control for free/reduced lunch eligibility and suspension, Black students nonetheless have an overall statewide dropout rate that is 48% higher than Whites (2.9% vs. 1.8%). Much of that difference can be attributed to the over-representation of Black students within lower socioeconomic strata and the over-selection of Black students for suspension. Thus, additional academic attainment supports for poor(er) students and closing the racial/ethnic discipline gap could also be expected to close the graduation gap between American Indian students, Black students, and their White counterparts.
The persistently higher likelihood of Hispanic and Multiracial students dropping out as compared to White students is concerning and warrants further investigation. While the gap has narrowed substantially over the last two decades, Hispanics have historically had higher dropout rates than other groups (Grimlich, 2017). Furthermore, the dramatic drop in the likelihood of Hispanics dropping out compared to Whites after controlling for language status indicates that Hispanic students designated as Limited English Proficient may not be receiving adequate support and intervention to avoid dropout.
Despite being the fourth largest racial group in North Carolina and the nation, Multiracial students have been the subject of very little empirical research related to dropout or other metrics of concern, such as school discipline (but see Triplett, 2018). As such, this report provides some of the first evidence that dropout may be a key lever in the educational attainment of Multiracial students.
Finally, our analysis raises issues related to the relationship of racial groups to the reasons for dropout. With regard to school discipline, results suggest that, as compared to White students, the over-selection for suspension documented elsewhere in this report is an important barrier to graduation for American Indian and Black students. Further, the relationship between school discipline, interaction with law enforcement, and the juvenile/adult justice system, commonly referred to as the school-to-prison pipeline, may also be affecting graduation rates for Black and Multiracial students versus their White counterparts.
The data also suggest that at least a subpopulation of Asian and Hispanic students feel compelled to enter the workforce before they have the opportunity to finish high school or matriculate to college. Given the strength of Limited English Proficiency as a predictor of dropout, language status, as well as nativity and immigration status, may be a key lever of high school completion for Asian and Hispanic youth as compared to their White counterparts. Further, the results suggest that limited access to childcare may be constraining high school completion for Black, Hispanic, and Multiracial students versus Whites. While it is unclear why American Indian students cite lack of engagement with peers and expectations of culture, family, and peers more often than White students, it is worthy of future research.
With regard to White students, the data align with our analysis of chronic absenteeism in suggesting that attendance is a significant problem for White students across a number of educational outcomes. Furthermore, White students appear to be over-exposed to physical, psychological, and emotional problems as well as unstable home environments as compared to student groups of color. This result raises questions about whether the processes for identifying and addressing the physical, psychological, and emotional problems of White students are in place in North Carolina public schools.
References
Balfanz, R., Bridgeland, J. M., Fox, J. H., DePaoli, J. L., Ingram, E. S., & Maushard, M. (2014). Building a Grad Nation: Progress and Challenge in Ending the High School Dropout Epidemic. Annual Update 2014. Washington, DC: Civic Enterprises.
Grimlich, J. (2017, September). Hispanic dropout rate hits new low, college enrollment at new high. Washington, DC: Pew Research Center.
Hahn, R. A., & Truman, B. I. (2015). Education improves public health and promotes health equity. International Journal of Health Services, 45(4), 657-678.
Hahn, R. A., Truman, B. I., & Williams, D. R. (2018). Civil rights as determinants of public health and racial and ethnic health equity: Health care, education, employment, and housing in the United States. SSM-population health, 4, 17-24.
U.S. Department of Labor. Bureau of Labor Statistics. (2017). Selected percentiles of usual weekly earnings of full-time wage and salary workers age 25 and older by educational attainment, 2nd quarter 2017 averages, not seasonally adjusted. Retrieved 12 Feb. 2019, from: https://www.bls.gov/opub/ted/2017/high-school-graduates-who-work-full-time-had-median-weekly-earnings-of-718-in-second-quarter.htm
U.S. Department of Labor. Bureau of Labor Statistics. (2018). Table A-4. Employment status of the civilian population 25 years and over by educational attainment. Retrieved 12 Feb. 2019, from: https://www.bls.gov/news.release/empsit.t04.htm
Editor’s note: James Ford is on contract with the N.C. Center for Public Policy Research from 2017-2020 while he leads this statewide study of equity in our schools. Center staff is supporting Ford’s leadership of the study, conducted an independent verification of the data, and edited the reports.


Recommended reading