This is an excerpt from “E(race)ing Inequities: The State of Racial Equity in North Carolina Public Schools” by the Center for Racial Equity in Education (CREED). Go here to read the full report and to find all content related to the report, including the companion report Deep Rooted.
The ACT is a college admissions test that measures student learning in high school and readiness for college coursework. The ACT is administered in a multiple-choice format and covers four subjects: English, math, reading, and science. There is an optional writing section that asks students to respond to an open-ended question in short essay format. Scores range from 1-36 in each subject area. An average of the four subject scores is reported as a composite score for each student.
In North Carolina, the ACT is given to all students in the 11th grade, and the ACT WorkKeys assessment is administered to students who are in Career and Technical Education (CTE) tracks. The WorkKeys assessment is analyzed elsewhere in this report. North Carolina tracks the percentage of students meeting the UNC system admissions minimum ACT composite score of 17.
Methodology
In this report, we position the ACT as an indicator of secondary educational attainment and student readiness for postsecondary coursework. We provide descriptive data on the students that took the ACT and ACT composite scores as a factor of race/ethnicity. We also assess whether race/ethnicity is a significant predictor of ACT composite scores, the magnitude of predicted differences for student groups of color as opposed to White students, and whether any detected effect of race/ethnicity remains significant after controlling for gender, socioeconomic status, language status, special education status, and previous achievement.
We analyzed data from approximately 81,000 students that took the ACT during the 2014-2015 school year.1
Analysis
Figure 8.1 shows the mean ACT composite scale score by racial group.
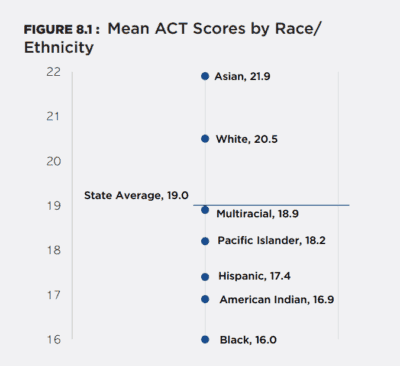
Asian (21.9) and White students (20.5) had the highest mean ACT score, both achieving above the state average (19.0) and the UNC system minimum (17.0). Average scores for American Indian (16.9), Black (16.0), Hispanic (17.4), Multiracial (18.9) and Pacific Islander (18.2) students were all below the state average, with average scores for American Indian and Black students falling below the UNC system minimum.
We also built statistical models to predict the influence of race/ethnicity on composite scale scores while controlling for other potentially relevant factors.2 In Model 1, scores were predicted based on race/ethnicity alone. Model 2 controls for gender, socioeconomic status, language status, special education status, and previous achievement. White students were the comparison group for all other racial/ethnic groups.
Figure 8.2 shows the results of the prediction models. The effect of race/ethnicity (as compared to Whites) was statistically significant (p < .001) for all racial/ethnic groups in both models. The numbers in the table indicate the predicted point differences in ACT composite scores as compared to White students.
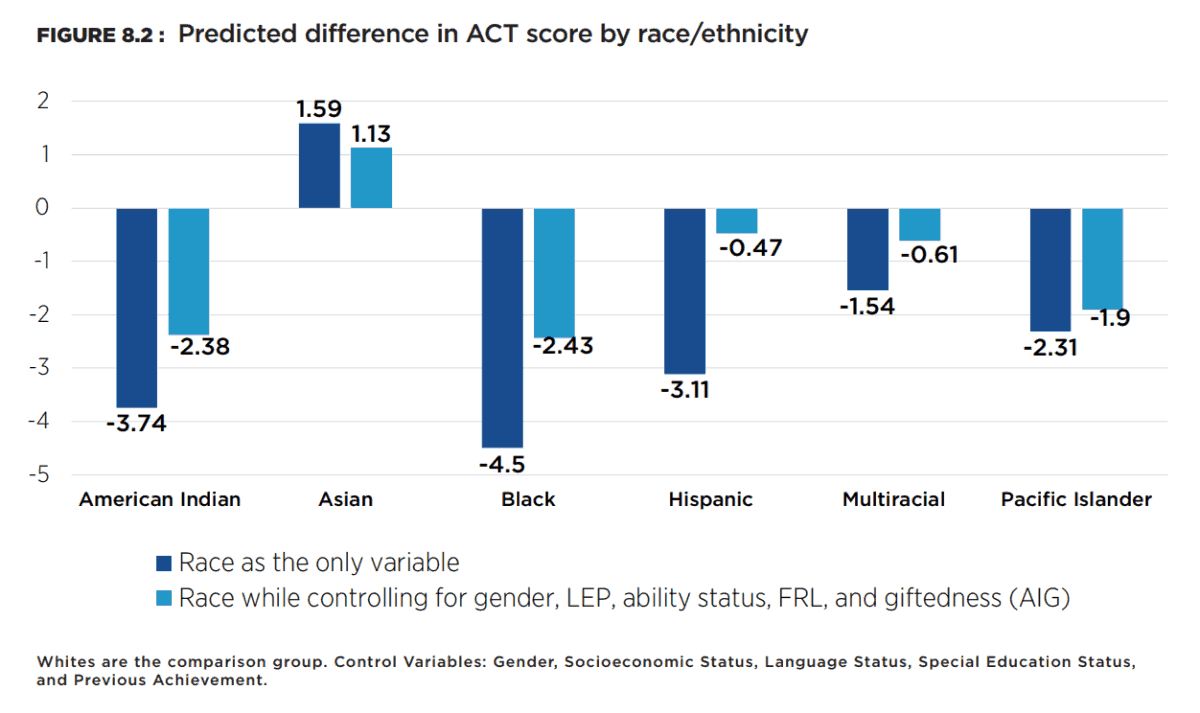
Net of other factors in the model, Asian students were predicted to score 1.13 points higher than their White counterparts. All other student groups of color were predicted to have lower ACT scores compared to Whites. The magnitude of racial disparity was highest for Black students, who were predicted to score 2.43 points lower than Whites, followed by American Indians (2.38 points lower), Pacific Islanders (1.90 points lower), Multiracial students (0.61 points lower), and Hispanics (0.47 points lower). Of all the predictors in the model (race/ethnicity, gender, socioeconomic status, language status, special education status, and previous achievement), only previous achievement, as measured by overall GPA in 11th grade, was a stronger predictor of ACT score than race/ethnicity after controlling for other factors.
Takeaways
There are clear differences in ACT performance as a factor of race/ethnicity. On average, Asian and White students scored above the state average, and all other student groups of color scored below the state average. Results are particularly concerning for American Indian and Black students, who on average scored below the UNC System minimum score of 17. Furthermore, race/ethnicity has a significant and substantial effect on ACT composite scale scores for all student groups of color after controlling for other potentially confounding factors.
To the extent that ACT scores reflect college readiness and given the widespread use of ACT as a factor in college admissions, our results suggest that non-Asian student groups of color may be differentially exposed to educational conditions and contexts that may limit their ability to attain a postsecondary degree. This, in turn, reflects on the relationship of student race/ethnicity and the state’s explicit goals around college and career readiness.
Editor’s note: James Ford is on contract with the N.C. Center for Public Policy Research from 2017-2020 while he leads this statewide study of equity in our schools. Center staff is supporting Ford’s leadership of the study, conducted an independent verification of the data, and edited the reports.


Recommended reading