This is an excerpt from “E(race)ing Inequities: The State of Racial Equity in North Carolina Public Schools” by the Center for Racial Equity in Education (CREED). Go here to read the full report and to find all content related to the report, including the companion report Deep Rooted.![]()
Advanced Placement (AP) courses were originally developed in the 1950s to ensure that American high schools were adequately preparing students for college and postgraduate study. AP courses offer advanced coursework and often culminate in an AP exam. Students typically must pay between $60 and $100 to take AP exams depending on whether they qualify for financial aid. Students can earn a score between 1 and 5 on AP exams. A score of 3 or higher is required for students to receive college credit at most postsecondary institutions nationwide, and as of July 2018, the Board of Governors of the UNC System standardized a score of three or higher for college credit across the system’s 16 universities.
A number of previous studies have found that race/ethnicity influences both the availability of advanced courses and the likelihood that students will take advanced courses (Theokas & Saaris, 2013; U.S. Department of Education Office for Civil Rights, 2014). Fewer AP courses are available to non-Asian students of color in aggregate, and even when courses are available, non-Asian students of color are less likely to take them (Quinton, 2014). Furthermore, research suggests that many students of color would have found success in AP coursework based on subsequent standardized test data (Barnard-Brak, McGaha-Garnett, & Burley, 2011). Thus, equitable access to AP course offerings is an important issue and is impacted by the informal pathways to AP related to identification criteria, teacher expectations, and counselling behavior (Theokas & Saaris, 2013).
AP course taking often affects GPA, class rank calculations, and access to specialized high school diploma credentials. While the actual rigor and college preparatory aspects of AP are contested, participation in AP courses is increasingly emphasized as an admissions criterion at postsecondary institutions (Klopfenstein & Thomas, 2009; Theokas & Saaris, 2013). Even though studies have found that AP provides no benefit beyond that provided by a non-AP curriculum strong in math and science, colleges and universities consistently cite rigorous high school coursework like AP as one of the most important criteria for college admissions (Clinedinst & Patel, 2019).
The number of schools and students participating in AP exams has risen steadily since their inception. Nationwide in 2017, approximately 2.7 million students took 5 million AP exams across 37 courses. While the NC State Board of Education “strongly endorses that all students enrolled in Advanced Placement courses take the corresponding Advanced Placement exams,” (NC State Board of Education, Advanced Placement Course and AP Exam Endorsement, TEST-008) not all students that take AP courses end up taking AP exams.
The North Carolina Department of Public Instruction positions AP courses, along with International Baccalaureate (IB) programs and other advanced coursework, as part of their effort to ensure access to and success in rigorous coursework. According to North Carolina State Board of Education Policy (SCOS-16; NC GS 115C-81), “(a)ll North Carolina public school students shall pursue a rigorous and relevant academic course of study as defined in the North Carolina Standard Course of Study,” and “the North Carolina State Board of Education will (e)nsure that all students have access to and the support necessary to take Advanced Placement (AP) courses or be enrolled in an International Baccalaureate (IB) Program” (NC State Board of Education Policy, SCOS-16; NC GS 115C-81).
As of the freshman class of 2015-2016, student grades in AP courses receive one additional quality point [NC State Board of Education Policy GRAD-009, High Schools Transcript Standards; NC GS 116-11(10a)]. This represents a change from prior classes that received two additional quality points for AP courses. Under the old system, an A in an AP course garnered six quality points while an A in a regular course only awarded the student four quality points. In other words, the additional quality points for AP courses meant that a C in an AP course was the equivalent of an A in a regular course. Under the new rules, students only receive five quality points for an A in AP courses.1
Additionally, students enrolled in North Carolina high schools have the opportunity to earn Endorsements to their high school diploma that identify a particular area of advanced or focused study. At least three AP courses are required for the North Carolina Academic Scholars Endorsement [NC State Board of Education Policy GRAD-007, High Diploma Endorsements; NC GS 115C-81(b)].
Methodology
In this report, we position AP as an indicator of both achievement outcomes and access to rigorous coursework. We provide data on which students take AP courses, the results of students’ AP exams, and the number of AP courses offered by secondary schools in North Carolina as a factor of racial composition.
In North Carolina, approximately 73,000 students took over 210,000 AP courses in 2016-2017, with about 54% attaining the necessary score to receive college credit (3 out of 5). There were substantial differences between racial groups in AP participation and results.
Analysis
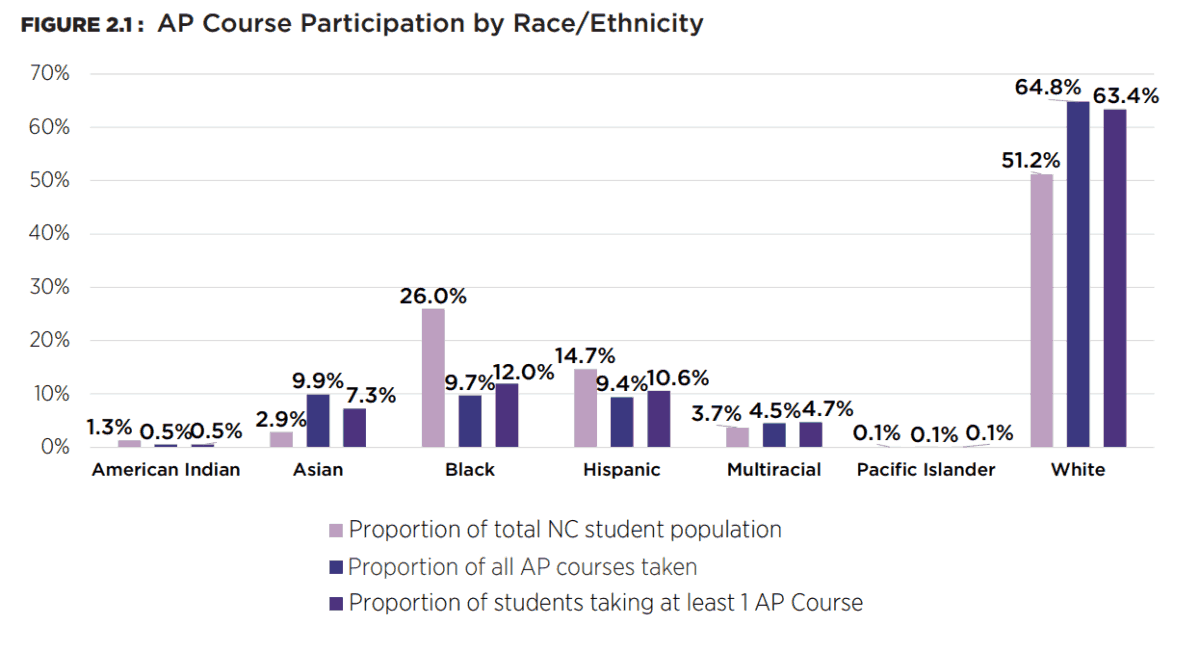
Examining all AP courses taken in 2016-2017, the proportion of Asian and White students taking AP courses substantially exceeded the proportions of all high school students in the state that are Asian and White, respectively. Pacific Islanders and Multiracial students were proportionally represented, and Black, Hispanic, and American Indian students were substantially under-represented in AP course taking. The same pattern emerges when looking at students who took at least one AP course, with White and Asian students over-represented and American Indian, Black, and Hispanic students under-represented.
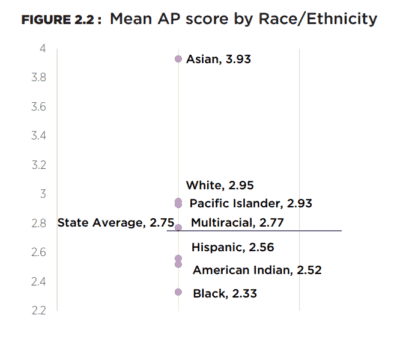
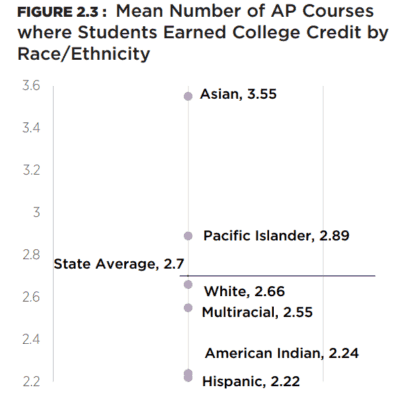
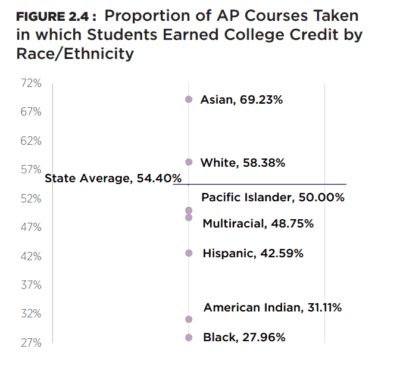
Asians attained dramatically higher mean AP exam scores, while Black students attained the lowest scores. Furthermore, Asian and White students earned scores (3, 4, or 5) that conferred college credit at approximately twice the rate as Black and American Indian students.
Statewide, North Carolina schools offered 38 AP courses. We analyzed the three most taken AP courses (English Language, United States History, and Environmental Science) to predict the net effect of race/ethnicity on whether students scored three or better on the course exams while controlling for other potentially relevant factors, including gender, special education status, Limited English proficiency, free/reduced lunch eligibility, and giftedness (AIG). As has been the case throughout this report, White students served as the comparison group.
Over 20,000 students took the AP exam for each of the courses analyzed. In all three courses, race/ethnicity remained a significant predictor of scoring three or better after controlling for the effect of all other variables. Figure 2.5 shows the predicted net effect of race/ethnicity as compared to Whites across the three AP exams.
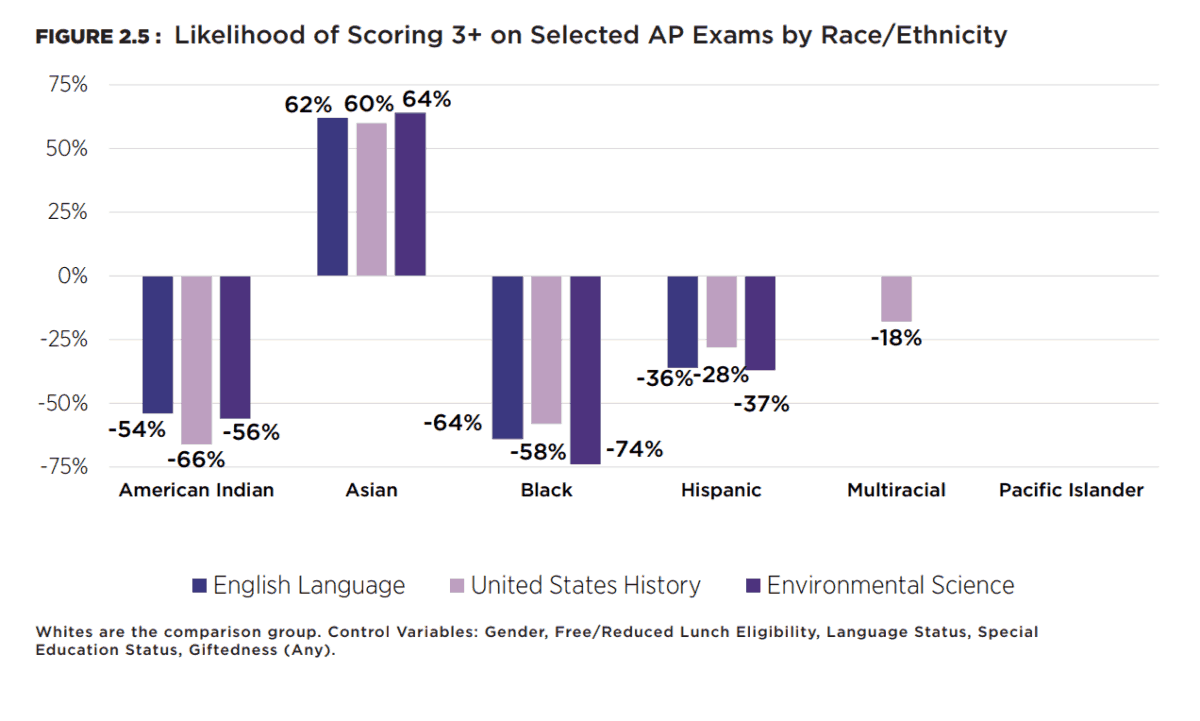
Asian students were predicted to be over 60% more likely than Whites to earn three or better across all three AP exams. American Indian and Black students were roughly 60% less likely to earn three or better compared to their White counterparts across the three exams. Hispanics were around 30% less likely as compared to Whites. Multiracial students were 18% less likely to earn a three or better in U.S. History but had a similar likelihood in English Language and Environmental Science. Pacific Islanders and Whites had similar likelihoods across all three exams.
Our analysis of English Language, United States History, and Environmental Science AP exams revealed a dramatic disparity in AP exam-taking as a factor of language status. Only a miniscule number of Limited English Proficient (LEP) students took the AP exam for English Language, United States History, and Environmental Science. Specifically, only 12 LEP students out of almost 29,000 took the U.S. History exam, only four LEP students out of over 26,000 took the English Language exam, and only 11 LEP students out of almost 21,000 took the Environmental Science exam. While some differences based on language status might be expected given the language demands of AP exams, disparities of this magnitude call attention to the ways that language can present a barrier to AP exam-taking for non-native English speakers. Furthermore, given that Asian, Hispanic, and Pacific Islander students are over-represented among LEP populations, language-related barriers to AP exam participation may reduce their access to rigorous coursework and college credit.
At the school level, 433 schools offered at least one AP course in North Carolina during 2016-2017. The number of courses offered by schools ranged between 1 and 36. The mean number of AP courses offered across all schools was 11.5.
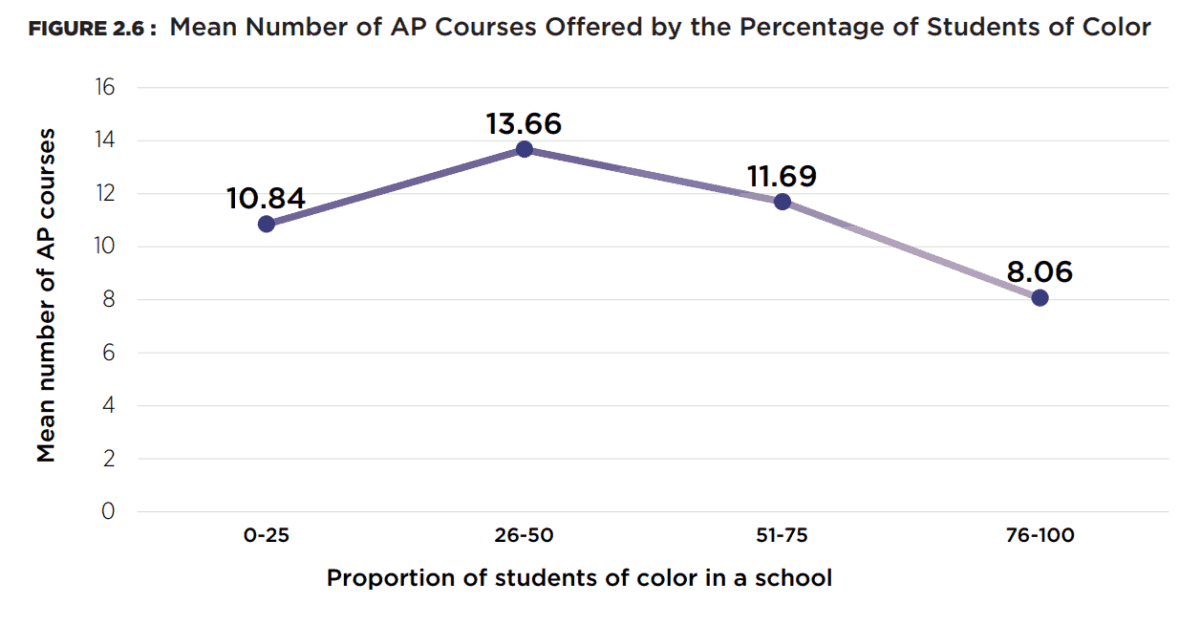
The number of AP courses offered varied by the racial composition of the school. Schools were divided into four groups (quartiles) based on the proportion of students of color (SOCs), and a mean number of AP courses offered was calculated for each group. Figure 2.6 shows the results.
Schools with the most SOCs (76-100%) averaged the fewest AP courses (~8), while schools with more balanced racial/ethnic composition offered significantly more. For instance, schools with 26-50% SOCs offered an average of 13+ AP courses. In aggregate, the differences in AP courses offered by racial composition were statistically significant (p<.05). Additional analysis showed that schools with the most SOCs (76-100%) were statistically different (offering fewer AP courses) from all other quartiles, but that the other quartiles were not statistically different from each other.
We analyzed which schools offer fewer than three AP courses as another way to look at access to AP and rigorous coursework by race/ethnicity. Recall that at least three AP courses are required to attain the North Carolina Academic Scholars Endorsement. Approximately 10% (42 out of 433) schools offered too few AP courses for students to attain the Academic Scholars Endorsement. The mean percentage of SOCs in all schools offering any AP courses was 48%, while the mean percentage of SOCs for schools offering less than three AP courses was substantially higher at 60%. To give an idea of the magnitude of this disparity, more than 13,000 (or approximately 6%) students of color in the state that could earn the North Carolina Academic Scholars Endorsement attend schools that do not offer enough AP courses for them to do so. This compares with approximately 8200 (3.7%) of White students who attend such schools.
Takeaways
To the extent that AP curricula represent college preparatory coursework, non-Asian students of color in aggregate are not finishing high school with the same level of preparedness as their White and Asian counterparts. Nor are they attaining the same amount of college credit from advanced coursework in secondary schools. While we do not examine the link directly in this report, the data suggests that non-Asian students of color would not be viewed as favorably when being considered for admission to competitive colleges and universities as a result of their participation and achievement in AP courses. In addition, if one accepts North Carolina’s assertion that AP coursework is synonymous with rigorous coursework, non-Asian students of color in aggregate attend schools with substantially less rigor. Thus, our analysis of AP courses in the state suggests that students of color experience lower exposure to rigorous coursework, less opportunity to take AP courses, and less opportunity to attain the Academic Scholars high school diploma endorsement, particularly those at schools with high proportions of students of color.
Several additional points bear mentioning with regard to equitable access to AP courses and rigorous coursework. First, the cost of participation in AP exams means that only those who can afford to take multiple AP exams can gain the various benefits of AP coursework. Given that higher proportions of non-Asian students of color tend to be economically disadvantaged (as measured by eligibility for free/reduced lunch), the ability of non-Asian students of color to pay for AP exams may be a constraint on their participation in AP classes. Secondly, beginning in 2016, some AP teachers could qualify for bonus pay depending on their students’ scores from the prior year’s AP exams (Session Law 2016-94). Schools that serve wealthier students and fewer students of color tend to offer more AP courses. Thus, tying teacher bonus pay to student performance on AP exams may provide an incentive for highly qualified teachers to seek positions in wealthier, Whiter school contexts. Finally, the reduction in the access of students of color to AP courses has likely been an unconsidered side effect of the school re-segregation observed in many of NC’s largest school districts over the last two decades (Clotfelter, Ladd, & Vigdor, 2002).
References
Barnard-Brak, L., McGaha-Garnett, V., & Burley, H. (2011). Advanced Placement course enrollment and school-level characteristics. NASSP Bulletin, 95(3), 165-174.
Clinedinst, M., & Patel, P. (2019). 2018 state of college admissions. Arlington, VA: National Association for College Admissions Counselling.
Clotfelter, C. T., Ladd, H. F., & Vigdor, J. L. (2002). Segregation and resegregation in North Carolina’s public school classrooms. North Carolina Law Review, 81, 1463-1512.
Klopfenstein, K., & Thomas, M. K. (2009). The link between advanced placement experience and early college success. Southern Economic Journal, 873-891.
Quinton, S. (2014, December). The race gap in high school honors classes. The Atlantic. Retrieved from https://www.theatlantic.com/politics/archive/2014/12/the-race-gap-in-high-school-honors-classes/431751/
Smith, M. (2012, February). Diverse questions about AP. Inside Higher Ed. Retrieved from https://www.insidehighered.com/news/2012/02/09/ap-enrollment-grows-along-questions-privilege
Theokas, C., & Saaris, R. (2013). Finding America’s missing AP and IB students. New York, NY: The Education Trust.
U.S. Department of Education Office for Civil Rights. (2014). Civil rights data collection: Data snapshot (college and career readiness). Washington, DC: U.S. Department of Education
Editor’s note: James Ford is on contract with the N.C. Center for Public Policy Research from 2017-2020 while he leads this statewide study of equity in our schools. Center staff is supporting Ford’s leadership of the study, conducted an independent verification of the data, and edited the reports.


Recommended reading