North Carolina releases school performance grades, testing data for 2025-26

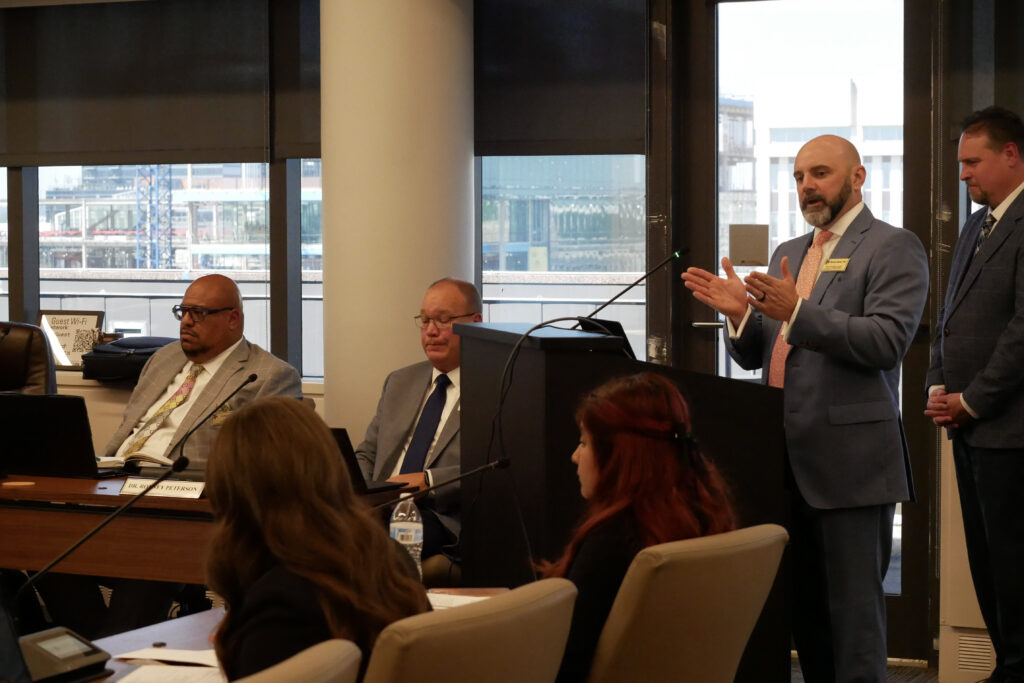
North Carolina public schools showed progress on school and student performance during the 2025-26 school year, according to new data released by the N.C. Department of Public Instruction (DPI) during the State Board of Education’s meeting on Wednesday.
According to DPI, students “achieved a record-high graduation rate and improved performance on most standardized tests,” and “the all-subject and all-grade composite score for end-of-grade (EOG) and end-of-course (EOC) assessments reported 59.2% of students proficient,” which is the highest in the past three years.
“These academic achievement results are a testament to the incredible work happening across North Carolina’s public schools,” Superintendent Maurice “Mo” Green said in a press release. “While I am pleased to see these results trending positively, including our highest graduation rate ever, I look forward to continued progress as we aim to achieve educational excellence for all North Carolina public school students and become the best public education system in the nation.”
 Sign up for the EdWeekly, a Friday roundup of the most important education news of the week.
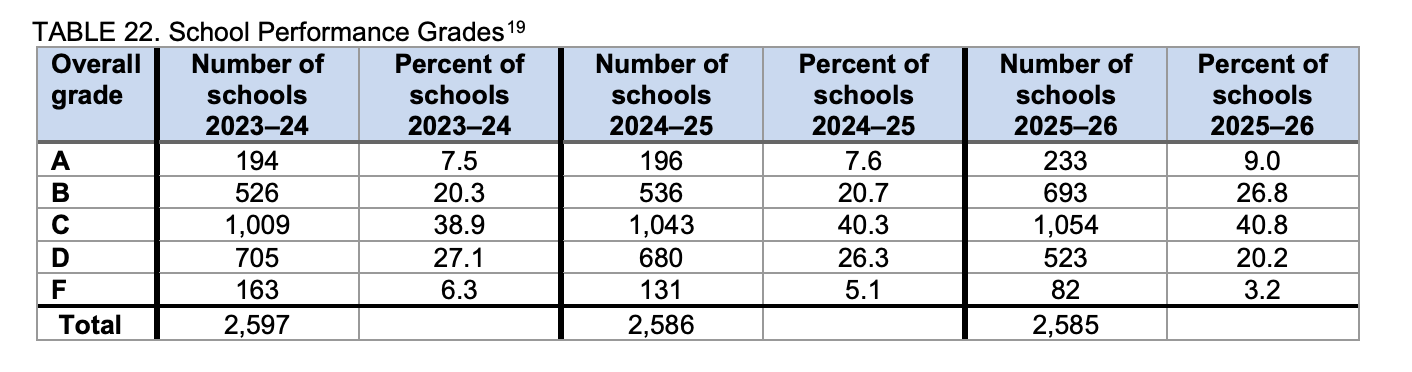
School performance grades continued to trend upward, DPI said, with more schools earning an A, B, or C, and fewer earning a D or F rating.
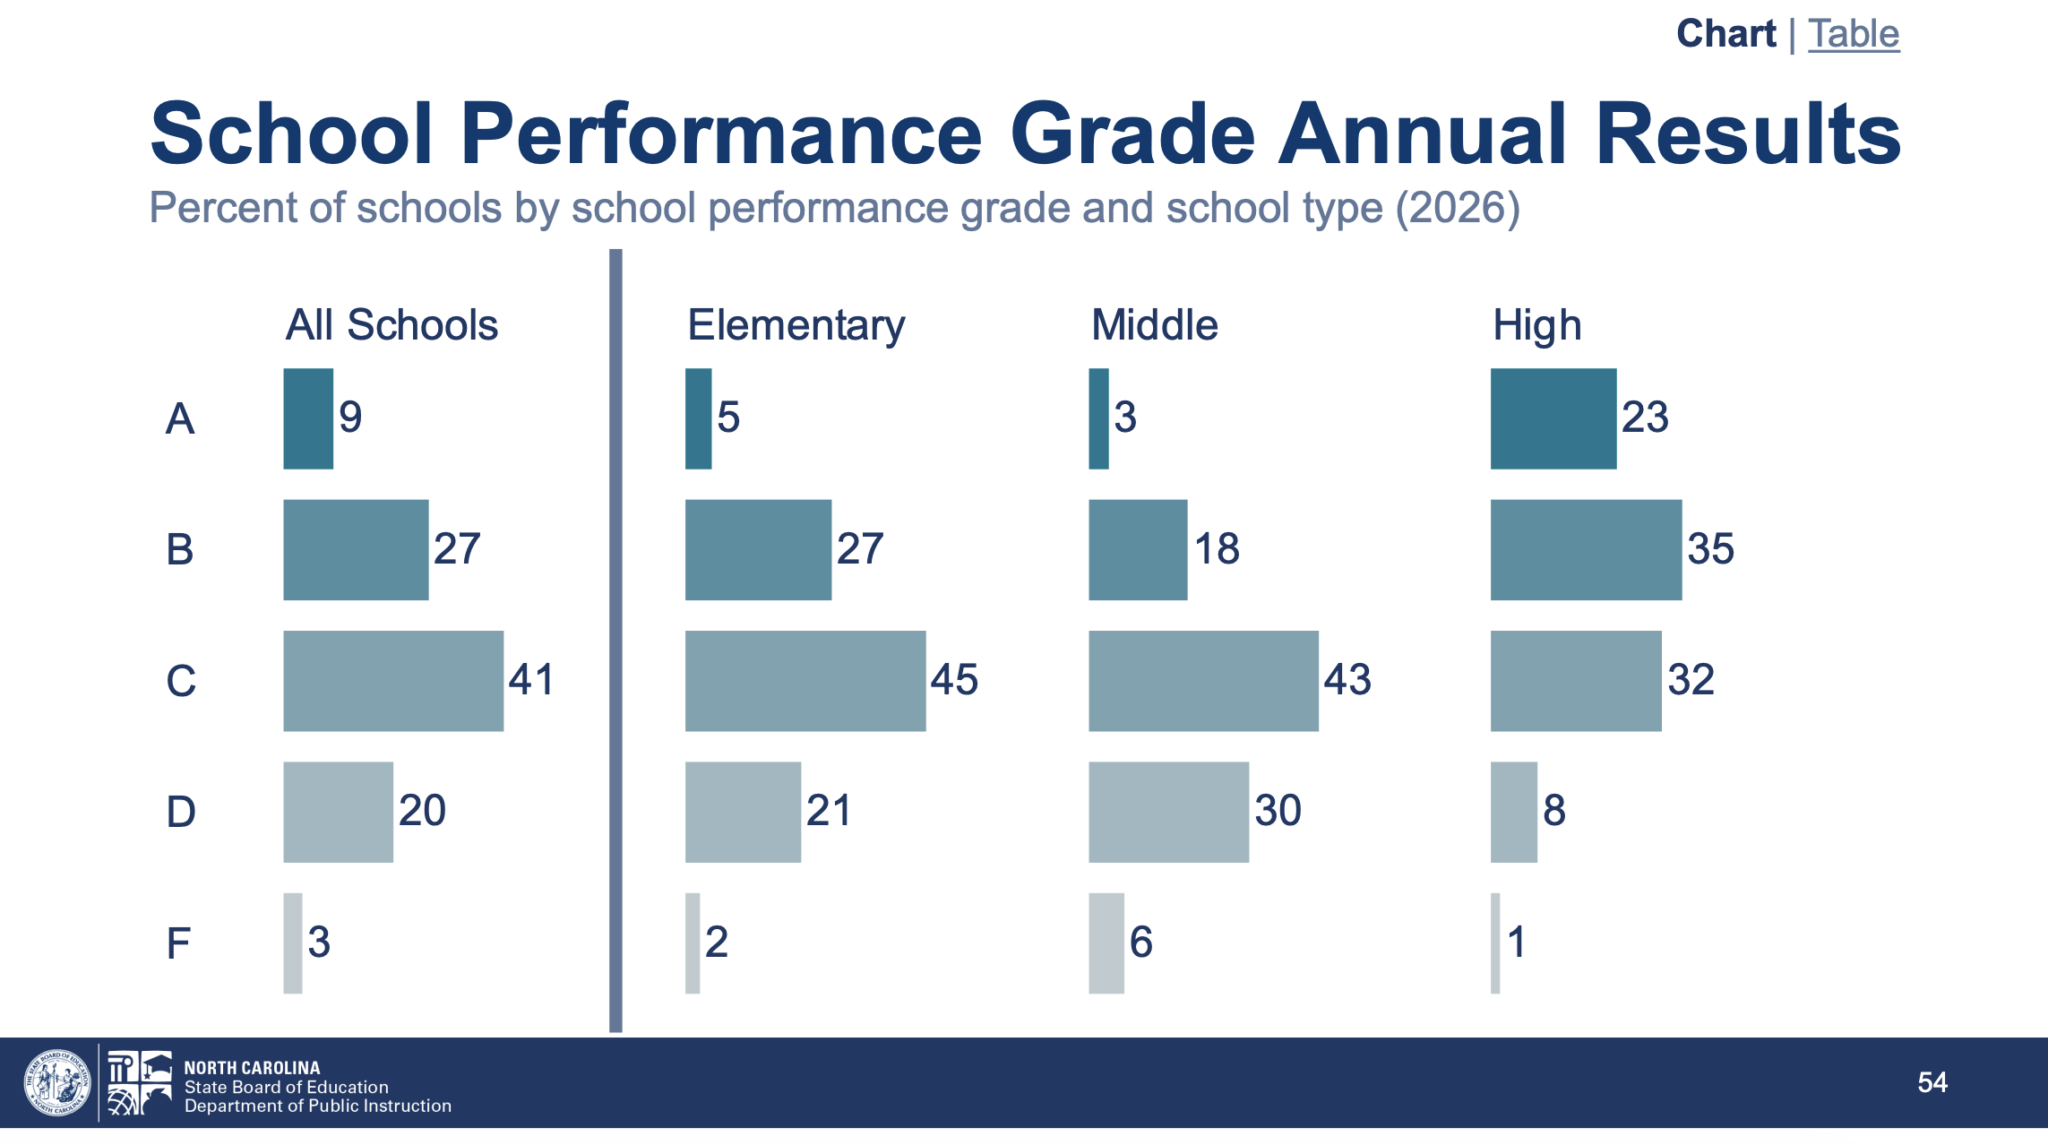
According to the new data, nearly 36% of schools received an A or B during the 2025-26 school year, up from 29% the previous year. The percentage of schools labeled D or F dropped to 23% in 2025-26, down from 31% the previous year. Only 3.2% of North Carolina schools received an F grade.
Nearly three-fourths of schools met or exceeded growth during the same time period (73%).
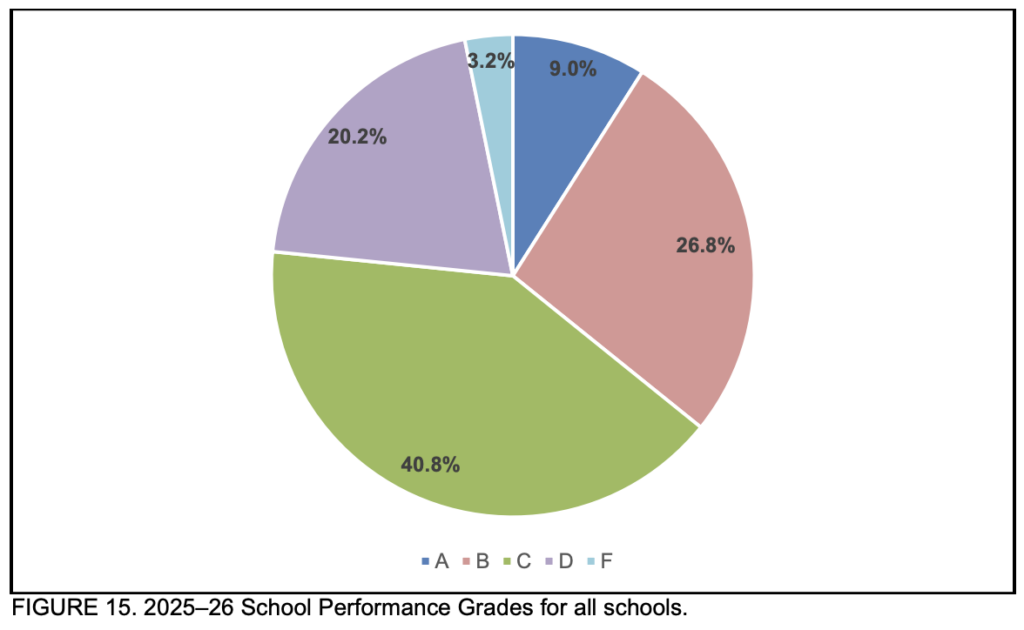
In North Carolina, school grades are based on each school’s achievement score (including standardized test grades), weighted 80%, and on students’ academic growth, weighted 20%. The grade designations are set on a 15-point scale: A = 85-100, B = 70-84, C = 55-69, D = 40-54, and F = 39 or less.
Education leaders have long said the current formula does not capture the full picture of the work happening in the state’s public schools. Under the leadership of former state Superintendent Catherine Truitt, DPI advocated for state lawmakers to change how school performance grades are calculated to account for more factors than achievement and growth. While lawmakers initially showed interest in DPI and Truitt’s plan, they never passed legislation changing the formula.
In October, the State Board of Education proposed a task force to develop a new school-level accountability system.
“Every September, this Board carefully reviews the previous school year’s academic accountability and test results, which are just one of the key measures of our state’s investment in our students,” Board Chair Eric Davis said at the start of Wednesday’s meeting. “While these academic results are vital in understanding what students are learning, where we are making progress, and where we need to improve, these results tell only part of the story about the education that our students are receiving and the performance of their schools.”
Davis said that is why the Board launched its task force, which he said “is hard at work developing a system that is less reliant on standardized tests and that will provide a more complete and accurate assessment of educating the whole child in every student.”
According to a draft timeline, the task force will begin work to finalize their report in December. Statewide implementation of the new model would begin in October 2027 if the plan receives the necessary Board and legislative approval. You can read more about the task force’s work here.
Student standardized test scores account for the bulk of each school’s achievement score, which is 80% of a school’s score. Other factors included in this score are the percentage of English learners who meet the progress standard on the English proficiency assessment and the percentage of students who graduate within four years of entering high school.
School growth is calculated through the EVAAS model, which according to DPI, “uses current and previous student test scores to determine whether schools are maintaining or increasing student achievement from one year to the next. If a school does not have a Growth Score, only the School Achievement Score is used to calculate the Performance Score.”
Here is the dashboard where you can find school performance grades, which includes a “Guide to this dashboard,” in the upper righthand corner.
Under “Select a group of schools,” a drop-down menu will allow you to choose a district or pick charter, laboratory, or regional.
To explore a specific school’s report, begin typing the name of the school. Then a drop-down menu under “Choose a school” will appear and allow you to select the school you are interested in.
Once you select a school, you can see the school grades from 2022 to 2026. Note that growth shows up as a numeral.
Here is DPI’s press release, and here is DPI’s presentation.
Here is where all the data lives. Click on documentation to see the background brief, for example. Click on reports to see the low-performing state designations. Here you can find zip files for disaggregated data, which download as text files.
And here is the annual testing and performance report. Below, you can find a look at school performance grades over time, starting in 2023-24.
More on school performance grades
In North Carolina, schools that receive a score of D or F and don’t exceed growth are considered “low performing.” Low-performing districts are districts where more than 50% of schools are identified as low performing. Continually low-performing schools are schools identified as low performing in any two of the last three years.
According to DPI, 162 fewer schools were designated low performing in 2025-26 compared to the year before, and nearly 100 fewer schools were designated continually low performing over the same span. Only 10 districts were designated low performing this year, which is 13 fewer than in 2024-25 and the fewest since 2018-19, per DPI.
Across the state, some education leaders push back on the deficit focus of the “low performing” framework. Dr. Anthony Jackson, former superintendent of Chatham County Schools and CEO of the Public School Forum of North Carolina, has noted there are high-performing students in every school. He has proposed labeling schools not as low performing, but as “Schools in Need of Support.”
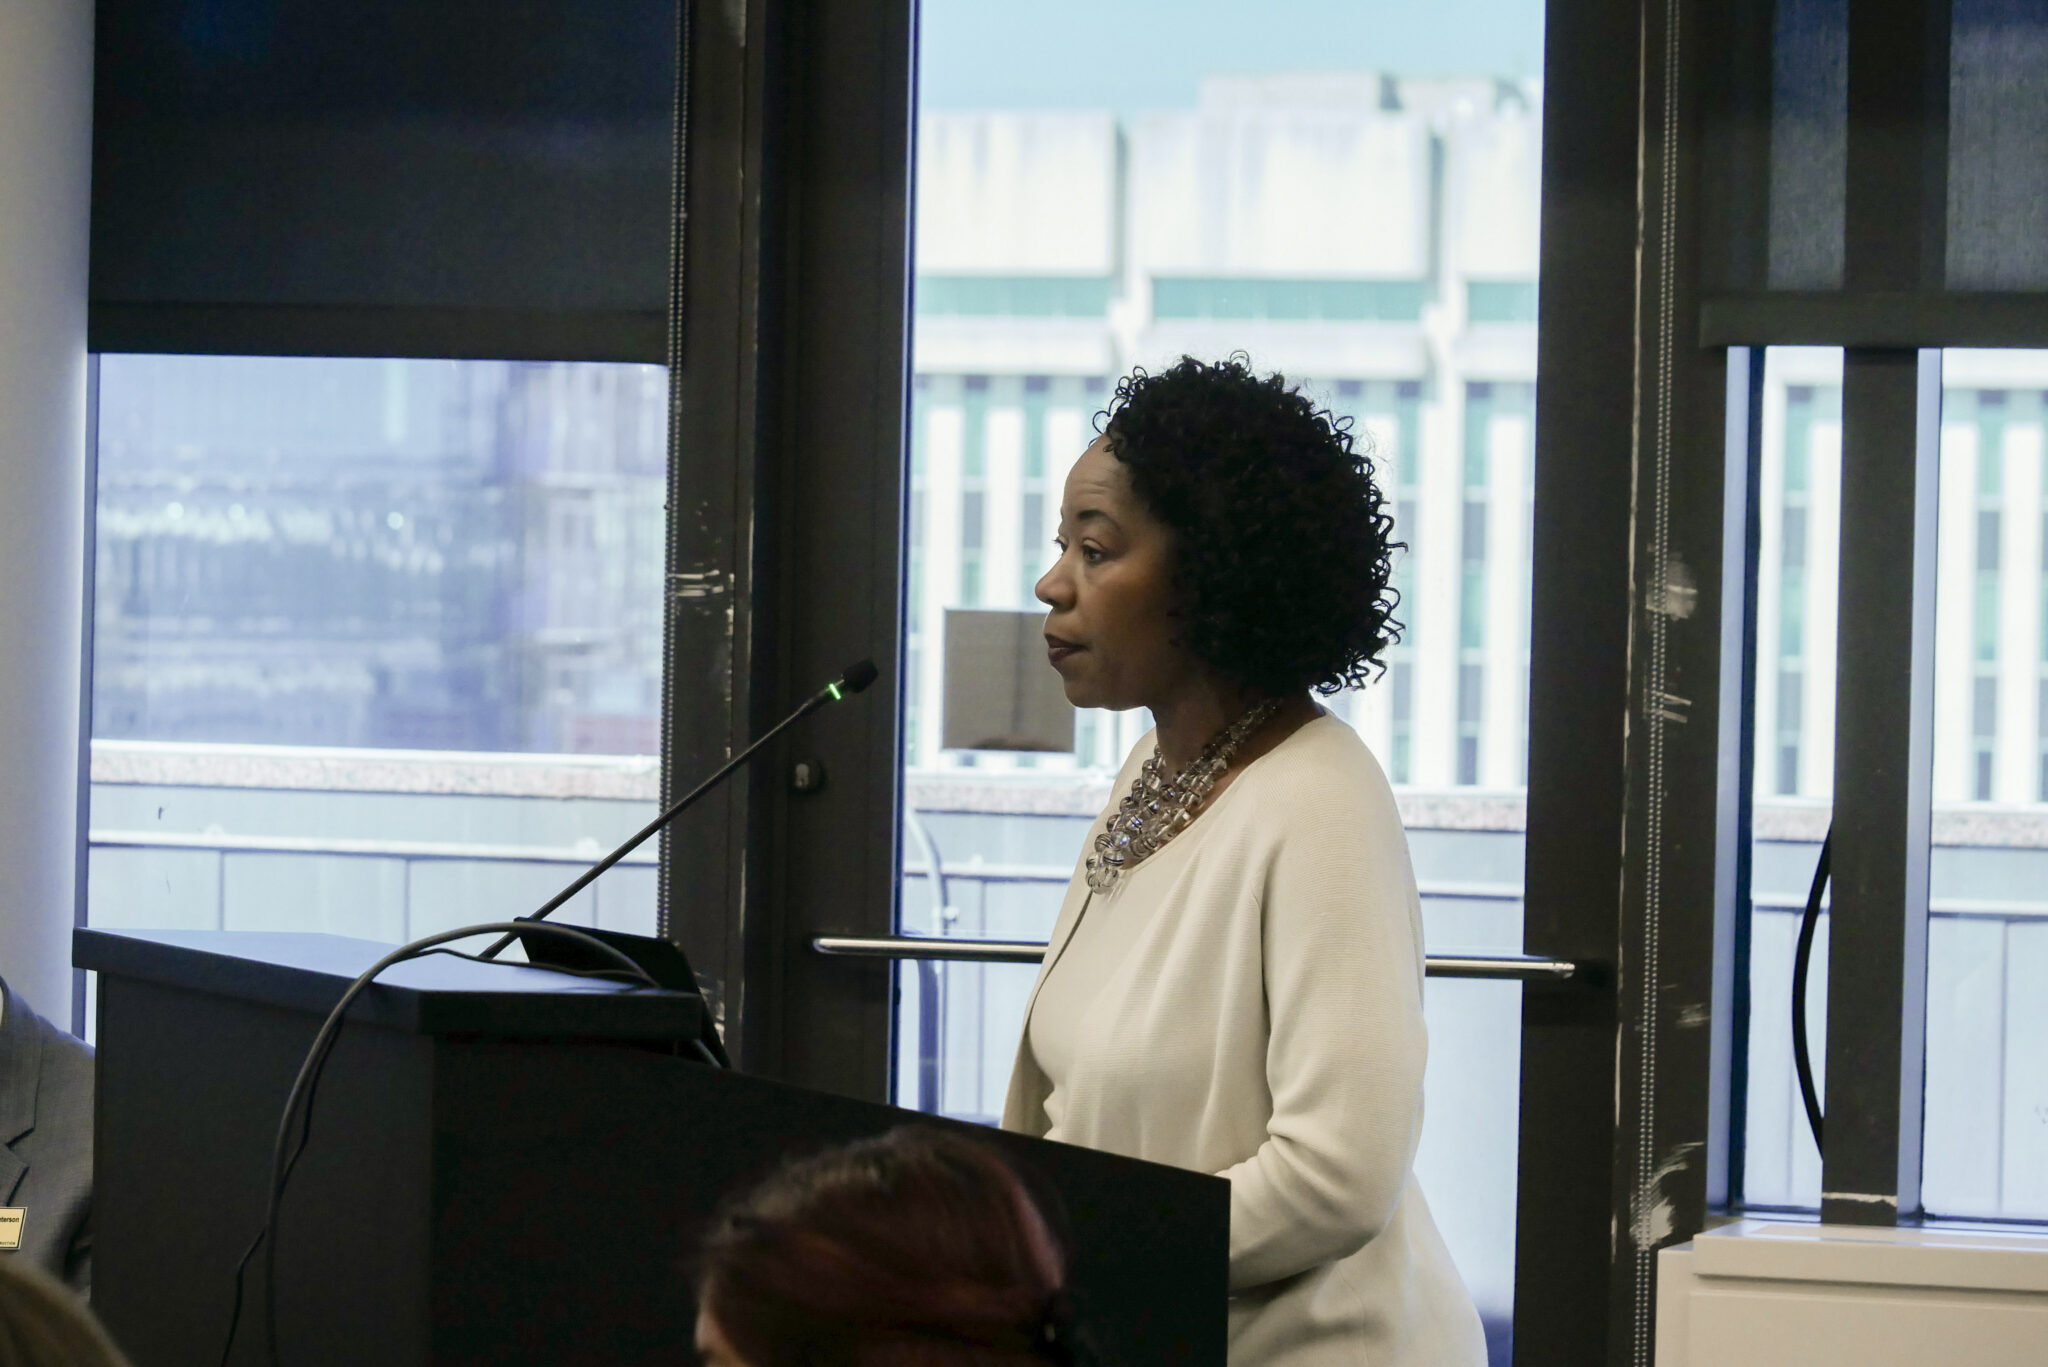
On Wednesday, Dr. Stacey Wilson-Norman, DPI’s chief academic officer, said DPI is redesigning regional support to provide differentiated support across the state, including through instructionally focused positions, to better support low-performing schools and districts to carry out their improvement plans.
The new state budget, passed in July, also lays out many new math-related policies focused on low-performing schools. Read more on page 151 of the budget’s bill text.
A look at growth, school type
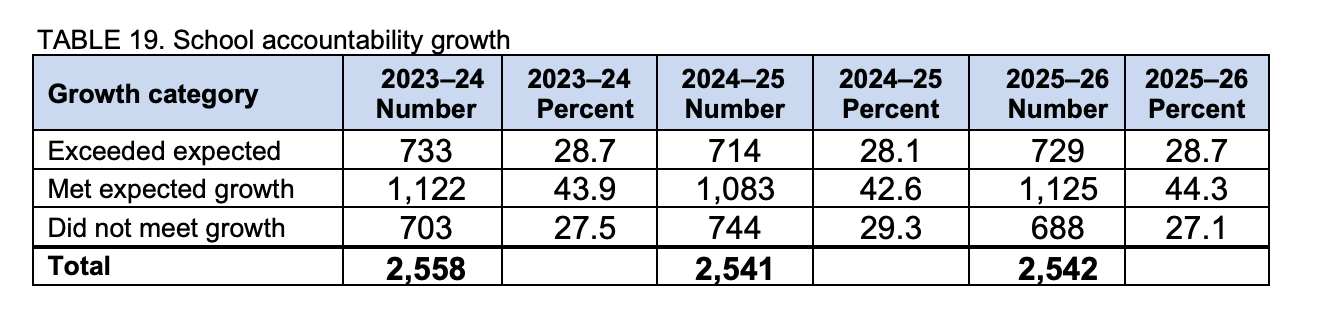
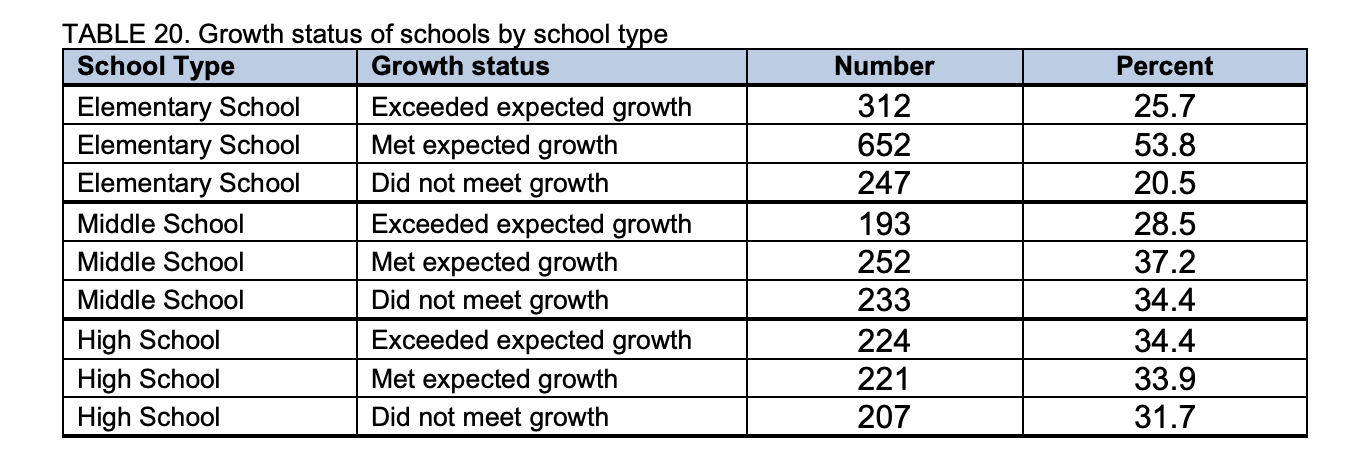
During the 2025-26 school year, 1,854 schools met or exceeded growth, or 73% of schools. This is up slightly from the previous school year, when 70.7% of schools met or exceeded growth.
The table below shows the growth rate of North Carolina’s schools over time. Note that because school growth only makes up 20% of the composite performance score, some of the schools which met or exceeded growth could still have received a “D” or “F” grade.
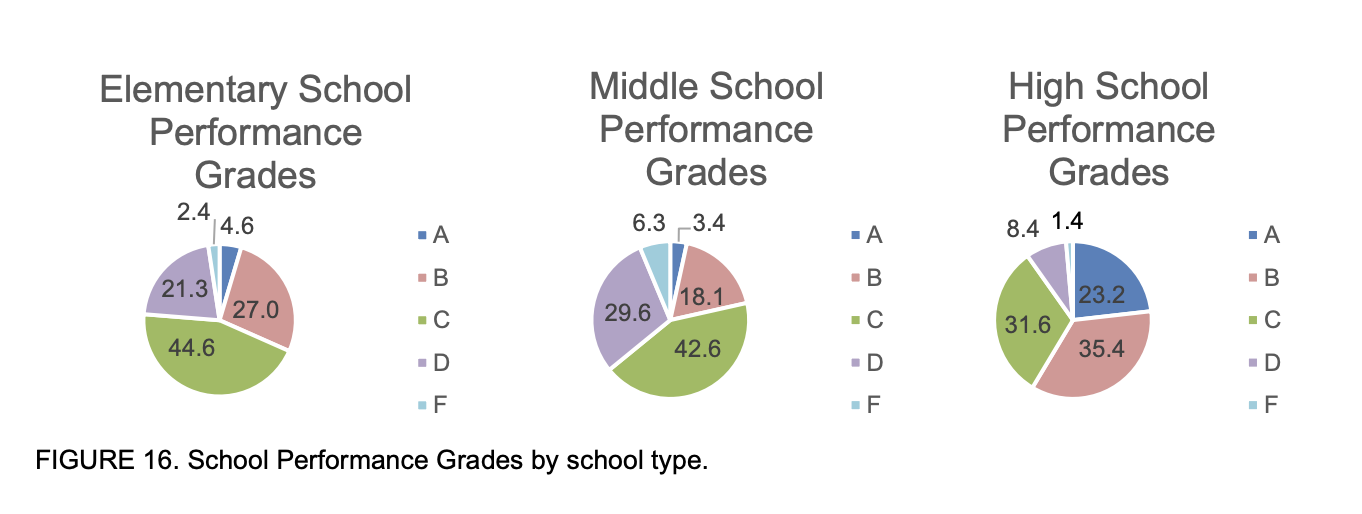
The report also separates school performance grades by school type — elementary, middle, and high.
High schools have a larger proportion of schools with grades of A or B. However, high schools have more indicators than middle and elementary schools because high school students take a larger number of standardized tests.
In 2025–26, 72.0% of the elementary and middle schools earned a grade of
— DPI report
C or better, compared to 90.2% of high schools. This difference may be attributable to the indicators for each model. The high school model has more measures (Cohort Graduation Rate, ACT/WorkKeys, Math Course Rigor) than elementary and middle schools.
Subgroup data
The DPI report also includes analysis for student subgroups, including students with disabilities, English learners, economically disadvantaged students, and white, Hispanic, Black, Asian, American Indian, and biracial or multiracial students. To receive a letter grade, a subgroup must have 30 students in membership in the school.
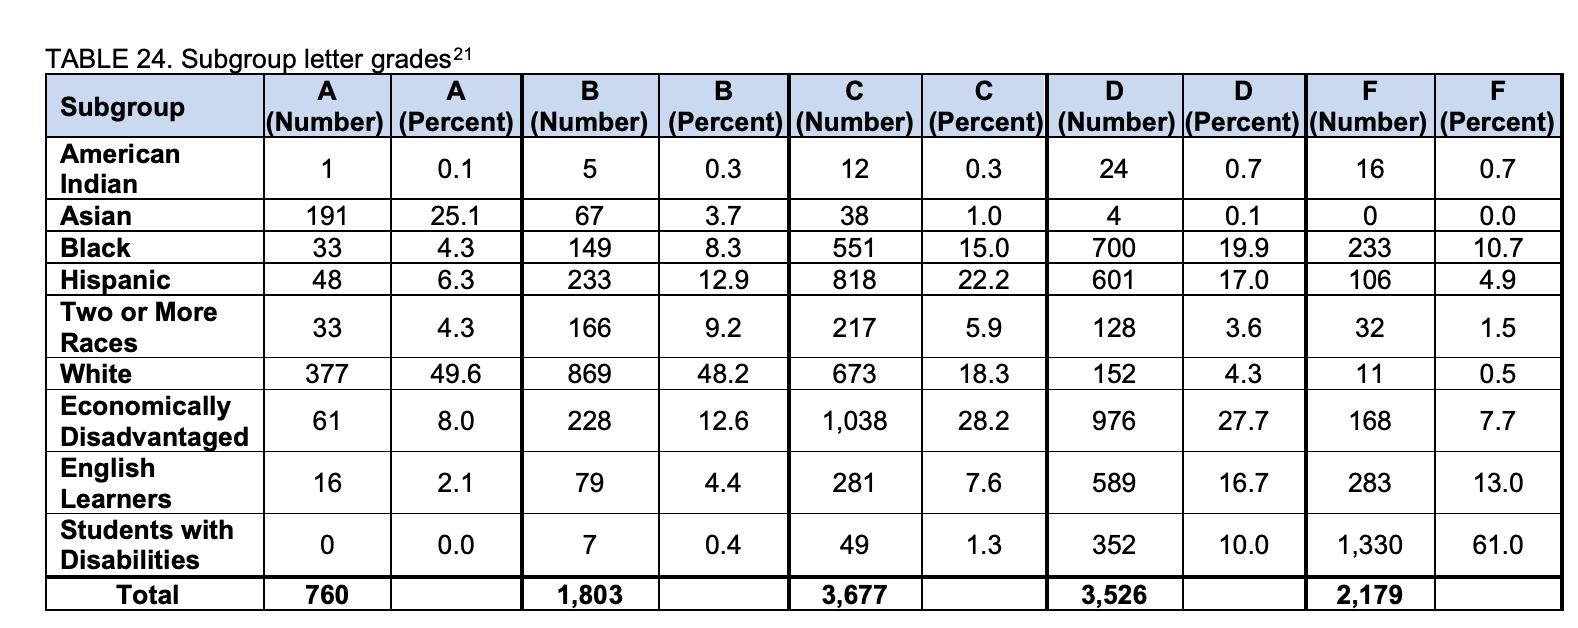
Testing data, which was also presented on Wednesday, also includes subgroup analysis. You can view test results disaggregated by subgroup for each subject and grade level starting on page 5 of DPI’s report.
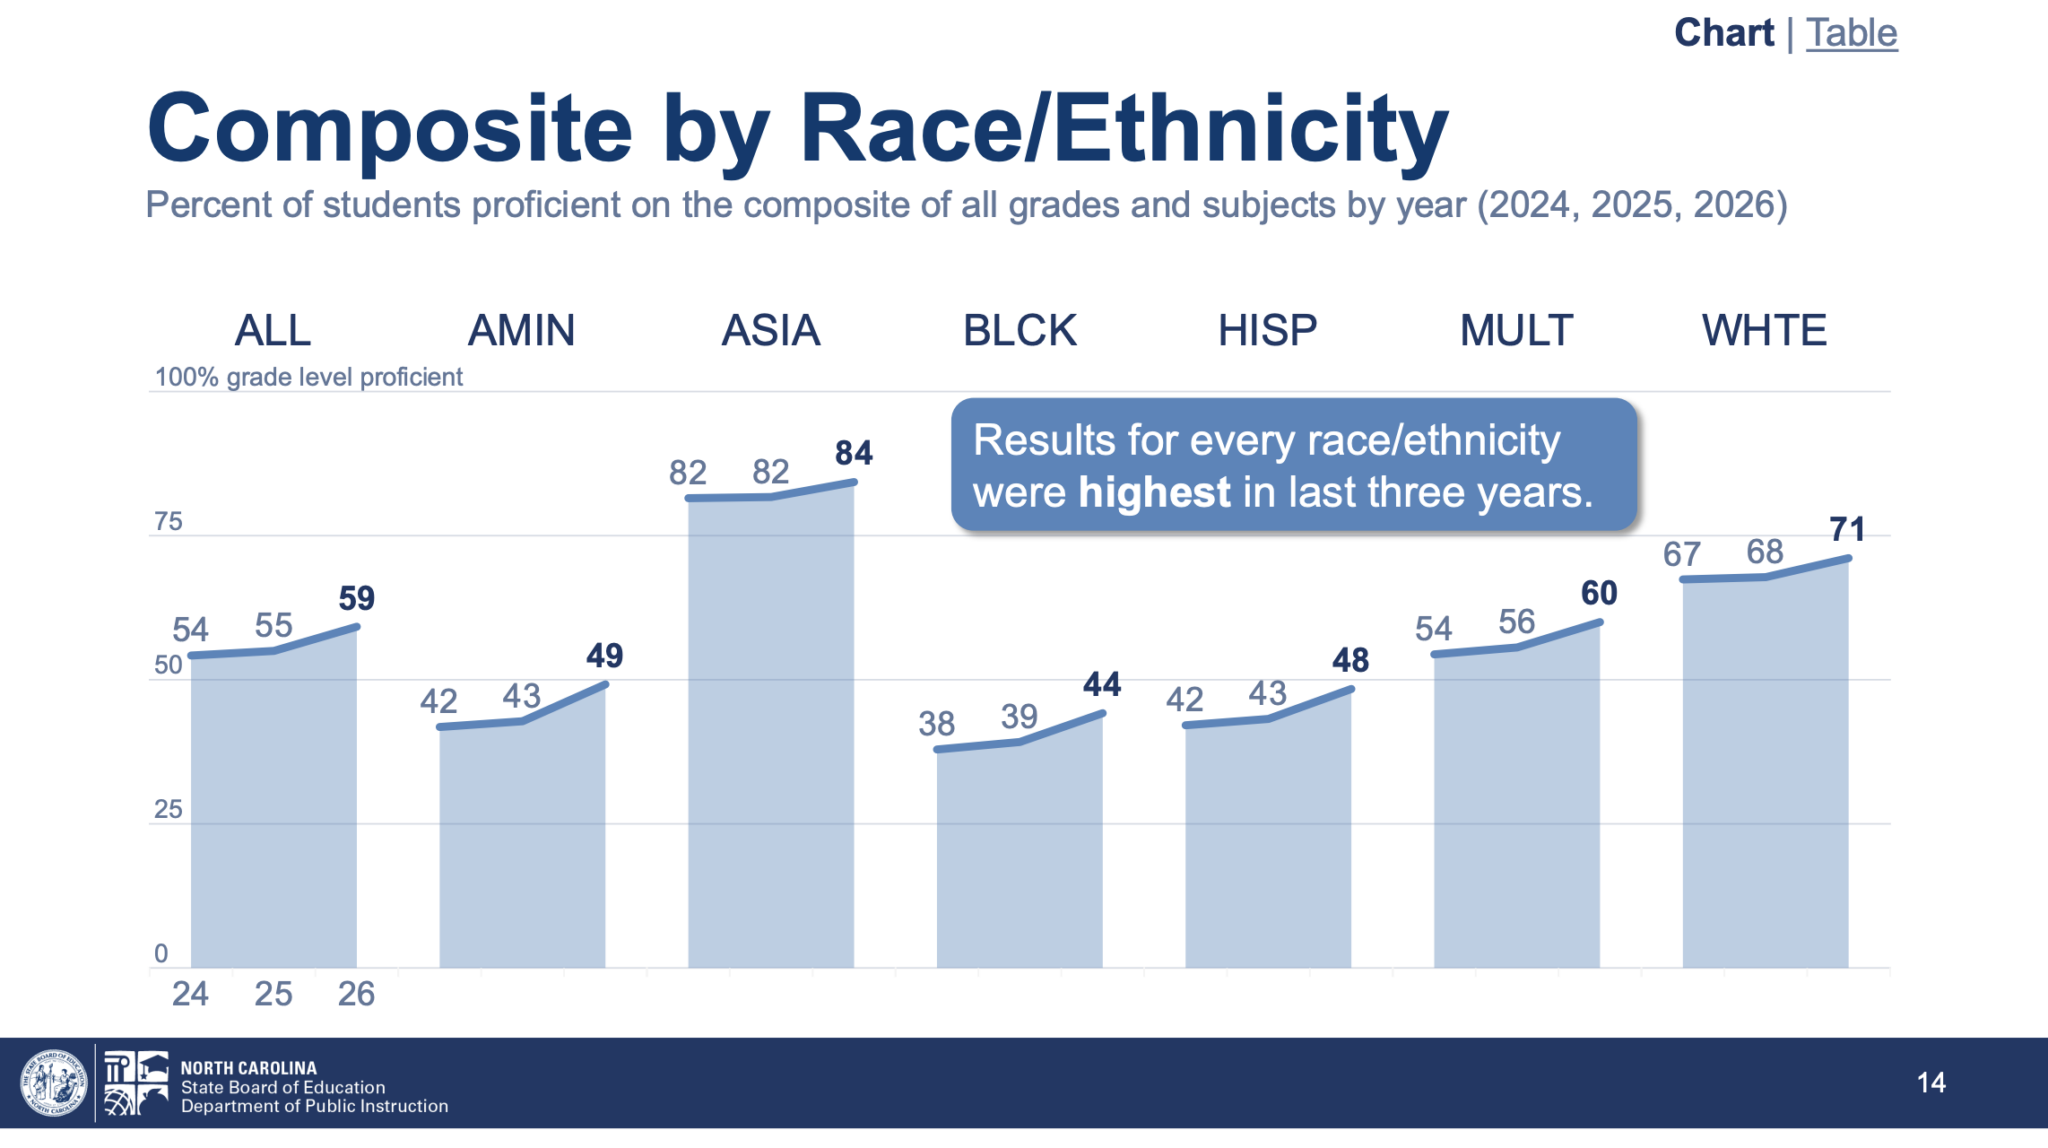
According to DPI’s presentation, composite results for all race/ethnicity subgroups were the highest in the last three years. This was also true for English language learners, students who are economically disadvantaged, and students with disabilities.
In the press release, DPI said this reflects “both progress across the full range of North Carolina’s student population and the need for continued improvement.”
Districts celebrate new performance grades
Board member Jill Camnitz said the new data “reflects last year’s hard work by students, teachers, and staff, and so we’re going to celebrate success.”
On Wednesday, districts across the state celebrated their new performance grades.
In northeastern North Carolina, Elizabeth City-Pasquotank Public Schools (ECPPS) hosted a press conference at the College of The Albemarle to officially release the new results.
“The district’s overall proficiency increased 21.1 percentage points, rising from 34.1% in 2022 to 55.2% in 2026. During the same period, the district’s four-year cohort graduation rate increased 17.5 percentage points, from 65.4% to 82.9%,” a press release from the district says. “Every school increased its achievement score since 2022, and five schools moved up two letter grades. In total, 11 schools increased their letter grade during the period highlighted in the district data.”
“This progress is a reflection of the hard work of our students, educators, school leaders, families, and community partners,” said Superintendent Dr. Keith Parker. “These numbers represent more than improved scores. They represent students who are learning, teachers who are making a difference, and schools that are continuing to move forward. We are proud of how far ECPPS has come and excited about the achievement that awaits in the upcoming school year. When we work together and stay focused on student success, there isn’t anything we cannot achieve.”
Charlotte-Mecklenburg Schools Superintendent Dr. Crystal Hill joined DPI at its press conference about the new results on Wednesday, where she spoke about CMS gains. The district saw its second straight year of rising test scores, along with continued improvements in graduation rates across the district.
“This progress belongs to our students, teachers, school leaders, staff and families,” Hill said in a release. “These results show what is possible when we remain focused on strong instruction, high expectations and providing every student with the support they need to succeed. We are proud of the progress our students are making, and we remain committed to building on this momentum.”
School leaders from Winston-Salem/Forsyth County Schools (WS/FCS) also held a press conference to discuss district results. According to a report by WXII 12, six schools were removed from the state’s designated low-performing list, the district saw its highest score in third grade reading in 10 years, and graduation rates increased.
“Everything that they did last year displayed the wonderful working aspect that they have of working as a team,” said WS/FCS Superintendent Dr. Don Phipps, “performing their professional roles under unbelievably difficult circumstances — more difficult than I think anyone could have ever imagined.”
North Carolina Cyber Academy, one of North Carolina’s stand-alone virtual charters, celebrated its first “C” grade.
“Based on this year’s results, NC Cyber is the only statewide virtual public school in North Carolina not designated as low-performing,” the academy said in a Facebook post. “Congratulations to everyone at our school, from our students to our staff, teachers, parents, and stakeholders, for your role in this tremendous achievement! Everyone has a stake in our school’s continuing success!”
Other districts across the state also celebrated the new scores: Chatham County Schools, Durham Public Schools, Hyde County Public School System, Cabarrus County Schools, Lexington City Schools, and more.
Typically, after DPI releases its school performance data, schools and districts have two weeks to review the data to make any corrections, with any updates to be discussed by the Board in October.
What’s next?
After acknowledging the need for celebration, Camnitz said, “We’re also going to identify where we need to concentrate our efforts in this coming year.”
Wilson-Norman discussed how DPI plans to use this momentum to move forward.
“Our progress is real, our work is unfinished, and our direction is clear,” she said. “These gains create momentum and a call to accelerate. The question, therefore, is how North Carolina sustains and extends this progress.”
First, she said, North Carolina is moving from a focus on early literacy to a “coherent K-8 literacy system, ultimately connecting the foundation to college, career, and opportunity.”
Next, she said, the state is working to move more students toward college readiness, rather than just grade-level proficiency. In North Carolina, students who receive a score of a Level 3 or above on end-of-course and end-of grade exams are considered “Grade Level Proficient” (GLP). Students who earn a Level 4 or above meet the Career and College Readiness (CCR) standard.
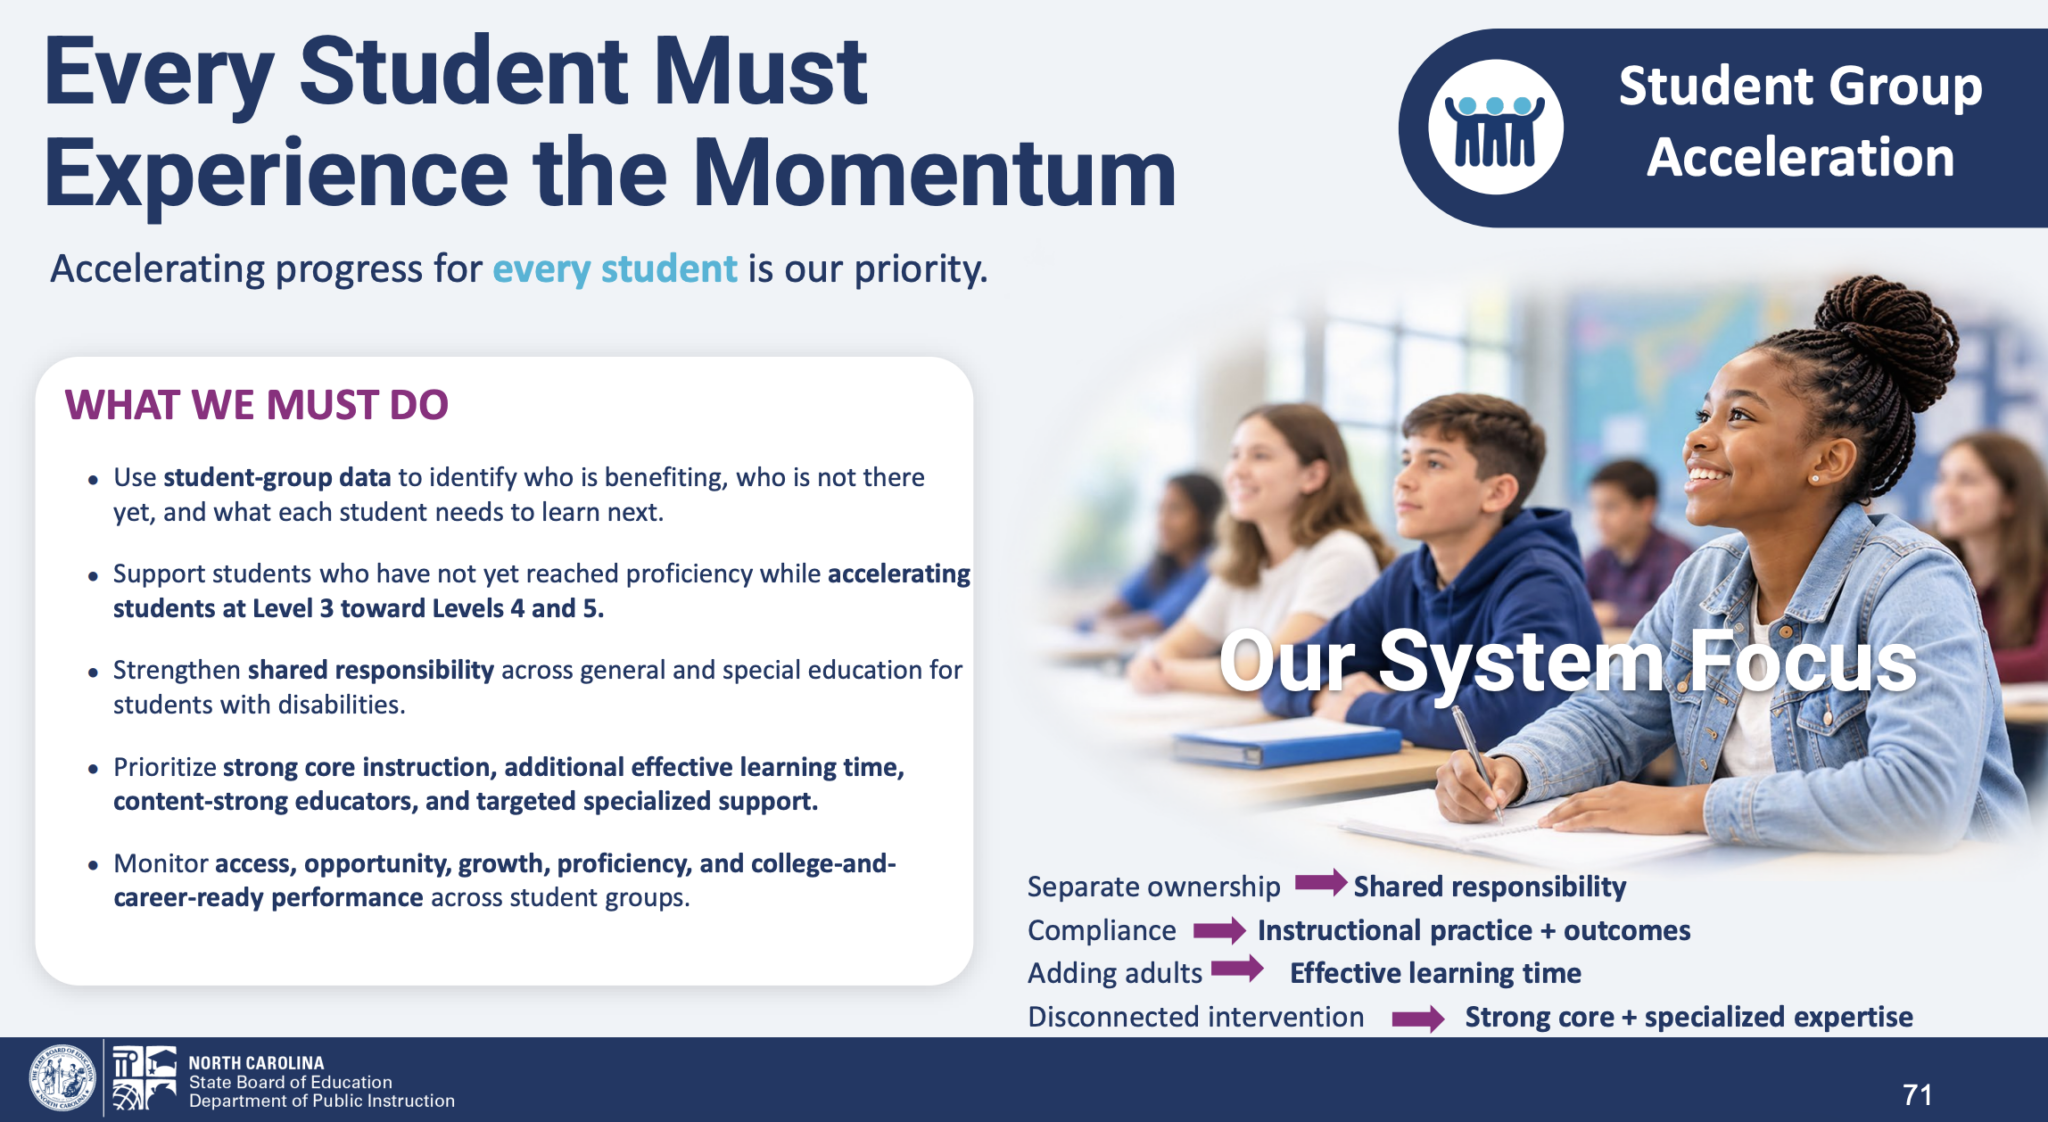
“Grade-level proficiency is an essential milestone,” DPI’s presentation said. “Now, we must accelerate progress for students who are not yet proficient and move more students from Level 3 toward Levels 4 and 5.”
“One of the clearest opportunities for acceleration is in the middle grades,” Wilson-Norman said. “The middle grades cannot be a place where early gains disappear. The middle grades must serve as the bridge between learning to read and using reading, writing, reasoning, and knowledge to succeed in high school.”
DPI will also continue to focus on strong core instruction and standards, she said, along with building educator and leader capacity.
More on testing results
The 2025-26 state test results, which were also presented to the Board on Wednesday, show that 59.2% of students passed state exams last school year, up from 55% the prior year, and slightly above the pre-pandemic proficiency rate of 58.8% in the 2018-19 school year.
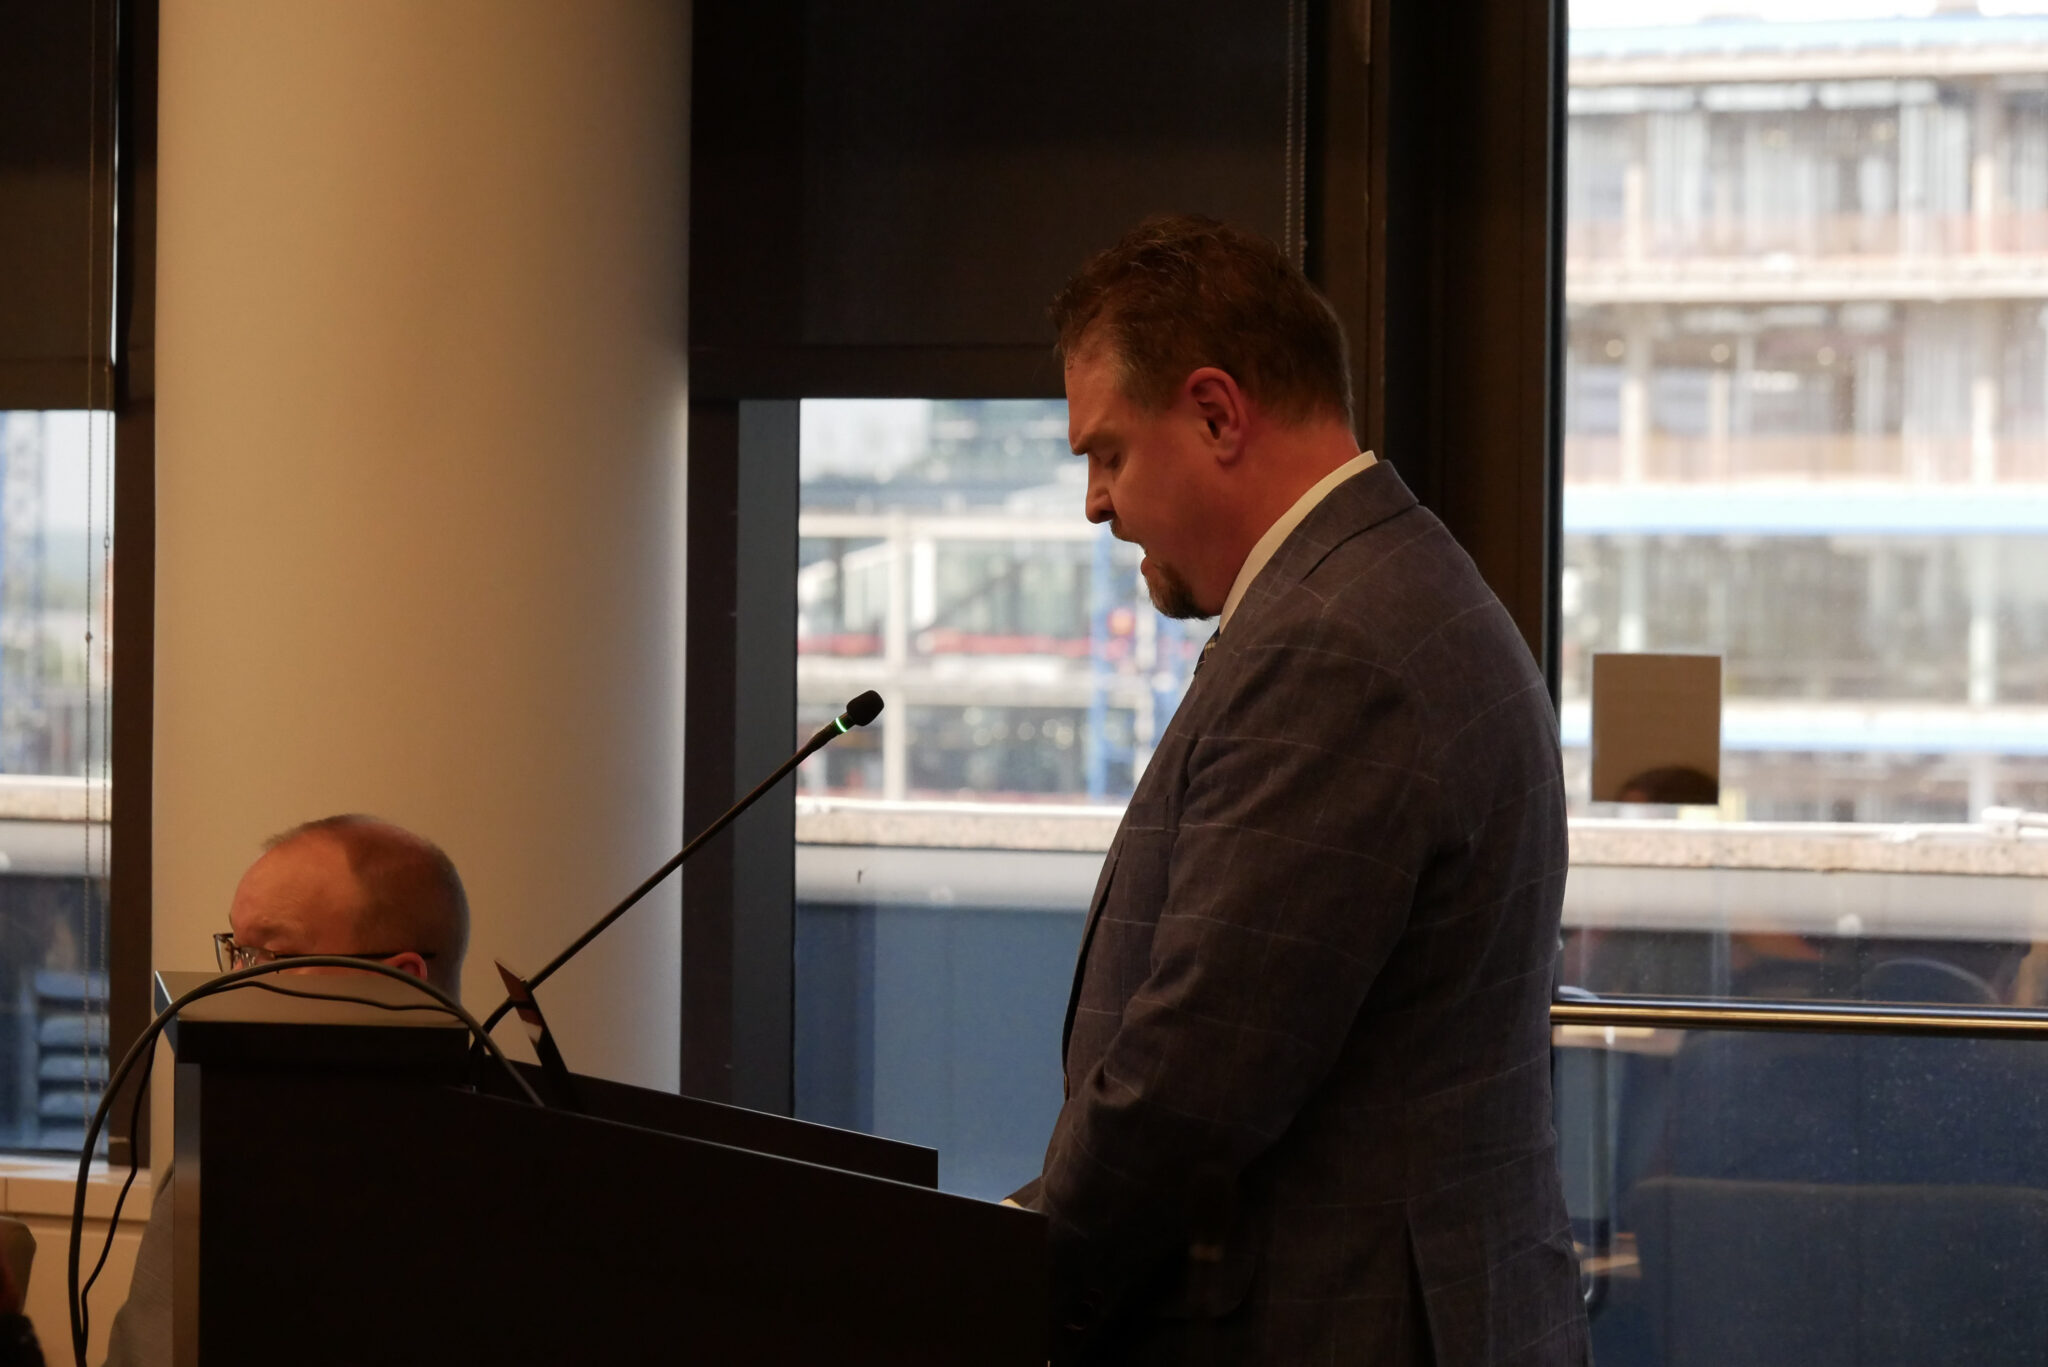
Dr. Michael Maher, DPI’s chief accountability officer, said this year’s data shows “broad improvement, not simply in one or two measures, but across much of the system.”
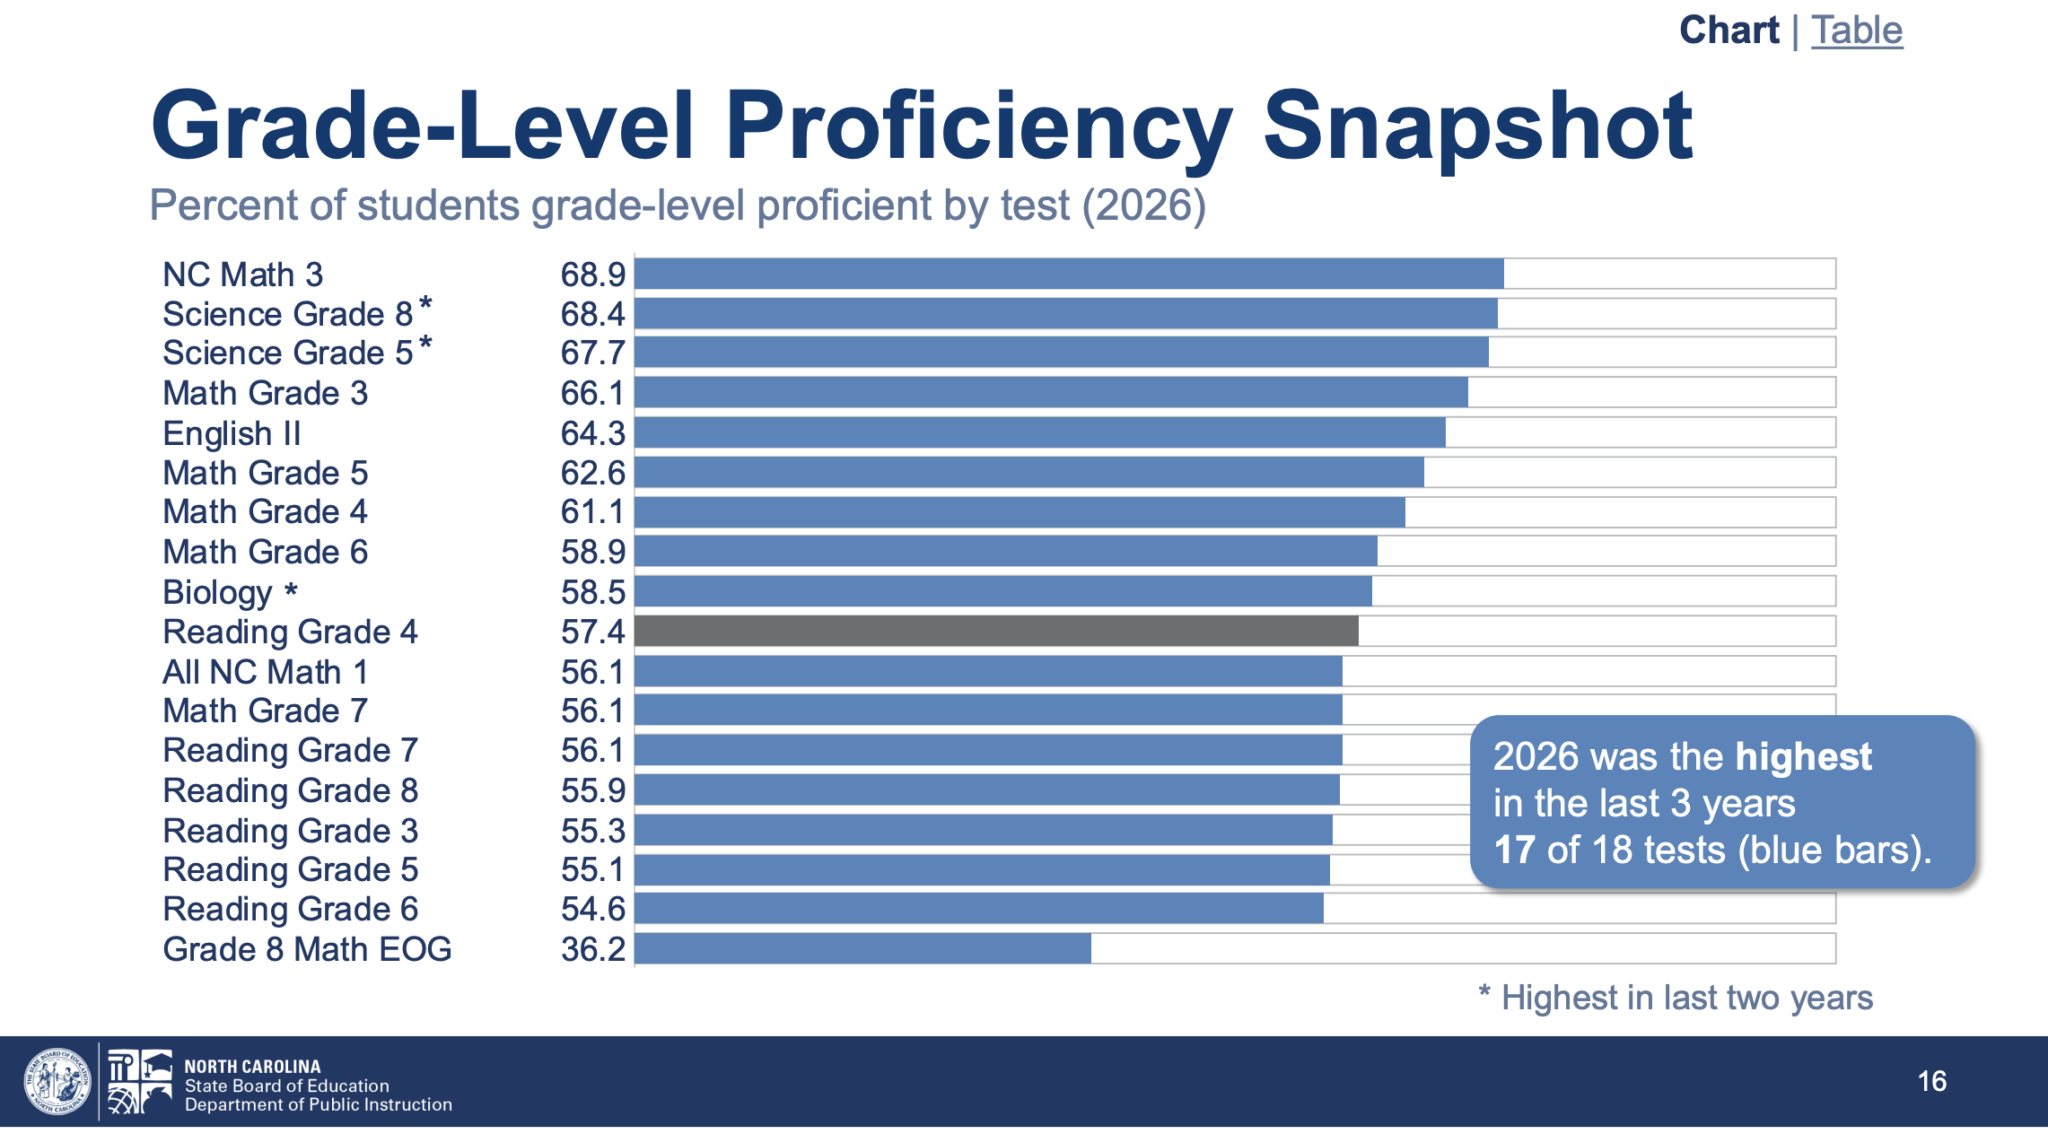
Here’s a look at students who were “Grade Level Proficient” (GLP) on the tests.
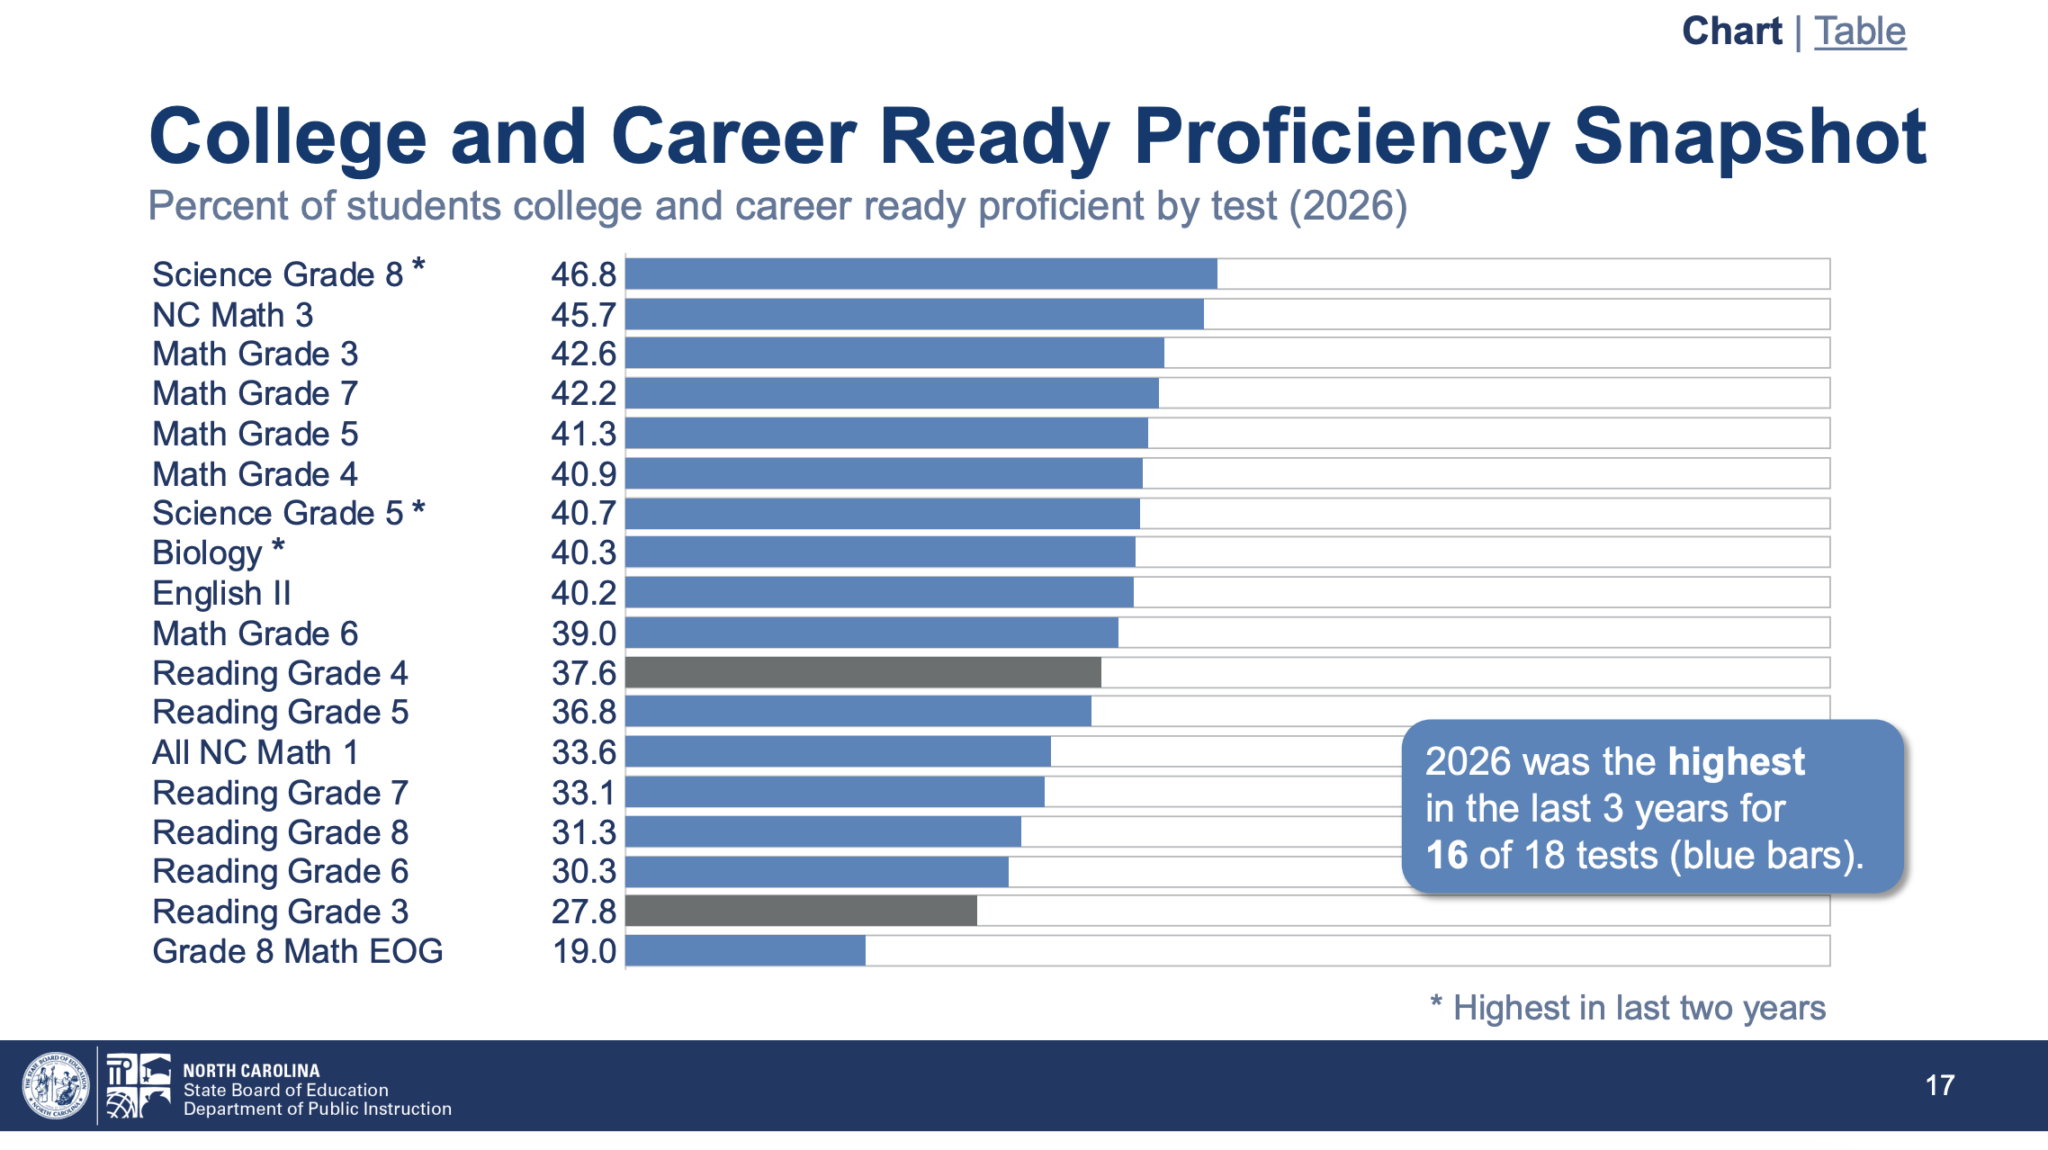
And here is a look at students who scored Career and College Ready (CCR) on the tests.
As mentioned above, DPI said composite results for all race/ethnicity subgroups were the highest in the last three years.
You can look at the GLP over time for student subgroups, created by the News & Observer, in the data visualization below.
Maher said opportunities for growth continue to include decreasing achievement gaps among student groups.
“We need to improve the achievement in reading and mathematics across our subgroups of students,” he said.
Finally, the average ACT composite score for 11th graders increased to 18.4, per DPI, with 55% of students scoring a 17 or higher, which is the minimum score for admission to a university within the University of North Carolina System.
According to DPI, “this year’s results include a one-time correction that increased scores: ACT identified a technical scoring issue in its spring 2026 online, school-day testing and rescored all affected exams nationwide. Because this year’s composite includes those one-time increases, NCDPI will monitor how this year’s ACT results compare with future years as part of its ongoing trend analysis.”
“What we’re releasing today is one snapshot of performance,” Maher said on Wednesday. “It is an important measure, but only one measure. Learning progress and the quality of the school are broader than any single set of accountability results.”
You can view the full report on testing results and school performance grades here.
Below, watch the press conference given by DPI regarding the new accountability data.
Editor’s note: Dr. Keith Parker is the chair of EdNC’s Board of Directors.