In North Carolina, state law mandates that schools be in session for 185 days or deliver 1,025 hours of instruction. That means in a calendar year there are 180 days a child is not in the classroom or 7,735 hours when they are not receiving instruction.
Whenever a child takes his or her seat in a classroom, depending upon what might be going on in that child’s life, a teacher may be swimming against a current of hunger, homelessness, poverty, poor health, or abuse.
The school house walls are porous and life seeps in, for better or worse, both the good and the bad.
The statistics are sobering. The Annie E. Casey Foundation’s Kids Count Data Center notes that in 2013, 25.1 percent of the state’s children lived in poverty, with 12 percent living in extreme poverty in the same year. And 30 percent received public assistance.
The National Center for Children in Poverty notes that in 2013, 20 percent of poor children had moved in the past 12 months, compared to only 14 percent of “not poor” students. That same year, only 28 percent of poor children live in owner-occupied housing, compared to 70 percent of “not poor” children.
The issue of housing instability was mapped by the Friday Institute for Educational Innovation’s Emily Antoszyk in this month’s edition of Consider it Mapped.
At EdNC we have written about how hunger and economic insecurity affect educational attainment, but Antoszyk’s maps add an additional layer of nuance to the interplay of factors that impact the lives of children living in poverty. She notes that in 2014, children accounted for 22 percent of the state’s homeless population. It’s beyond question the impact homelessness has on a child’s ability to learn, but Antoszyk digs deeper to look more broadly at housing in the state and how housing insecurity can affect educational attainment. Antoszyk notes:
Many different housing factors can influence student education outcomes, and the research consensus is that less stability in housing leads to lower student achievement. Children who are homeless may have a harder time keeping up in school because they don’t have access to the necessary resources to continue their learning after school. Even if resources are available, lack of stable housing can mean that these children are in chaotic situations that are not conducive to learning when they leave school, which can have negative impacts on their grades and test scores.
Housing instability
Antoszyk first looks at housing instability using the percentage of renters who spend more than 30 percent of their income on housing and measuring area vacancy rates — noting the importance of high vacancy as an indicator of a weak tax base and higher crime rates.
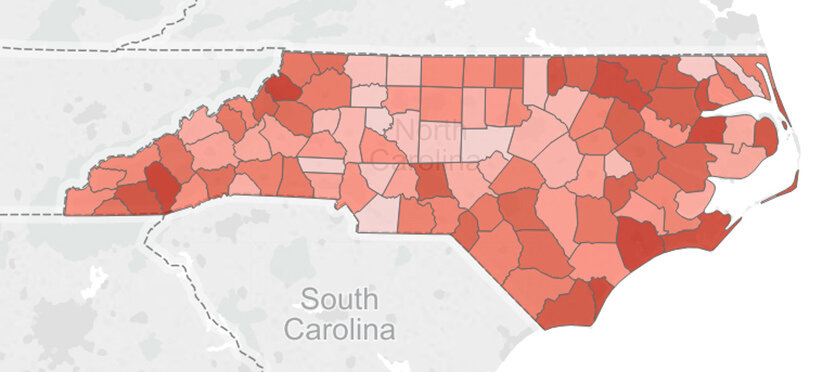
The darker areas indicate counties with a higher housing instability rank. Union County has the state’s lowest level of housing instability with only 9.5 percent of renters spending more than 30 percent of their income on housing costs and only a 6.6 vacancy rate. Compare those numbers to a place like Jackson County, where 16.5 percent of renters spend more than 30 percent of their income on housing costs and which has a 39.4 percent vacancy rate. Explore the interactive map here.
Housing stability
In calculating the flip side of housing instability, Antoszyk calculated housing stability by measuring the number of homeowners in a given county who are not cost-burdened (spending 30 percent or less of their income on housing), a greater diversity in housing options (measured by the spread in the cost of homes, signifying more diversity in home prices), and the growth in housing stock (with growth as an indicator of an area’s desirability). The formula results in a ranking of housing stability in the state.
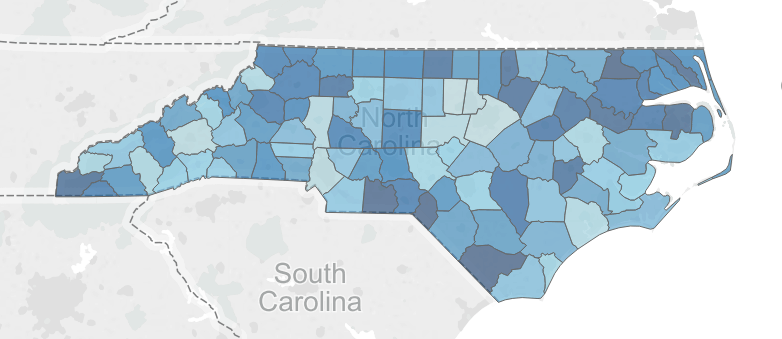
The lighter areas indicate a county where there is the greatest housing stability. Orange County is the most stable county in the state, with the most diversity in available housing and with nearly 86 percent of homeowners spending less than 30 percent of their income on housing costs. Hertford County is the lowest ranked county in terms of housing stability, with the lowest possible ranking of housing diversity and with a low housing growth/new construction rate of 0.4 percent. Explore the interactive map here.
Overall housing stability
Antoszyk then used both measures to create overall housing stability ranks for the state, by combining the “… favorable and unfavorable measures to create a map of areas for consideration that have mostly favorable and little to no unfavorable attributes.”
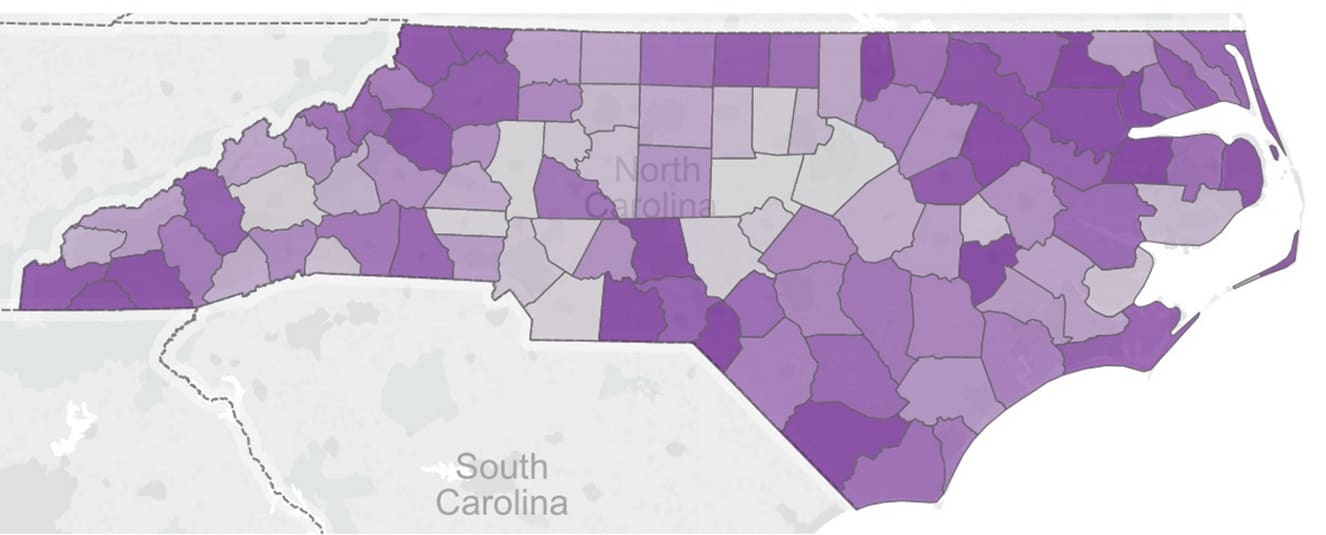
The darker areas of the map indicate a lower rank of overall housing stability; the lighter, a higher rank. According to Antoszyk’s calculations, Chatham County leads the state in housing stability with a healthy 3.3 percent housing growth rate, nearly 81 percent of homeowners spending less than 30 percent of income on housing, and a score of 97 in a ranking of the spread of home values, indicating a greater diversity in housing options for residents. In Chatham, only 9.7 percent of homes are vacant and just under nine percent of renters spend more than 30 percent of their income on housing.
At the other end of the spectrum, Hertford County ranks last in overall housing stability, with 15.5 percent of renters spending more than 30 percent of their income on housing and a vacancy rate of 17.7 percent. And, as noted above, had a low growth/new construction rate of only 0.4 percent and a low score of 10 in a ranking of the spread of home values, indicating less diversity in housing options for residents.
The reason for creating an overall housing stability map? To compare how housing insecurity might align with other measures of poverty and economic insecurity. Take for example Antoszyk’s comparison of the overall housing stability map above and her previous map of the 2013 free and reduced-price lunch rates in the state.
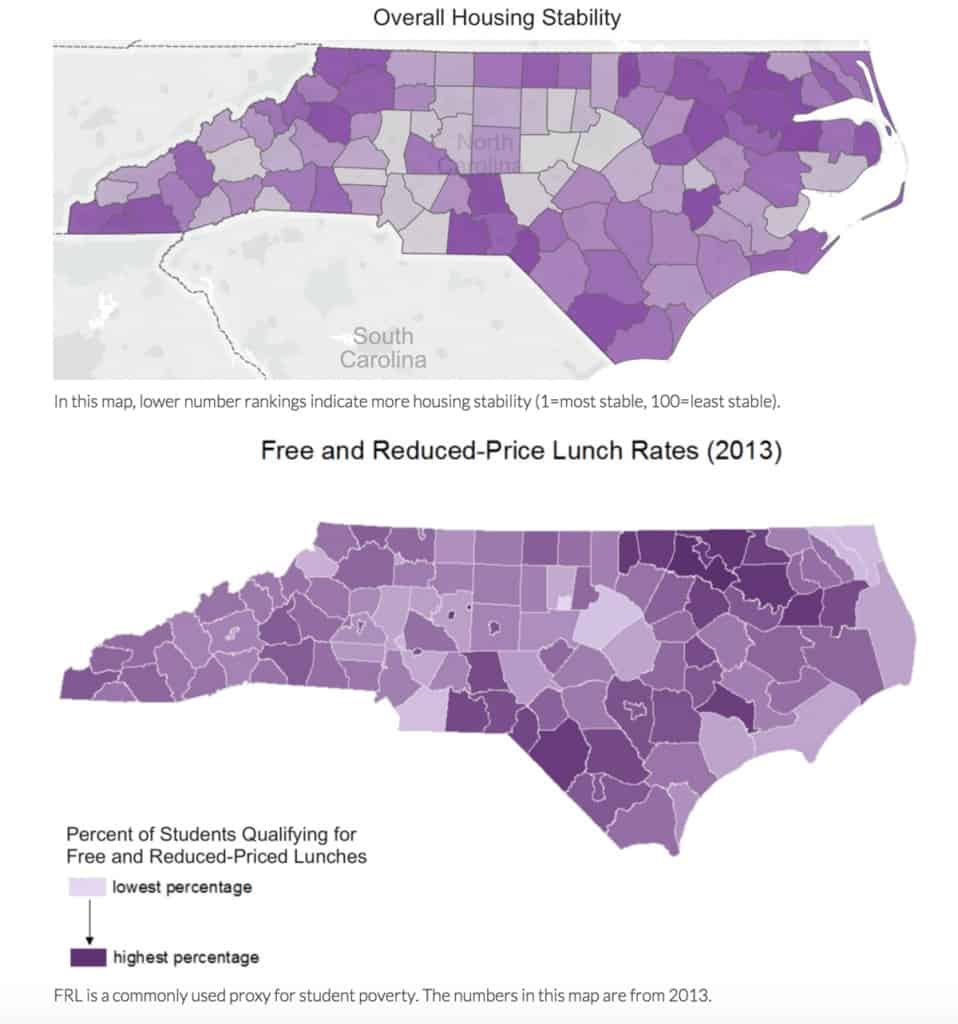
The overlap does not result in an exact 1:1 relationship, as Antoszyk notes, but the resemblance between the two measures is clear on a county-by-county level.
Why is this relevant to education policy in this state?
As Antoszyk notes in her article, housing quality can affect health outcomes, and “lower-income housing is usually segregated, and lower-income neighborhoods are also often home to lower-quality schools.”
It also means a family might be at a greater risk of eviction or foreclosure, which may “… force children to switch schools, break bonds with teachers, and, if they have to move frequently, fall behind in school.”
It is also important for informing state policy because it forces us to change our understanding of the vexing issue of poverty, to look at the issue from an interdisciplinary perspective, to consider the multiple manifestations of poverty in a child’s life and how they intersect to influence educational attainment. Antoszyk states, “The more I dive into the field, the more certain I am that the answers to the problems we face in education will be interdisciplinary.”
The maps are a reminder that we must start thinking of the problem of poverty as systemic and the effect cumulative, our collective policy responses must be nimble, flexible, and creative. Those visible and invisible burdens a child might carry into a school vary, and they may manifest in different ways and at different times.
What do these maps say to you? What other social and economic measures should be included in our state’s education policy discussion?

Recommended reading