
Editor’s note: This article mentions suicide and discusses mental health. If you or someone you know is experiencing a mental health crisis, call or text 988 or chat with the 988 Suicide & Crisis Lifeline at 988lifeline.org.
The State of the Nation Project released a new report Saturday, June 6, that takes “an honest look at our progress” toward the goals of life, liberty, and the pursuit of happiness set out by the United States’ founders nearly 250 years ago.
Based out of Tulane University, the State of the Nation Project’s bipartisan board, who authored the report, includes leaders from think tanks, universities, and advisers to the past five U.S. presidents. Last year, the project’s first report took a comprehensive look at 37 measures across 15 topics, ranging from life satisfaction to economic output.
This year, the State of the Nation’s State of the States Report examines many of these same measures in a more granular way. Researchers compiled nonpartisan state-level data from a variety of sources into individual reports for each of the country’s 50 states and the District of Columbia — providing an in-depth look at how each state is doing.
A look at North Carolina’s data
North Carolina’s report sheds light on 31 measures organized into 14 topics. In the table below, which is also available on North Carolina’s state profile, the state’s trend and rank is listed for each of the 31 measures.
Across all states and the District of Columbia, North Carolina’s average rank is No. 36.
While the “state rank” metric shows how North Carolina is doing now compared to other states — either in the top, middle, or bottom third — the “state trend” metric examines how the state is trending internally. In other words: In North Carolina, is the measure getting better, worse, or staying the same?
Over time, North Carolina has improved in eight of the 31 measures included in the report (green dots), and has worsened in 11 measures (red dots).
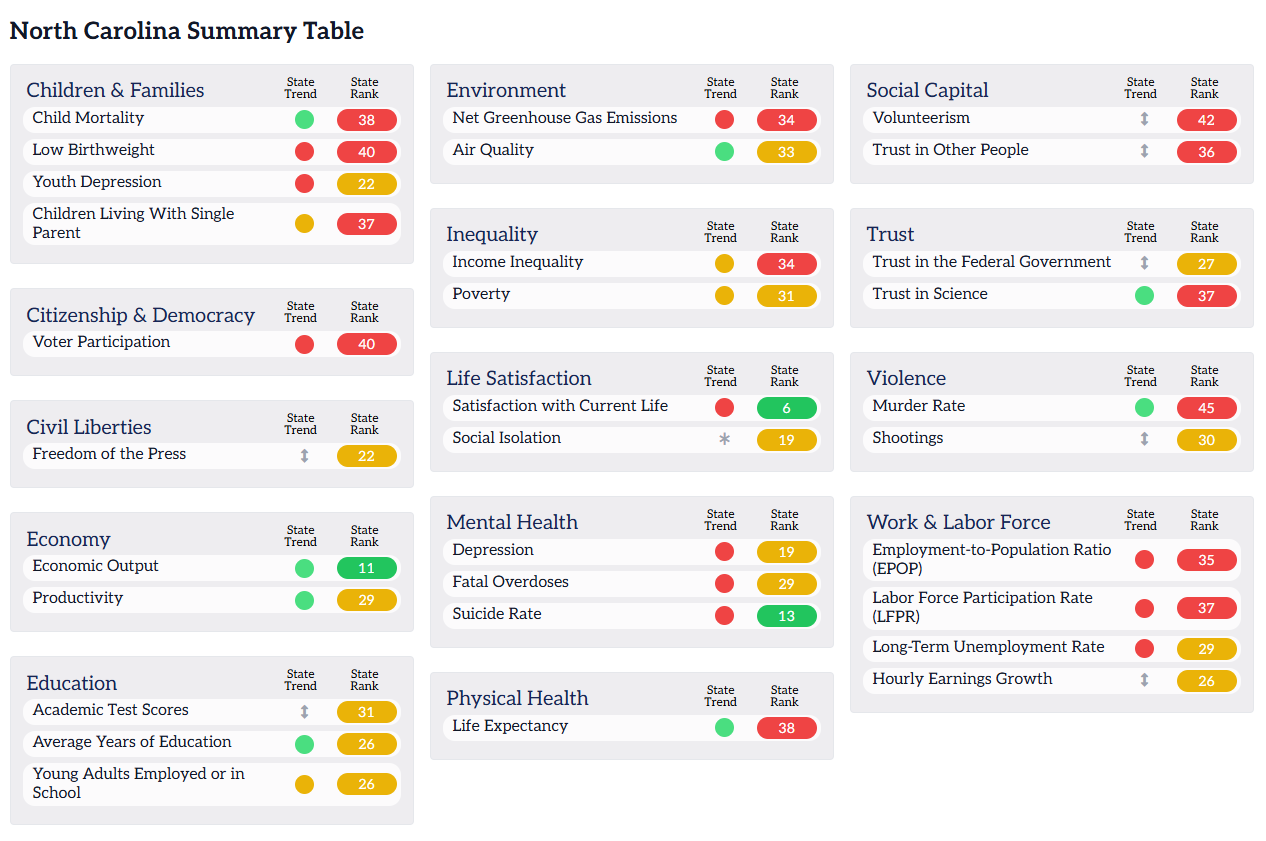
According to the state report, North Carolina ranks higher, on average, in the topics of:
- Life satisfaction (ranked No. 13)
- Mental health (ranked No. 16)
- The economy (ranked No. 19)
This means North Carolina is doing better, on average, than other states in these topics. However, as the table above shows, a higher state ranking doesn’t mean the state is trending positively in all measures within the topic.
For example, the measures under mental health — depression, suicide, and fatal overdoses — are all trending negatively in North Carolina.
On the other hand, North Carolina ranks lower, on average, in the topics of:
- Violence (ranked No. 39)
- Citizenship and democracy (ranked No. 40)
- Social capital (ranked No. 40)
![]() Sign up for the EdWeekly, a Friday roundup of the most important education news of the week.
Sign up for the EdWeekly, a Friday roundup of the most important education news of the week.
While reading test scores decline, educational attainment increases
According to the state report, North Carolina’s progress in education — measured by academic test scores, average years of educational attainment, and young adults employed or in school — is mixed. While the average number of years of education has increased over time, the percentage of young people who are either in school or employed is stable and trends in academic test scores are mixed.
Across eighth grade National Assessment of Education Progress (NAEP) scores in math, reading, and science, North Carolina ranks in the middle of the nation at No. 31.
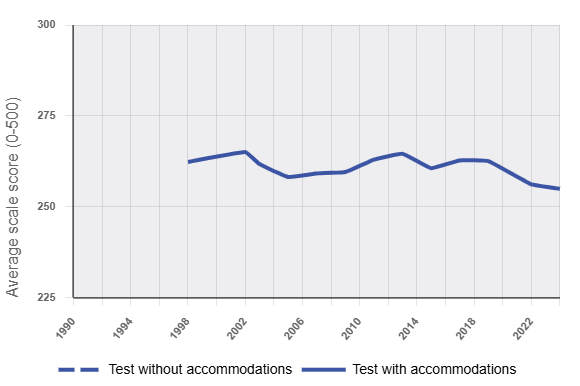
As the figures below show, over the last three decades, the state’s academic test scores show improvement in math scores but declines in reading scores.
North Carolina’s NAEP math scores have improved more than the U.S. trendline, and the state has increased in ranking compared to other states.
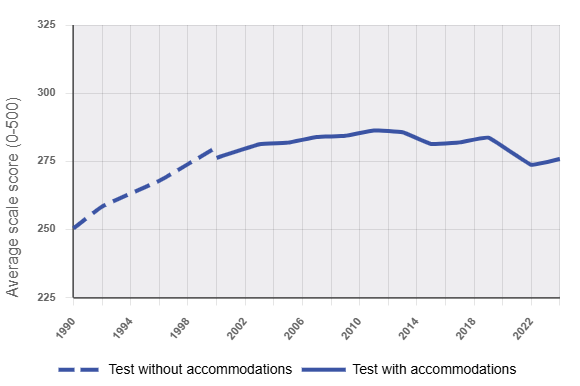
On the other hand, North Carolina’s reading scores have worsened relative to U.S. trends, and the state has decreased in state ranking.
While NAEP test scores capture students’ math and reading proficiency at a specific moment in time, average years of education might reflect broader state attitudes toward learning and work. Test scores, the report says, “only capture some of the knowledge and skills we expect of young people.”
The average years of education North Carolinians between 25 and 64 years old receive has been trending positively in the state since 2010. Overall, the state ranks No. 26, and in 2023, the average was 14.9 years of education, increasing more than the U.S. trendline, per the report.
The report also captures how the state’s young people learn and develop skills outside of formal education. Also ranked at No. 26 in the country, in 2023, 89% of North Carolinians between 16 and 24 years old were employed, in school, or both. This measure is stable and on par with the national trend.

North Carolinians are happier than those in many other states, but well-being is declining
The State of the Nation report also examines how people interact with others, their community, and their government. Taken together, these measures reveal how active North Carolinians are in their lives and the communities around them.
North Carolinians report being happier with their lives than those in most other states.
Out of all 31 measures, North Carolina ranks highest in life satisfaction at state rank No. 6. In 2024, an estimated 26% of adults in North Carolina reported being very happy with their life.
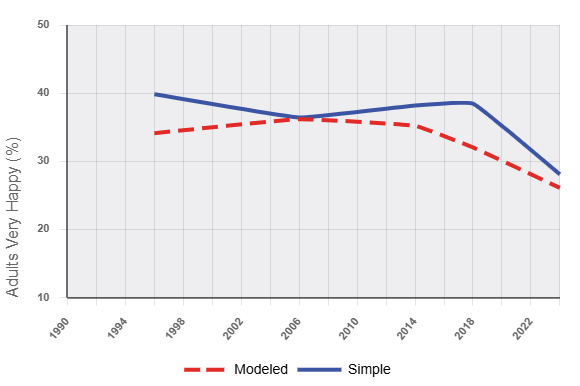
In 1996, the first year for which this data is available in North Carolina, 34% of respondents said they felt happy with their current life. This decline mirrors a national decrease in life satisfaction. While life satisfaction is declining in North Carolina, according to the report, it is declining less than the national trend.
Another measure of life satisfaction is social isolation. The report only has one data point for this measure, so trends are not available. According to this data point, in 2023, 18% of adults in North Carolina were not receiving the social and emotional support they needed sometimes, usually, or always. This places the state at No. 19 for social isolation, and below the national average of 20%.

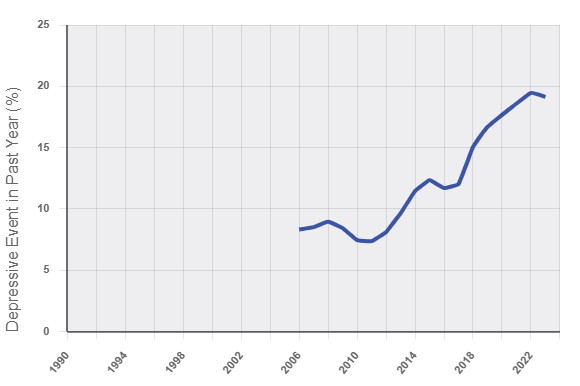
When it comes to North Carolinians’ mental health, according to the report, the state’s progress has been negative as rates of depression among people over 18 years old, suicide, and fatal overdoses are all worsening relative to the first year in which data is available for each measure.
The report also examines youth depression separately from adult depression rates. The youth depression measure examines the percentage of youth between 12 and 17 years old who experienced a major depressive episode (MDE) in the past year.
In 2023, 8.6% of adults over age 18 reported experiencing a MDE. In the same year, 19% of young people reported experiencing a MDE. Both of these measures have increased over time.
According to the report, youth depression is of “particular concern” given its ability to shape life trajectories. Depression affects almost every element of a person’s life, per the report, including their ability to enjoy relationships with friends and family and participate in school activities.
North Carolina’s trends mirror a national decline in well-being.
“Overall, we increasingly are unhappy,” reported a New York Times opinion columnist in his analysis of the report.
Read more about youth well-being


The report also classifies North Carolina’s progress in social capital as mixed. According to the report, social capital refers to “the strength and usefulness of our relationships with other people, including family, friends, neighbors, coworkers, and institutions.”
One measure of social capital is volunteerism. North Carolina ranks No. 42 in volunteerism rates. In 2023, 24.8% of North Carolina’s population ages 16 and over volunteered with an organization compared to a 28% national average.

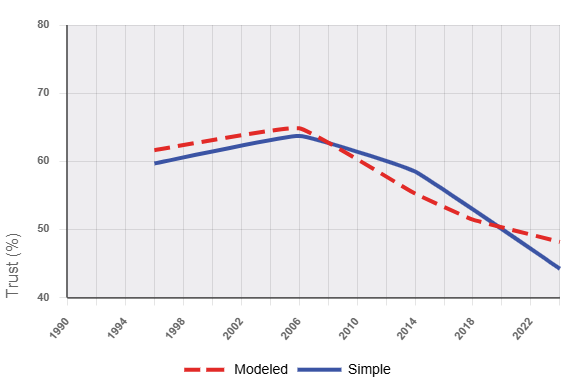
Another indicator of social capital is trust in other people, measured by the percentage of adults who say other people can generally be trusted. As the report describes, “this requires believing that others are generally honest, try to do the right thing, and do not take advantage of us.” In North Carolina, about one in four people agree with these statements, and the state ranks No. 36 in this measure.
Across congressional and presidential elections, the state ranks No. 40 in voter participation. However, participation has varied by election type. While the percentage of voting-age citizens who participate in congressional elections has declined since 1990, the percentage of voting-age citizens participating in presidential elections has increased.
Within the same time period, North Carolinians’ trust in the federal government has decreased. The report categorizes North Carolina’s internal progress in this measure as mixed because, although the state’s trust in the federal government has worsened more than the national average, the state also increased in state ranking by two or more places to No. 27.
As economic output steadily increases, the poverty rate is on the rise
While economic trends in North Carolina are positive, the data show a labor force that is not necessarily or evenly enjoying economic improvement. This trend is not unique to North Carolina, but rather reflects national trends.
As the Federal Reserve Bank of New York reports, “While many households are doing fine and economic activity overall has been expanding at a solid pace, large segments of the population are facing high levels of economic insecurity and financial strain, and consumer sentiment on the whole has dropped to low levels.”
The State of the Nation report classifies North Carolina’s progress in the economy as positive — both economic output and the productivity of the private nonfarm sector are improving.
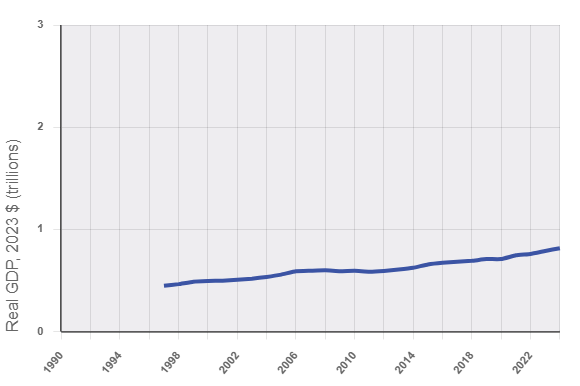
North Carolina’s gross domestic output (GDP), or the annual amount of U.S. dollars the state produces, has increased over time. The size of the labor force, the average hours per worker, and worker productivity each influence GDP.
The state ranks in the top third of states at No. 11, and compared to the U.S. trend, the state’s trendline is stable.
The other measure the report uses to measure the economy is the labor productivity of the private nonfarm sector. This data, derived from the U.S. Bureau of Labor and Statistics, indexes economic output against the number of hours worked to produce the output.
As the report puts it: “It is not just how much we produce that matters but how much time we need to put into it.”
North Carolina’s productivity is trending positively, but North Carolina has decreased in state ranking by two or more places to No. 29, and the state’s productivity trend has improved less than the U.S.
Importantly, agriculture plays a large role in the state’s economy. According to the NC Chamber, agriculture and agribusiness support as many as one in five jobs statewide, and generate over $100 billion annually.

Within measures of how economic output is shared across the labor market, data show negative trends.
According to the report, North Carolina’s progress in measures related to the work and labor force has been negative. The state’s trends in employment-to-population ratio, labor force participation rate, and long-term unemployment rate are each worsening compared to the first year for which data is available.
The employment to population ratio (EPOP) measures the percent of working-aged people who are actively employed and generating economic output. Since 1990, this percentage has declined in North Carolina while the U.S. rate has improved.
However, North Carolina’s EPOP has also fluctuated over this time period. In the last ten years, the EPOP was at its lowest in 2020. That year, 75.5% of working-aged adults were employed and contributing to the economy. Since 2020, the measure has increased — in 2024, the EPOP was nearly 80%.
Relatedly, the state’s labor force participation rate (LFPR), or the percentage of working-aged people who are either employed or looking for work, has declined since 1990 while the U.S. rate improved.
North Carolina ranks No. 35 in the EPOP, No. 37 in the LFPR, and No. 29 in long-term unemployment.

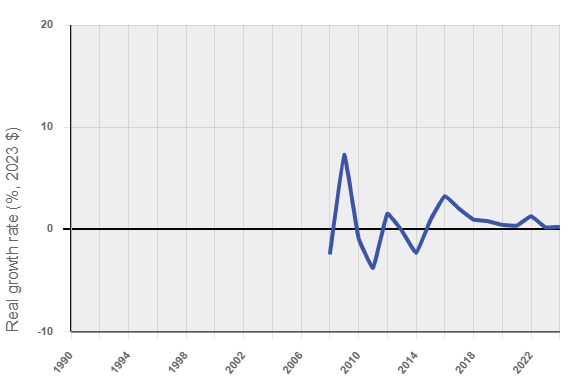
The report also measures hourly earnings growth as the year-over-year growth rate of inflation-adjusted wages, capturing the percentage change over time of how much a worker is paid per hour. Inflation-adjusted wages, the report explains, capture the ability of people living in the U.S. to pay for their needs.
According to the report, North Carolina’s trend in hourly earnings growth is neutral compared to U.S. trendline, and the state ranks No. 26 overall. In the image below, the increase between 2008 and 2009 in growth rate coincides with the last increase in state minimum wage to $7.25 per hour.
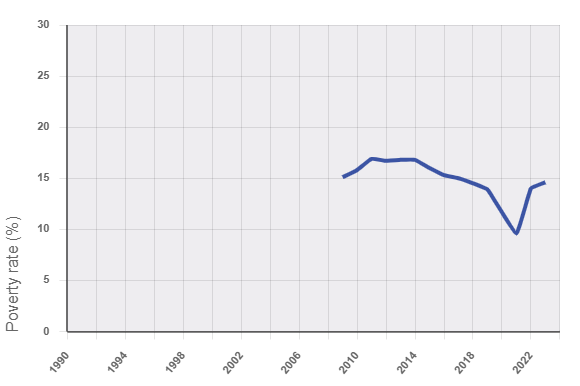
Lastly, North Carolina ranks No. 31 in poverty rate and No. 34 in income inequality.
The state’s progress in both of these measures is neutral, as rates have remained relatively stable over time, per the report.
Between 2009 and 2021, poverty rates in North Carolina overall declined from 15.1% to an all-time low of 9.6%. However, poverty rates in North Carolina have been increasing since then. In 2023, the poverty rate in North Carolina climbed to 14.6% — the highest this measure has been since 2017.
The authors measured income inequality using the Gini coefficient, which examines the extent to which income is concentrated within certain groups between zero and 100. A higher number indicates greater income inequality. In 2023, North Carolina’s score was 47.6. This is an increase from 2010, when the state scored 46.3, but a slight decrease from 47.7 in 2022.
While ranked in the bottom third of states, the report concludes that North Carolina’s trend in income inequality is worsening less than the U.S. trend.
Five themes from the state of the states
In the executive summary of the State of the Nation Project’s report, authors frame the data in North Carolina and the other state reports as a way to inform answers to two critical questions: “If we ever hope to find real solutions, then we have to start from the beginning and ask, how are we doing? Then, we can move on to, how do we get better?”
Five themes, listed here as they appear in the executive summary, emerged from the data:
- Geography matters, but it’s not destiny.
- No state is improving on an alarming number of measures.
- States are becoming more alike in most ways — but growing further apart on the measures that may be fueling our divisions.
- Only a handful of states are improving on any measure of self-reported well-being.
- A stronger economy does not seem to improve personal well-being — but it may build social trust.
According to this year’s report, the authors’ purpose in creating the State of the Nation Project was threefold.
First, to test whether there is “more underlying unity than today’s media and political discourse would have us believe.” Second, to address the authors’ concern over pessimism, distrust, and misinformation. And third, to measure progress on people’s right to enjoy life, liberty, and happiness.
In this second annual report, in honor of the nation’s 250th anniversary, we focus on the fact that we live in the United States of America. We always have been, and remain, a nation of states, a laboratory of democracy in which state achievements ebb and flow and where we watch and learn from our neighbors.
— State of the States Report, Executive Summary
Read more about these conclusions and explore state data here.
Behind the Story
The State of the Nation Project served as the data partner for this article and provided EdNC with access to the data behind the State of the States Report. Learn more about the State of the Nation Project here.

Recommended reading