How do NC counties compare on their ability to fund schools?


The Public School Forum of North Carolina recently released its annual Local School Finance Study, which highlights trends in local spending in public schools across North Carolina’s 100 counties. The most recent study was based on data from the 2020-21 school year.
The report reveals significant disparities in counties’ ability to allocate funds toward public schools.
“The Local School Finance Study highlights variations and trends in local spending for public education across North Carolina’s 100 counties in order to examine school districts’ funding capacity and effort, which can vary vastly,” Chanté Russell, communications analyst for the Forum, said. “School funding is a major factor when it comes to education equity, so this data is vital in tracking progress and needed improvements.”
The study focuses on the amount counties spend on schools as well as each county’s investment relative to their taxable resources, the Public School Forum said in a press release.
Below is a look at the study’s major findings.
Local teacher salary supplements
In North Carolina, teacher salaries are funded by both the state and the local district. The state is required to contribute a set amount of funds to each teacher’s salary. But, the differences in property tax bases across counties in the state result in a wide variety in the amount each district is able to contribute toward supplementing teacher pay using local tax dollars.
More urban counties often have wealthier property tax bases and are therefore able to contribute more toward teacher pay supplements compared to less urban counties with smaller tax bases. In turn, higher-wealth districts with more competitive teacher salary supplements are more likely to attract teachers.
The Public School Forum reports that this gap between more and less affluent districts has continued to widen over time, stating, “We have also found that lower wealth counties tax themselves at higher rates than wealthier counties, but are still unable to generate comparable tax revenue to wealthier counties that make less taxing effort.”
The last biennium budget, passed in the General Assembly in 2021, allocated $100 million to help local districts supplement how they pay their teachers. That number increased to $170 million in 2022. EdNC reported on the significance of this state-funded teacher salary supplement, which you can read more about here.
The Local School Finance Study found that in 2020-21, before the state-funded teacher salary supplement went into effect, Wake County offered teachers an average salary supplement of $8,873, whereas the average salary supplement in Cherokee, Graham, Swain, and Caswell counties was $0.
The additional state funds allocated in 2021 were meant to account for those cross-county differences, which is why the funds were not allotted to Wake, Durham, Buncombe, Mecklenburg, or Guilford counties, which historically have a greater ability to supplement teacher pay using local tax dollars.
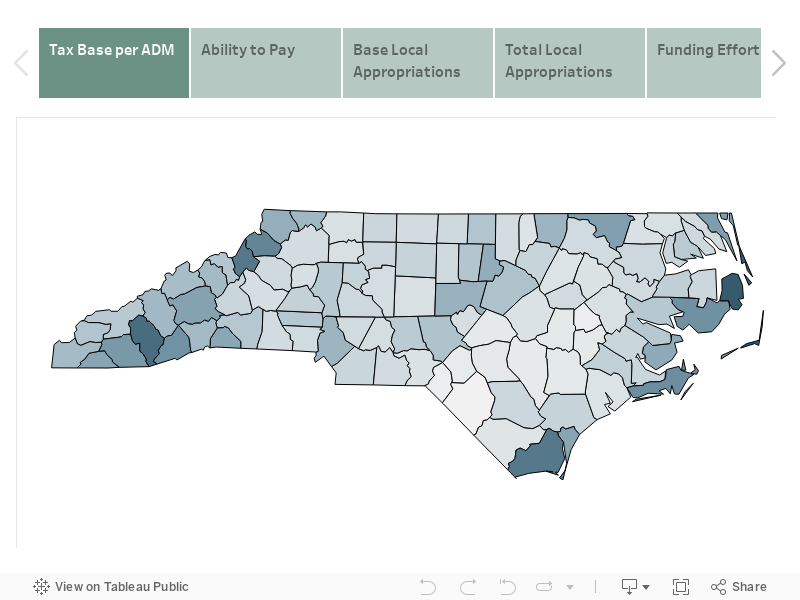
If you scroll down to the bottom of the Local School Finance Study, you will find a map of the state that represents each county’s average teacher salary supplement, teacher vacancy rates, and teacher attrition rates for the 2020-21 school year.
The release of this study comes ahead of this year’s budget-making process. Gov. Roy Cooper released his budget proposal this week, which called for 16% raises for teachers, and the House and Senate budgets are expected to come next.
Local spending per student
The Local School Finance Study also found that “there are significant disparities in the ability of counties with different levels of wealth to provide their schools with the resources they need.”
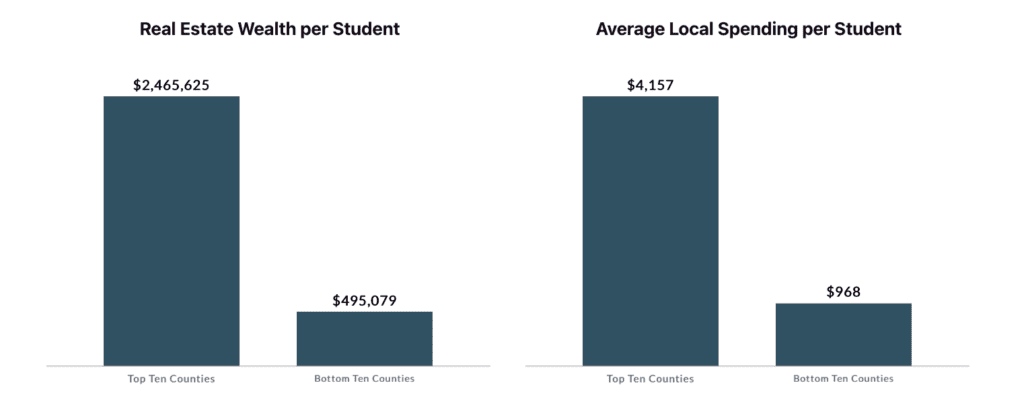
The report found that in 2020-21, the 10 counties with the highest average local spending per student contributed $3,189 more per student than the bottom 10 counties.
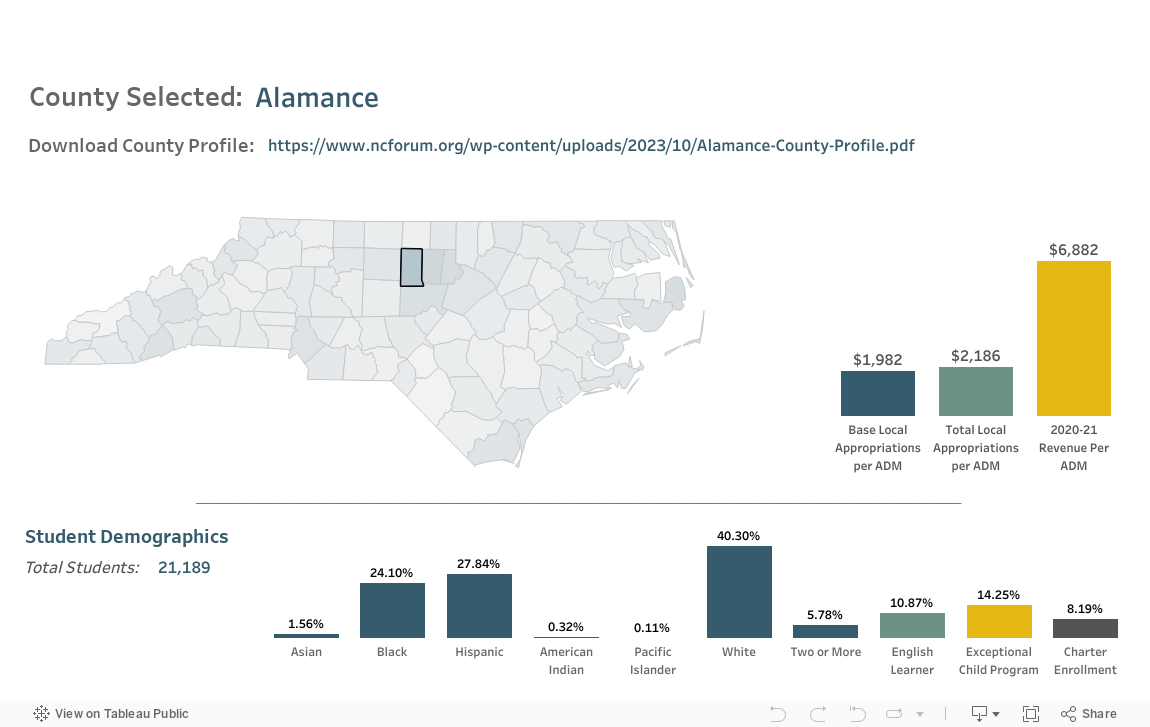
Below are the funding profiles for each county in the state, which include student demographics, base local appropriations per average daily membership (ADM), total local appropriations per ADM, and the 2020-21 revenue per ADM. You can click the link to download a PDF file of the county’s profile.
Below is the local school finance data and rankings for each county in the state based on their 2023 property value, 2023 base local appropriations, 2023 total local appropriations, 2023 ability to pay, and 2023 funding effort.
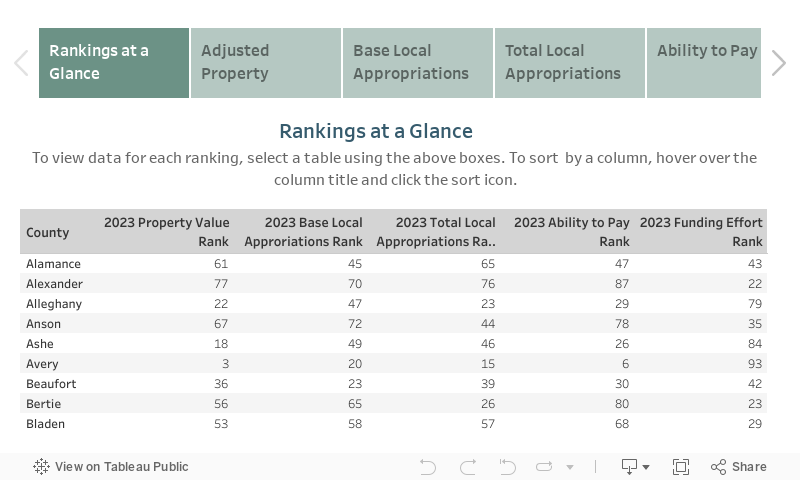
The ability to pay is “a measure of a county’s per student fiscal capacity to support public schools.” The Local School Finance Study found that “large, urban counties combining high adjusted property valuations with broad-based economic activity and high per capita incomes tend to rank highest on this measure.”
Here are the top five counties ranked by ability to pay:
- Dare County
- Brunswick County
- Carteret County
- Avery County
- Watauga County
Here are the bottom five counties ranked by ability to pay:
- Greene County
- Robeson County
- Hoke County
- Scotland County
- Sampson County
Funding effort is a measure that “compares a county’s base local appropriations and revenue per student.” The Local School Finance Study found that “low-wealth counties with comparatively high spending levels tend to rank highest in this measure.”
Here are the top five counties ranked by funding effort:
- Scotland County
- Orange County
- Cleveland County
- Halifax County
- Sampson County
Here are the bottom five counties ranked by funding effort:
- Swain County
- Dare County
- Jackson County
- Clay County
- Carteret County
Editor’s note: This article was updated with additional information about the local salary supplement.