
The inspiring teacher who transforms the life of a student is a powerful, recurring narrative in popular entertainment, largely because it is a story that rings true for so many people. It rarely takes much prompting for people from all walks of life to offer readily stories of how a dedicated teacher helped them to see the world in new ways, broadened their sense of life’s possibilities, and imparted the knowledge needed to pursue their dreams. Such stories are highly individual in nature, but their collective effect is anything but.
Just imagine how many hundreds, if not thousands, of children a skilled teacher might inspire during a long career.
Lost in the personal stories of how dedicated teachers enrich their students is this question:
How do such teachers even wind up in North Carolina’s classrooms?
In school year 2015-16, according to the N.C. Department of Public Instruction, some 94,000 men and women worked as full-time classroom teachers in the state’s 2,400 traditional public elementary and secondary schools.1 As with any workforce, this teacher corps is dynamic, with new people entering annually, as others leave for assorted reasons. A major — if majorly underappreciated — managerial task, then, is recruiting and retaining adequate numbers of skilled teachers.
This summer, we ran across Steve Lassiter, North Carolina’s former state principal of the year, and now an assistant superintendent in the Elizabeth City-Pasquotank County Schools. When Lassiter arrived to his new job, the district had allocated $3,000 for teacher recruitment. Lassiter says he needed more like $30,000. He then recruited teachers from Ohio, Pennsylvania, Delaware, and various universities throughout North Carolina, and now with the new school year just starting, 95 percent of the district’s teaching positions are filled.
When staffing classrooms, principals and district administrators like Lassiter must navigate multiple factors, many of which are beyond their control. The number of teachers needed in any given year, for one, hinges on a mix of growth in the student population, policy choices about class sizes, and teacher turnover. Meanwhile, the state legislature controls most major compensation decisions. And, as place-bound organizations, local schools often find their hiring possibilities shaped by the relative attractiveness of their geographic locations and student bodies. Administrators furthermore must determine how best to staff critical shortage fields in special education, mathematics, and the sciences, while building workforces representative of their communities.

A total of 94,421 women and men worked as full-time classroom teachers in the state’s traditional public schools in school year 2015-16.2 Of every 100 of teachers, 53 taught primarily in elementary schools, 30 in secondary schools, and 17 in both types of schools.3
When broken out by gender, women accounted for 80 percent of all classroom teachers in school year 2015-16, including 89 percent of all elementary school teachers.4 Some 53 percent of male educators, meanwhile, taught in secondary schools, but even there, they accounted for a little more than a third of all teachers.5 Note how the gender composition of North Carolina’s teacher corps mirrors the national one. In 2011-12, the latest year with data, the Schools and Staffing Survey, a representative survey sponsored periodically by the U.S. Department of Education, found that women accounted for 76 percent of all traditional public school teachers.6
In terms of race, 81 of every 100 teachers in school year 2015-16 were white, with African-American teachers accounting for 14 of every 100 teachers.7 Compared to the nation as a whole, North Carolina has a more diverse teacher workforce thanks to its percentage of African-American educators. According to the Schools and Staffing Survey, in contrast, African-American educators accounted for just seven of every 100 public school teachers in 2011-12.8
On this point, better than the nation is not nearly good enough. “The teacher workforce remains overwhelmingly white,” according to a 2016 report by the Hunt Institute, which examines the diversity gap and the need for a solution to bring more minority candidates into the teaching profession.
The age structure of North Carolina’s classroom teachers, meanwhile, is broadly consistent with the national one. The 2011-12 Schools and Staffing Survey found that half of all public school teachers in North Carolina were younger than age 40, half older; the national median age, in comparison, was 41 years of age.9 That same year, the age distribution of North Carolina’s teachers broadly mirrored the national one: 19 percent of the state’s teachers were younger than the age of 30, while 52 percent were between the ages of 30 and 49; another 11 percent were between the ages of 50 and 54, and 17 percent were age 55 or older.10
In terms of educational credentials, the N.C. Department of Public Instruction reported that 73 percent of the state’s classroom teachers in school year 2015-16 possessed a bachelor’s degree as their highest educational credential, with another 26 percent holding a master’s degree.11 Compared to the nation as a whole, North Carolina teachers appear more likely to hold a bachelor’s degree as their highest degree and less likely to have earned a master’s degree.12
Pulling the characteristics together, then, the typical classroom teacher in North Carolina is a white woman between the ages of 30 and 54 who holds a bachelor’s degree as her highest educational credential. Of course, the makeup of the teacher corps varies from one school district to another. Appendix 1 presents selected data for each of the state’s 115 public school districts.

Individuals with minimal or no prior instructional experience who wish to teach in one of North Carolina’s public schools must earn a Professional Educator’s Initial License.13 The traditional manner for doing so is by completing a state-approved teacher education program offered at an accredited college or university. Aspiring teachers who studied at an accredited college or university in another state may obtain an initial North Carolina license upon satisfactory completion of the relevant licensure examinations. Despite the emergence of such other initial pathways as lateral entry programs and Teach for America, completing an in-state teacher education program remains the primary pathway into North Carolina’s classrooms.
A 2016 study by the Education Policy Initiative at Carolina, a research program housed at the University of North Carolina at Chapel Hill, found that the University of North Carolina system was the primary source of the 18,065 first-year teachers employed in the state between school years 2011-12 and 2013-14.14 Of every 100 first-year teachers, 43 had graduated from the University of North Carolina system, 12 from a private in-state college or university, and 26 from an out-of-state college or university; another 18 had entered the classroom through a lateral or alternative entry program. See Appendix 2 for a breakdown by school district, which allows you to begin to see how districts build their own pipelines; for example, districts that rely heavily on Teach for America.
A detailed study of the 25,541 graduates who received their initial preparation through the University of North Carolina system between 2005-06 and 2012-13 revealed that East Carolina University and Appalachian State University were the largest producers of teachers, with each school accounting for 16 percent of the total.15 The next largest source was the University of North Carolina at Greensboro (13 percent), followed by the University of North Carolina at Charlotte (12 percent). Collectively, the state’s five historically black universities and one historically Native American university prepared 13 percent of all graduates, with those graduates being more likely than their peers to take a first teaching job in a high-needs school.
In terms of licensing, 42 of every 100 graduates from the University of North Carolina’s teacher preparation programs between 2005-06 and 2012-2013 were licensed initially as elementary school teachers; the next largest licensure category was social studies, in which 10 of every 100 graduates were trained. Meanwhile, 12 of every 100 graduates received their initial licensure in the statewide shortages areas of mathematics and science education, with six of every 100 having trained for a career in the shortage area of special education.
Graduates of the University of North Carolina’s teacher preparation program are highly likely to teach in the state. Of the students who graduated between 2005-06 and 2012-13, two-thirds, on average, were teaching in a North Carolina school within a year of graduation, and, on average, three-fourths were in one of the state’s classrooms within three years of completion.
Recognize that more recent placement rates were negatively affected by the “Great Recession” — between school years 2008-09 and 2009-10, the state reduced its teaching workforce by 4,000 individuals, while also hiring 3,000 fewer first-year teachers for the 2009-10 school year than had been the case prior to the downturn.

As with any workforce, North Carolina’s traditional public school teaching corps is not static, as people regularly leave the classroom for any number of personal and professional reasons ranging from retirement to family relocation to job dissatisfaction. Regular turnover in any organization is inevitable and in some respects desirable, but understanding the exact mix of factors that lead people to stop teaching is essential for the effective management of the teaching corps.
North Carolina General Statute 115C-12(22) requires the State Board of Education to prepare an annual report on the state of the teaching profession — a report that must include a detailed analysis of teacher turnover. In the most recent report, which was based on data for school year 2015-16, two intertwined concepts were used to measure changes in the employment status of teachers:
Attrition is a reduction in the number of teachers that occurs when a teacher leaves employment in one school district in North Carolina without moving to another in-state district; attrition is measured for the state and for individual school districts.
Mobility is the relocation of a teacher from employment in one school district in North Carolina to another one; mobility is measured only for individual school districts.16
Realize that a teacher who moves from one district in North Carolina to another one in the state would be counted as a loss through attrition by the original school district. From the perspective of the state, however, no attrition occurred since the teacher was still in a North Carolina classroom; the teacher simply was mobile, moving from one district to another.
Total turnover, then, may be conceptualized as the sum of teacher attrition and teacher mobility over a span of time. The N.C. Department of Public Instruction’s recent study measured the two components of turnover by comparing payroll records from March 2016 to those from March 2015. A teacher who appeared on the payroll of a particular school district in March 2015 but not in March 2016 was categorized as “attrition,” while a teacher who appeared on the payroll of a school district in March 2016 different from the March 2015 one was categorized as “mobility.” The rationale is that, while a school district lost a classroom teacher, the state as a whole did not.17
Teacher turnover in North Carolina, 2014-15 to 2015-16
According to the N.C. Department of Public Instruction, a total of 95,549 classroom teachers were employed by the state’s 115 school districts in March 2015. Of those individuals, 86,913 were still teaching in a North Carolina public school one year later, which translates into a loss by attrition of 8,636 teachers over the course of the year, an attrition rate of 9 percent.18 Put differently, 91 of every 100 public school teachers employed in North Carolina in March 2015 were still teaching in one of the state’s public school classrooms one year later.
The annual study of the teaching profession mandated by N.C.G.S. 115C-12(22) also requires an analysis of the reasons why teachers leave the profession. Based on information drawn from each school district’s human resource records, the latest study identified 28 reasons why teachers stopped teaching and grouped those reasons into five broad categories:
Left School District, Still in Education: teachers who left a public school district to take another education position in the state, such as an administrative role or a teaching position in a private, parochial, or charter school in North Carolina.
Left for Personal Reasons: teachers who left a public school district for a personal or family reason (such as a re-location, childcare or eldercare, ill health, or disability), a decision to teach in another state, or dissatisfaction with the teaching profession.
Terminated by School District: teachers who left a public school district due to a contract expiration, a contract non-renewal, a dismissal for cause, or a similar reason.
Left for Reasons beyond the School District’s Control: teachers who left a public school district for a reason such as retirement, downsizing, death, or the completion of a term commitment (e.g., Teach for America).
Left for Other Reasons: teachers who left a public school district for any other reason.
As mentioned previously, a total of 8,636 teachers left the classroom entirely between March 2015 and March 2016. Of every 100 teachers who left, 53 stopped teaching for a personal reason, 24 for reasons beyond the control of the local school district, eight for reasons initiated by a local school district, eight for different educational work in the state, and seven for other reasons.19
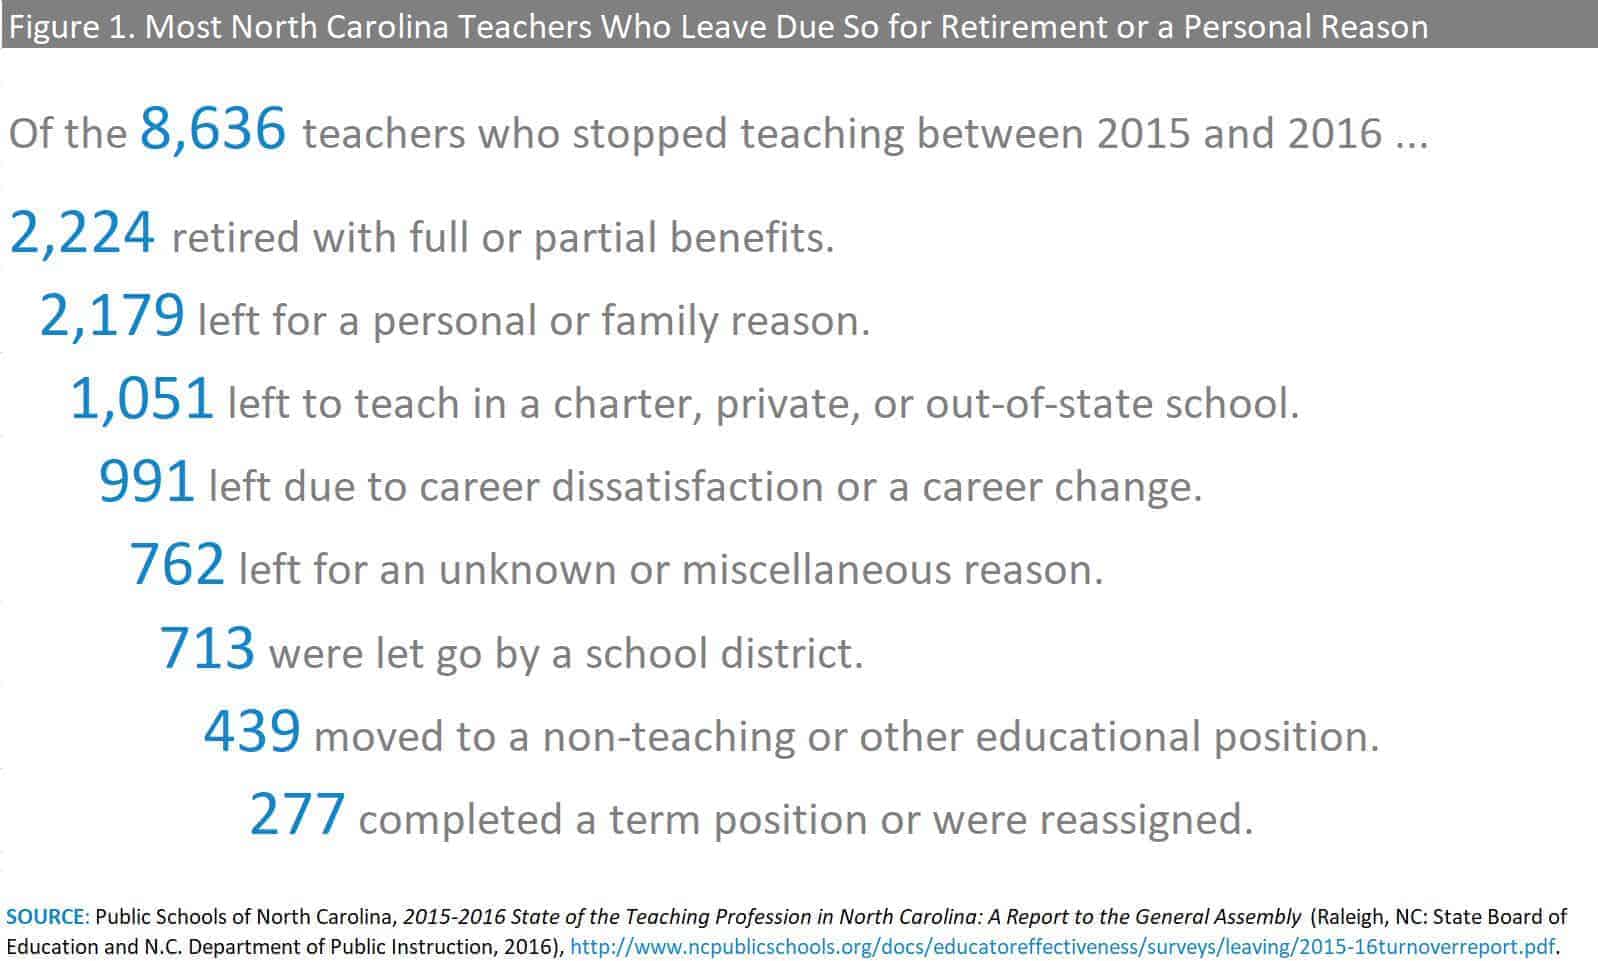
When it comes to specific reasons for leaving, the single largest one, as shown in Figure 1, was retirement with full or partial pension benefits, which was the reason stated by 2,224 teachers, or 26 percent of all leavers.20 The next most commonly stated reason was a personal or family one, which applied to 25 percent of all leavers, or 2,179 teachers. Potentially more alarmingly, a decision to teach in a charter, private, or out-of-state school led 1,051 teachers, or 12 percent of all leavers, out of the classroom. Of even more concern was the fact that career dissatisfaction or a desire to change careers led 11 percent of all leavers, or 991 people, to stop teaching.
Further analysis of the data reveals another 4,163 classroom teachers left a teaching position in one North Carolina school district for a job in another North Carolina school district, resulting in a statewide mobility rate of 4 percent. Combining the 8,636 teachers who left the public schools altogether with the 4,163 individuals who switched districts, then, results in a total of 12,799 teacher changes between March 2015 and 2016, which yields a turnover rate of 13 percent.21 In short, 13 of every 100 teachers working in North Carolina’s public schools in March 2015 were either no longer teaching or teaching in a different school district one year later.
Who leaves North Carolina’s classrooms? An analysis of attrition rates
North Carolina teachers may have an overall attrition rate of 9 percent, but that statewide figure masks important differences in which segments of the teaching corps leave and why they do so. Attrition rates, notably, are higher for beginning teachers than for more experienced ones.
Of the 95,549 classroom teachers employed in the state’s 115 school districts in March 2015, 17,618 — or 18 percent — were beginning teachers, meaning those with fewer than three years of classroom experience.22 One year later, 15,366 of those beginning teachers were still in a North Carolina classroom, which translated into a decrease of 2,252 teachers, or 13 percent. In contrast, the attrition rate among experienced teachers was 8 percent, with the rate generally falling with experience until increasing again among teachers with 25 or more years of service.23
Even among beginning teachers, attrition rates vary. Some 16 percent of lateral entry teachers, for instance, left the classroom between March 2015 and March 2016, as did 33 percent of individuals connected to the Teach for America program and 18 percent of participants in the Visiting International Teachers program. Given that positions in programs like Teach for America are term-limited in nature, however, a high attrition rate is not surprising, especially for teachers in the final year of a two- or three-year commitment.
When it comes to instructional effectiveness, the teachers who left North Carolina’s classrooms between March 2015 and March 2016 generally posted lower scores, as measured by the state’s Education Value-Added Assessment System, than did teachers who remained, even after controlling for such factors as years of experience.24 Similarly, teachers who receive a score of “below proficient” on the pedagogy standard of the N.C. Educator Effectiveness System, an observational model of teacher evaluation, were more likely to leave the classroom.25 Neither relationship is causal; nevertheless, the observed relationships raise important managerial questions about how best to identify and retain effective educators.
Just as attrition rates vary for different types of teachers, so do their reasons for leaving. Teachers within the first five years of their career in North Carolina are more apt to leave to take a position in an out-of-state school or to change careers entirely. In fact, of the 828 teachers who left North Carolina’s public schools to teach in another state, 453 — or 55 percent — were teachers within their first five year of teaching; similarly, 48 percent of the teachers who left to change careers entirely were within their first five years of teaching.26 At the other end of the spectrum, the most experienced teachers are the ones most apt to retire with pension benefits.
Historical and national comparisons
Recent methodological changes made by the N.C. Department of Public Instruction prevent the comparison of the turnover information contained in the most recent report on the state of the teaching profession to the historical data compiled to satisfy North Carolina General Statute 115C-12(22). Yet the broad patterns are similar, even if the numbers are not comparable.
In general, North Carolina enjoys relatively low statewide attrition rates, with the vast majority of teachers returning to the classroom from one year to the next. Attrition rates, however, are much higher for teachers at the beginning of their careers than for those deeper into their careers. And when it comes to specific reasons for leaving, the three most-cited ones are retirement, family relocation, and career dissatisfaction and/or change.27
Comparisons of state-level data also are difficult to draw, given the wide discrepancies in how individual states collect, code, and report the relevant data. A recent study by the Learning Policy Institute, a nonprofit organization in California, estimated a national attrition rate — defined as the share of teachers who left the profession entirely — of 8 percent. Individual state rates ranged from a high of 19 percent in Arizona to a low of 5 percent in Illinois, with North Carolina having an estimated attrition rate of 6 percent.28 When combined with educators who remained in the classroom but moved schools, the national turnover rate equaled 14 percent; individual state rates ranged from a high of 24 percent in Arizona to a low of 7 percent in Rhode Island, with North Carolina having an estimated turnover rate of 17 percent.
By some measures, national attrition and turnover rates have increased since the late 1980s, though the exact reasons for the increases are debatable.29 Demographic factors play a role, as the large cohort of teachers born during the postwar “Baby Boom” has begun to reach retirement age. Yet even today, just a subset of teachers cites a desire to retire as a primary reason for leaving the classroom. Instead, some 55 percent of teachers who leave the profession entirely cite dissatisfaction with the profession and/or their working conditions (e.g., lack of administrative support, accountability systems) as a primary reason for leaving.30
The exact impacts of attrition and turnover vary among states, school districts, and schools. High-need schools, for one, tend to have high rates of turnover, resulting in many of the students with the greatest educational needs being taught by the least-experienced teachers.31
Similarly, turnover imposes costs in time and money on school districts, while increasing the number of new hires required annually. Reducing attrition and turnover rates therefore is a powerful tool for mitigating teacher shortages and managing administrative costs.

The overwhelming majority of North Carolina’s public school teachers — 87 of every 100 — worked in the same district in March 2016 as they did one year earlier.
Although seemingly modest, statewide rates of attrition, mobility, and total turnover mask important local differences in the abilities of school districts to staff adequately their classrooms.
Appendix 3 presents detailed turnover data for each of North Carolina’s 115 local school districts between March 2015 and March 2016. After combining attrition and mobility, district-level turnover rates ranged from a high of 35 percent in the Halifax County Schools to a low of 5 percent in the Avery County Schools.32
In all, 56 of 115 school districts (49 percent) had turnover rates in excess of the statewide figure; of those districts, 11 had turnover rates of 20 percent or higher, meaning that one of every five teachers employed in March 2015 was no longer there a year later. And in both the Halifax and Northampton County Schools, at least one of every three teachers left over the course of the year.33
District-level turnover data reveal distinct regional patterns. In general, turnover rates are considerably lower in Western North Carolina than in the state as a whole. Between March 2015 and March 2016, the five districts with the lowest turnover rates were in Western North Carolina; in each of the Avery, Surry, Mitchell, Ashe, and Yadkin County Schools, at least 93 of every 100 teachers remained in the classroom. At the other end of the spectrum, three of the five districts with the highest turnover rates — the Halifax, Northampton, and Hoke County Schools — were in Eastern North Carolina, as were 15 of the 20 highest-turnover districts.
Interestingly, the most recent N.C. Department of Public Instruction study on the state of the teaching profession did not find strong associations between a district’s turnover rate and its designation as a low-performing district. Of the 10 school systems classified as low-performing districts based on data for school year 2015-16, three had attrition rates well above the statewide figure, but two had attrition rates well below the statewide average, with the remaining five districts posting rates similar to the statewide one.34
Any number of factors influence turnover at the regional and school-district levels. School districts with effective management and strong organizational cultures, for instance, may succeed in retaining teachers regardless of the district’s socioeconomic realities. Alternately, districts with teaching corps that are disproportionately older may experience high levels of retention as the practical and personal barriers to switching jobs likely are higher for older teachers than for younger ones. And school districts that invest time and money in mentoring and developing young teachers may have less turnover among that volatile cohort. A relative lack of job opportunities in economically distressed communities, meanwhile, may lead teachers to hold onto some of the better jobs that may exist locally. Although the exact mix of factors varies, understanding the local mix is essential to managing the teaching corps.
To manage turnover, school districts rely on three broad strategies. First, districts can hire new beginning teachers and attempt to develop their professional skills in the hope of retaining them over time. Second, districts can attempt to hire educators from other states or bring new people into teaching via lateral entry and alternative certification programs. Yet a downside inherent to these strategies is that they generally result in the replacement of more experienced teachers with less experienced ones, and as research suggests, teacher experience matters. Consider how a 2016 study by researchers at Duke University’s Sanford School of Public Policy found a significant positive, increasing relationship between teacher experience and the test scores posted by middle-school students in North Carolina, along with lesser — but still positive — effects on behavioral problems like absenteeism.35
Lastly, districts can undertake teacher recoupment, defined as the recruitment of experienced teachers from other in-state districts. The viability of teacher recoupment strategies, however, hinges on a mix of practical factors. Based on data from the N.C. Department of Public Instruction, the districts with some of the highest recoupment rates between March 2015 and 2016 were relatively small ones with few teachers to replace (Appendix 3). For instance, the two districts with the highest recoupment rates — the Elkin City and Tyrell County Schools — had to replace eight and 10 teachers, respectively. Larger districts facing more significant socioeconomic challenges, meanwhile, struggled to recoup their losses. In the Halifax County Schools, for one, recoupment offset just five of the 76 teachers lost from 2015 to 2016.36
A reliance on recoupment strategies to offset teacher turnover is a double-edged sword. Successful districts are able to replace their losses with experienced teachers, yet the fact that these teachers are coming from other in-state districts may create problems elsewhere. In that sense, recoupment strategies may benefit individual districts without addressing — or possibly even compounding — statewide problems in classroom staffing.

At first glance, teacher turnover in North Carolina seems to be relatively manageable. Of the 95,549 teachers employed in the state in March 2015, some 82,750 were teaching in the same school district one year later, while another 4,136 teachers remained in the classroom, though in different districts. And of the 8,636 educators who stopped teaching entirely, 1,710 left for the understandable reason of retiring with full benefits. That left 6,926 people who left for a reason that better policy or management might have had a role in addressing. Given the size of the teaching corps, that number — a number equal to 7 percent of all leavers — may seem reasonable.
Viewed in another light, however, teacher turnover is an important managerial and policy challenge that requires statewide attention for at least three reasons. First, reducing turnover, especially the component caused by attrition among teachers early in their careers, can reduce the time and money spent on recruiting. For example, retaining the 453 beginning teachers who left to teach in another state between 2015 and 2016 by itself would have lowered the turnover rate by 0.5 percentage points. Similarly, retaining the 411 beginning teachers who stopped teaching to change careers would have offset roughly of all the teachers lost through attrition in the Durham and Buncombe County Schools between 2015 and 2016.37
Reducing turnover also matters since the overall growth in the state’s student population is increasing the annual need for teachers. According to the N.C. Office of State Budget and Management, the number of children between the ages of 5 and 17 is projected to rise by 8 percent between 2016 and 2036, climbing to 1.6 million from 1.4 million.38 That translates into an average annual gain of roughly 6,000 new students. Assuming a pupil-to-teacher ratio of 15.4 and holding all else constant, the addition of 6,000 students in a year could require the hiring of 390 additional teachers across North Carolina, before even considering the hiring needed to replace teachers lost due to attrition.39
Lastly, managing turnover effectively matters for instructional reasons. As noted earlier, research findings suggest that teacher experience can have a positive impact on both student test scores and certain behavioral outcomes. Research also shows that, not surprisingly, beginning teachers often are less effective than are their more experienced peers. Meanwhile, less-resourced districts often struggle with turnover more than better-resourced ones do (especially when better-off districts hire teachers away from less-advantaged ones), which often leads less-advantaged communities to rely disproportionately on beginning teachers who may not have the same positive effects on student outcomes. And when less-advantaged districts are attended primarily by students of color or those living below or near the poverty level, such staffing patterns may raise troubling questions about educational equity.
National research suggests that there is no one formula for minimizing teacher turnover, especially among educators who leave early in their careers. Yet thinking about turnover only when an individual teacher departs is too late.
Districts and policymakers must think instead of turnover holistically, beginning from when a young adult enrolls in a teacher education program and continuing through that person’s initial entry into the profession, the formative early career years, the prime-working years, and the pre-retirement period.
To that end, policymakers and local educational leaders need to think systematically about five sets of issues: 1) salaries and compensation; 2) teacher preparation and entry; 3) hiring and personnel management; 4) induction and early-career support for teachers; and 5) working conditions.40

As any number of popular films and personal stories attest, a skilled classroom teacher has the power to alter indelibly the life of a student. The presence of such transformative teachers in North Carolina’s classrooms, however, is not something that happens due to chance; instead, it is (or should be) the product of deliberate managerial and policy choices at the state and local levels — choices grounded in why and how aspiring teachers enter the field and what causes them to leave the classroom at different times prior to retirement age.
Understanding and managing teacher turnover is essential to the adequate staffing of North Carolina’s classrooms and the education of its students, now and in the future.

Recommended reading