The story of an inspiring teacher who transforms the life of a student is a recurring narrative in popular culture, as it is story that rings so true for many individuals. It rarely takes much prompting for people from all walks of life to share stories of how a dedicated teacher helped them see the world in new ways, broadened their sense of life’s possibilities, or inspired them to pursue a dream. While such stories are individual in nature, their collective effect is anything but: imagine how many hundreds, if not thousands, of children a skilled, passionate teacher might inspire during a long career in the classroom.
Lost in the personal stories of how excellent teachers enrich their students is a more mundane question: how do such teachers find their way into North Carolina’s classroom? In school year 2022-23, according to the N.C. Department of Public Instruction, some 93,000 individuals worked as full-time classroom teachers in the state’s 2,550 traditional public elementary and secondary schools.1 As with any workforce, the teacher corps is dynamic, with new people entering annually, as others leave for various reasons. A major—if majorly underappreciated—administrative task, then, is recruiting and retaining adequate numbers of qualified teachers.
When staffing classrooms, principals and district administrators must navigate multiple factors, many of which are beyond their control.2 The number of teachers needed in any given year hinges on the interplay among such factors as growth in the student population, policy choices about class sizes, and teacher turnover. In North Carolina, the state legislature, not local districts, controls most major budget and compensation decisions. Local schools, meanwhile, often find their hiring possibilities shaped by the conditions in their labor markets, the relative attractiveness of their locations, and the needs of their student bodies. Administrators also must strive to staff critical shortage fields while building workforces reflective of their communities.
To improve understanding of the flow of teachers into and out of North Carolina’s classrooms, this policy brief begins by offering a snapshot of the state’s existing public school teacher corps before turning to a discussion of how teachers enter the classroom. Attention then shifts to an analysis of teacher turnover at the statewide and local levels. The brief ends with a discussion of the need for improving the flow of skilled educators through North Carolina’s teacher pipeline.
This brief updates one published by EdNC in 2017.3 Public education in North Carolina has experienced tremendous change in the ensuing years due to policy choices that have shifted enrollment away from traditional public schools and toward charter, home, and private schools combined with the upheavals caused by the COVID-19 pandemic.4 At the same time, changes to statistical collection practices limit comparisons to previously published data. This update nevertheless aims to present consistent information and will note when that is not possible.5
![]() Sign up for the EdWeekly, a Friday roundup of the most important education news of the week.
Sign up for the EdWeekly, a Friday roundup of the most important education news of the week.
A snapshot of North Carolina’s classroom teachers
A total of 92,681 individuals worked as full-time classroom teachers in the state’s traditional public schools in school year 2022-23.6 Of every 100 of teachers, 52 taught primarily in elementary schools, 30 in secondary schools, and 18 in both types of schools.7
Women accounted for 73% of all full-time classroom teachers in North Carolina, men 26%.8 Women represented 82% of all teachers who worked in elementary schools, 58% of those who taught in secondary schools, and 70% of those who taught in both kinds of schools.9 In comparison, the National Teacher and Principal Survey, a representative study sponsored by the U.S. Department of Education, found that 77% of all traditional public school teachers in 2020-21, the last year with data, were women.10
In terms of race, 75 of every 100 full-time traditional public school teachers in school year 2022-23 were white, with African American teachers accounting for 18 of every 100 teachers.11 Compared to the nation as a whole, North Carolina has a more racially diverse teacher workforce thanks to its sizable percentage of African American educators. According to the National Teacher and Principal Survey, African American educators accounted for just six of every 100 public school teachers in the nation in 2020-21.12
The age structure of North Carolina’s classroom teachers is somewhat younger than the national one. The 2020-21 version of the National Teacher and Principal Survey found that half of all public school teachers in North Carolina were younger than age 40, half older; the national median age, in comparison, was 42.13 That year, 19% of the North Carolina’s teachers were younger than the age of 30, with 68% between the ages of 30 and 54 and 13% age 55 or older.14 Compared to the nation, North Carolina had a higher percentage of teachers younger than age 30, a smaller share over the age of 55, and a similar share of teachers ages 30-54.15
Looking at educational credentials, the N.C. Department of Public Instruction reported that 67% of the state’s classroom teachers in school year 2022-23 possessed a bachelor’s degree as their highest educational credential, with another 31% holding a master’s degree.16 Relative to the nation as a whole, North Carolina teachers appear more likely to hold a bachelor’s degree as their highest degree and less likely to have earned a master’s degree.17
Pulling the strands together, the typical classroom teacher in North Carolina is a white woman between the ages of 30 and 54 who holds a bachelor’s degree as her highest educational credential. Of course, teacher characteristics vary from one school district to another, which is why Appendix 1 presents selected data for each of the state’s 115 public school districts.
Pathways into the classroom
Individuals with minimal or no prior education experience who wish to teach in one of North Carolina’s public schools must earn a Professional Educator’s Initial License.18 The traditional manner for doing so is by completing a state-approved teacher educator program offered at an accredited college or university. Aspiring teachers who complete an accredited program in another state may obtain an initial North Carolina license upon satisfactory completion of the relevant licensure examinations. In 2023, a plurality of newly hired K-12 teachers—48% in all—had completed an accredited education program at a public or private university; recognize, however, that this has been trending downward since 2015 in favor of residency and lateral entry programs.19
University-affiliated teacher preparation programs traditionally have been the primary source of new classroom teachers in North Carolina. A 2016 study by the Education Policy Initiative at Carolina, a research program housed at the University of North Carolina at Chapel Hill, found that approximately 80% of the 18,065 first-year teachers employed in the state between school years 2011-12 and 2013-14 had completed a university-based teaching training program at a public or private college in North Carolina or in another state.20 Of every 100 first-year teachers, 43 had graduated from the University of North Carolina system, 12 from a private in-state college or university, and 26 from an out-of-state college or university; another 18 had entered the classroom through a lateral or alternative entry program.21

North Carolina colleges and universities, especially those that are part of the University of North Carolina, continue to be a major source of new teachers. According to data compiled by the N.C. Department of Public Instruction, 14,852 of the individuals who received an initial teaching license between 2019 and 2023 received a degree from teacher training program connected to a university in North Carolina.22 Some 80% of those individuals were graduates of the University of North Carolina, while 20% graduated from a private university.23 (Another 1,486 individuals completed a non-degree teacher preparation program.)24
Of the 11,897 new teachers who received their initial preparation through the University of North Carolina system between 2019 and 2023, approximately 2,700 studied at East Carolina University, which made it the largest producer of new teachers within the University of North Carolina system, accounting for 23% of the total.25 The next largest source was the University of North Carolina at Charlotte (17%), followed by Appalachian State University (13%), the University of North Carolina at Wilmington (10%), and the University of North Carolina at Greensboro (9%).26 Collectively, the state’s five historically black universities and one historically Native American university prepared 10% of system graduates.27
In terms of licensing, 52 of every 100 graduates from the University of North Carolina’s teacher preparation programs between 2019 and 2023 were licensed initially as elementary school teachers; the next largest licensure category was secondary education, in which 14 of every 100 graduates were trained, followed by special subjects (13 of every 100), special education (12 of every 100), and middle grades education (10 of every 100).28
Over the past decade the relative importance of university-based teacher preparation programs has declined in favor of residency and lateral entry programs. Prior research by the Education Policy Initiative at Carolina found that the share of new teachers coming from alternate entry programs rose to 25% from 14% between 2013 and 2017.29 A more recent analysis of public data published by BEST NC, a nonpartisan coalition of business leaders supportive of public education, found that the share of new North Carolina teachers coming from alternate entry programs reached 43% in 2023; that year, alternate entry programs were the single largest source of new teachers in North Carolina and contributed more than twice the share of the University of North Carolina.30
Pathways out of the classroom
As with any workforce, North Carolina’s public school teaching corps is not static, as people regularly leave the classroom for such personal and professional reasons ranging as retirement, family relocation, and job dissatisfaction. Employee departures are an inevitable and, in some ways, even desirable aspect of organizational life, but understanding the exact mix of factors that leads people to stop teaching is vital to the effective management of the teacher workforce.
N.C.G.S. 115C-12(22) requires the State Board of Education to prepare an annual report on the state of the teaching profession—a report that must include a detailed analysis of teachers who left the classroom. In the most recent report, which was based on data for school year 2022-23, two concepts were used to measure changes in the employment status of teachers:
Attrition is a reduction in the number of teachers that occurs when a teacher leaves employment in one school district in North Carolina without moving to another in-state district; attrition is measured for the state and for individual school districts.
Mobility is the relocation of a teacher from employment in one North Carolina school district to another one within the state; mobility is measured only for school districts since a teacher who switches in-state districts is still teaching in North Carolina.31
The recent statewide report measured the two components of employment change by comparing payroll records from March 2022 to records from March 2023. A teacher who appeared on the payroll of a particular school district in March 2022 but not in March 2023 was categorized as “attrition,” while a teacher who appeared on the payroll of a school district in March 2023 different from the March 2022 one was categorized as “mobility.”32 Remember that a teacher who left one in-state school district for another would be counted as local attrition but statewide mobility since, while a school district lost a teacher, the state did not.
In past years, the responsible educational agencies reported a third measure: turnover, which is the sum of teacher attrition and teacher mobility over a span of time. The report for school year 2015-16, for instance, reported an attrition rate of 9% and a mobility rate of 4%, which resulted in a turnover rate of 13%; in other words, 13 of every 100 teachers working in North Carolina’s public schools in March 2015 were either no longer teaching or teaching in a different in-state school district one year layer.33 While the state no longer reports a turnover rate, likely so as to better focus on the individual components of change, this brief will calculate the measure when appropriate to illustrate overarching trends.
A few other caveats deserve mention to interpret the data correctly. First, the state report excludes teachers on approved leave, those who moved to another teaching position in the same school district, and those who took a non-instructional role in the same district. Second, the analysis includes teachers connected to certain term-limited programs, such as the Visiting International Faculty program, in which a teacher is expected to leave after a fixed period (often two or three years). Third, the data do not measure changes in charter schools, as they are exempt from many reporting requirements; the exception is that the mobility data capture teachers who leave public schools to teach in charter schools.34 Finally, changes in reporting practices mean that current data are not comparable to data reported prior to 2015-16.35
Teacher change in North Carolina: March 2022 to March 2023
According to the N.C. Department of Public Instruction, a total of 90,638 classroom teachers were employed by the state’s 115 school districts in March 2022. Of those individuals, 80,262 were still teaching in a North Carolina public school one year later; the loss of 10,376 teachers over that period translates into an attrition rate of 11%.36 Put differently, 89 of every 100 public school teachers employed in North Carolina in March 2022 were still teaching in one of the state’s public school classrooms one year later.
The annual study of the teaching profession mandated by N.C.G.S. 115C-12(22) requires an analysis of the reasons why teachers leave the profession. Based on information drawn from each school district’s human resource records, the latest study identified 23 self-reported reasons why teachers stopped teaching and grouped those reasons into five broad categories:
Left School District, Still in Education: teachers who left a public school district to take another education position in the state, such as an administrative role or a teaching position in a private, parochial, or charter school in North Carolina.
Left School District for Personal Reasons: teachers who left a public school district for a personal or family reason (such as a relocation, childcare or eldercare, or disability), a decision to teach in another state, or dissatisfaction with the teaching profession.
Terminated by School District: teachers who left a public school district due to a contract expiration, a contract non-renewal, a dismissal for cause, or a similar reason.
Left for Reasons beyond the School District’s Control: teachers who left a public school district for a reason such as retirement, downsizing, death, or the completion of a term commitment (e.g., Visiting International Faculty and Teach for America).
Left for Other Reasons: teachers who left a public school district for any other reason.37
As mentioned previously, a total of 10,376 teachers left the classroom entirely between March 2022 and March 2023. Based on the broad categories used in the statewide report, of every 100 teachers who left over that period, 48 stopped teaching for a personal reason, 31 for other reasons, 15 for reasons beyond the control of the local school district and six for reasons initiated by a local school district.38
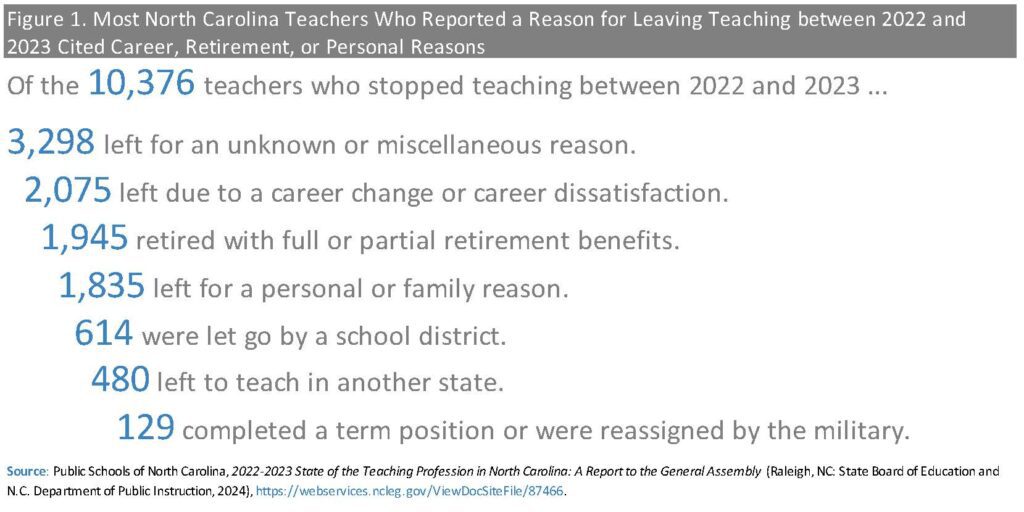
When it comes to specific reasons for leaving, the single largest one, as shown in Figure 1, was an unknown or miscellaneous reason, which was the reason associated with 32% of all leavers, or 3,298 teachers.39 The next most frequently stated reason was a career change or career dissatisfaction, which applied to 20% of all leavers, or 2,075 teachers. Another 1,945 educators, or 19%, retired with full or partial benefits, while an additional 1,835 teachers, or 18%, left for a personal or family reason. The remaining 1,223 leavers were divided between individuals dismissed by a school district (6%), teachers who left to teach in another state (5%), and those who completed a fixed term position or moved due to military orders (1%).
A further analysis of the data reveals that 4,835 classroom teachers left a teaching position in one North Carolina school district for a job in another in-state school district, yielding a statewide mobility rate of 5%.40 Combining the 10,376 teachers who left the public schools altogether with the 4,835 individuals who switched districts results in a total of 15,211 teacher changes between March 2022 and 2023, which yields a turnover rate of 17%.41 Put differently, 17 of every 100 teachers working in North Carolina’s public schools in March 2022 were either no longer teaching or teaching in a different district a year later (Figure 2).

Who leaves North Carolina’s classrooms? An analysis of attrition rates
North Carolina teachers may have an overall attrition rate of 11%, but that statewide figure masks crucial differences in which segments of the teaching corps leave and why. Attrition rates, notably, are higher for beginning teachers than for more experienced ones.
Of the 90,638 classroom teachers employed in the state’s 115 school districts in March 2022, some 10,104, or 13%, were beginning teachers, meaning those with fewer than three years of experience.42 One year later, 8,578 of those teachers were still in a North Carolina classroom, which translated into a decrease of 15%, or 1,526 teachers. In contrast, the attrition rate among experienced teachers was 11%, with the rate generally falling with each year of experience until increasing sharply again among teachers with 25 or more years of service.43
Attrition rates vary among different categories of teachers. Some 8% of residency licensed teachers, for instance, left the classroom between March 2022 and March 2023, as did 17% of participants in the Visiting International Faculty program.44 Given that positions in the Visiting International Faculty program are for fixed terms, a high attrition rate among this group is expected.
When it comes to instructional effectiveness, the teachers who left North Carolina’s classrooms between March 2022 and March 2023 generally posted lower scores, as measured by the state’s Education Value-Added Assessment System, than did teachers who remained, even after controlling for such factors as years of experience.45 Recognize that this observed relationship is not a causal one; nevertheless, it raises important managerial questions about how best to identify and nurture effective educators early in their careers.
Just as attrition rates vary for various kinds of teachers, so do their reasons for leaving. Unlike prior editions, the current statewide report on the state of the teaching profession offers no tabulations of the reasons for teacher attrition broken out by the number of years of teaching experience. Prior reports that included such data indicated that early-career individuals were more apt to change careers, move to another state, or leave to pursue further education. At the other end of the spectrum, the most experienced teachers are the ones most apt to retire with pension benefits.46
Related reading


Historical trends in North Carolina
Recent methodological changes made by the N.C. Department of Public Instruction limit the comparison of the turnover information contained in the most recent report on the state of the teaching profession to the historical data compiled to satisfy N.C.G.S. 115C-12(22). This is especially true for data compiled before 2015-16.
The original version of this policy brief, which was published in 2017, looked at teacher turnover, attrition, and mobility between March 2015 and March 2016.47 Of the 95,549 full-time teachers working in the state’s traditional public schools in March 2015, some 82,750 persons were teaching in the same school district one year later; put differently, 12,799 members of Noth Carolina’s teaching corps stopped teaching in a North Carolina public school altogether or moved to a different public school district in the state, resulting in a turnover rate of 13%. Attrition accounted for most of the change, with 8,636 teachers leaving the traditional public schools altogether, which translated to an attrition rate of 9%. The movement of 4,163 teachers from one school district to another, meanwhile, yielded a mobility rate of 4%.
Unfortunately, the data in the original policy brief are not comparable to the more recent data. Such data appear beginning with the 2018 version of the statutorily-required mandated report, which analyzed changes that occurred between March 2016 and March 2017.48 Of the 94,792 full-time teachers working in the state’s traditional public schools in March 2016, some 81,967 persons were teaching in the same school district one year later; put differently, 12,825 members of North Carolina’s teaching corps stopped teaching in a North Carolina public school altogether or moved to a different public school district in the state, resulting in a turnover rate of 14%.49 Attrition accounted for most of that change, with 8,249 teachers leaving the traditional public schools altogether, which translated to an attrition rate of 9%.50 The movement of 4,576 teachers from one school district to another, meanwhile, yielded a mobility rate of 5%.51
North Carolina’s teacher turnover rate (14% to 17%) and its attrition rate (9% to 11%) rose between 2016-17 and 2022-23, with the mobility rate holding steady at 5%. Most teachers, nevertheless, remained in the same classroom from one year to the next. In both periods, beginning teachers were more apt to leave teaching than experienced ones, with experienced teachers tending to remain in the classroom until becoming eligible for retirement benefits. Similarly, in both periods, teachers assessed as “less effective” under the state’s instructional effectiveness system were more apt to leave than teachers who posted better results.
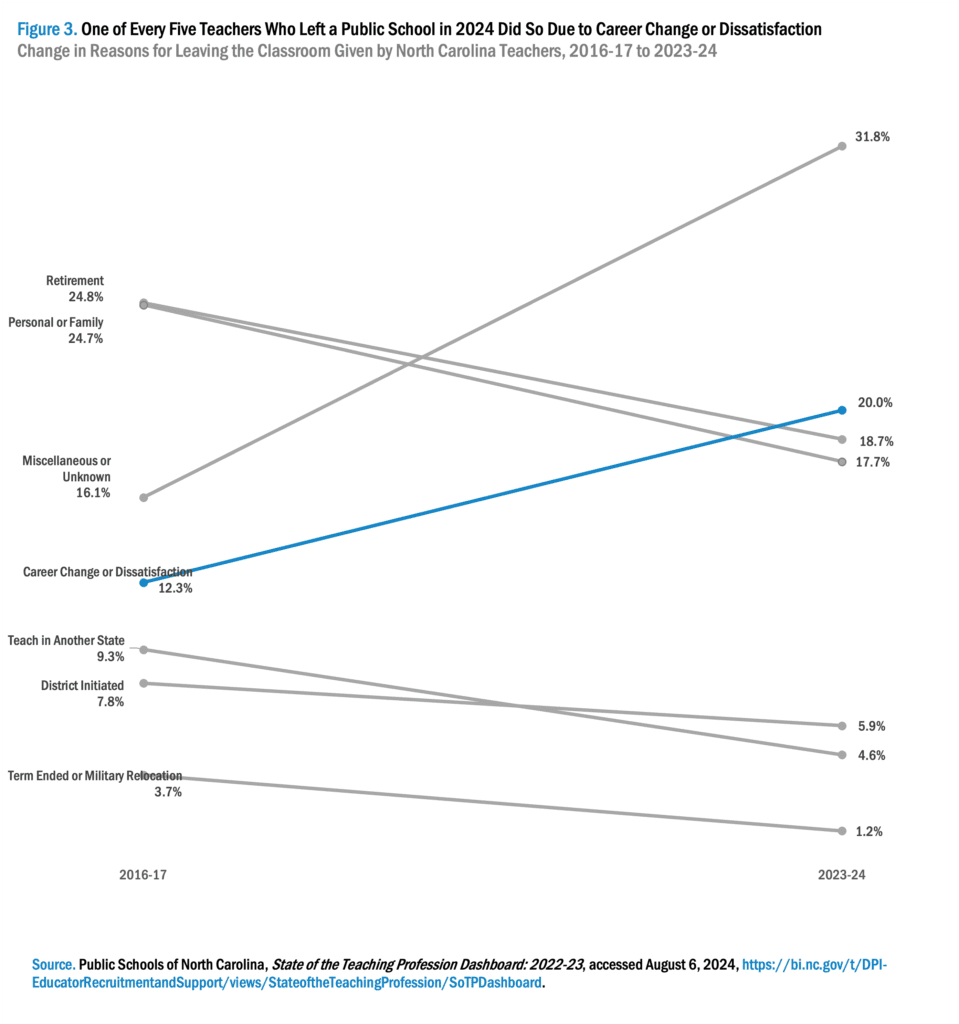
What did change noticeably between the two periods is the reasons for leaving reported by the individuals who stopped teaching in the public school altogether (Figure 3). For teachers who left the public schools altogether between 2016 and 2017, the three most-cited reasons were retirement (25%), family reasons (25%), and unknown or miscellaneous reasons (17%).52 That year, just 12% of leavers reported career dissatisfaction and/or change as the reason for their decision.53 For those who stopped teaching in a North Carolina public school between 2022 and 2023, however, the top three reasons offered for leaving were an unknown or miscellaneous reason (32%), followed by career dissatisfaction and/or change (20%), and retirement (19%).54
The relative decline in retirement as a cited reason for leaving teaching may be a function of a change in the age structure of the teaching workforce. For years, members of the “Baby Boom” cohort (born 1946-64) comprised the largest share of North Carolina’s teaching workforce, but today, all the surviving Boomers are between the ages of 60 and 78, with all but the youngest Boomers being well beyond the traditional retirement age of 65 years. As those individuals have left the classroom, they have been replaced by younger teachers who will not be able to retire for some time, assuming they spend their careers in a North Carolina classroom.
The relative increase in the number of people who cite career dissatisfaction and/or change as a reason for leaving teaching—the reason cited by one of every five leavers—is more troubling. Data compiled by the NC Department of Public Instruction show that the number of teachers who left teaching owing to career dissatisfaction and/or change more than doubled between 2019 and 2023, rising to 2,075 from 1,013.55
The overlap of this period with the onset of COVID-19 is likely not coincidental. Since COVID’s arrival, teachers have had to navigate rapid pivots among in-person, online, and hybrid instruction while also dealing with the behavioral, disciplinary, and academic challenges stemming from the pandemic. In many crucial ways, the work of a classroom teacher is fundamentally different than it was five years ago, with increased career dissatisfaction to be expected. The challenge facing educational leaders is working to mitigate those effects and help teachers choose to stay in the classroom.
Finally, the relative growth in the number of people who cite unknown or miscellaneous reasons for leaving a public school classroom may point to a need for the Department of Public Instruction and State Board of Education to review the more detailed responses provided to the annual state of the profession report and adjust the analytical categories to better understand why a sizable number of teachers are exiting the classroom.
National and state comparisons
Comparisons of state-level data regarding teacher turnover, attrition, and mobility are difficult to draw since the information is not collected in a systematic way. In fact, a 2021 report from the National Council on Teaching Quality, a nonprofit organization based in Washington, DC, found that North Carolina was one of just seven states that tracked and published detailed information on teacher attrition and mobility, while another 13 states only track data about attrition.56 Even when states track the same kind of information, differences in reporting systems yield data that are ill-suited for the drawing of inter-state comparisons.
As part of the most recent version of the U.S. Department of Education’s National Teacher and Principal Survey, researchers studied attrition and mobility patterns among a nationally representative set of teachers between 2020-21 and 2021-22. Among public school teachers, 84% remained in the same school from one year to the next, 8% moved to another school (including in the same district), and 8% left the teaching profession entirely.57 The most cited individual reasons for leaving a public school classroom were retirement (17%), a decision to change careers (14%), personal life reasons (14%), a need for a higher salary (9%), and career dissatisfaction (7%).58
The design of the National Teacher and Principal Survey means that attrition and mobility estimates are available for the nation as a whole; statewide data, in contrast, are subject to sizable errors. That said, an online dashboard of federal data compiled by the Learning Policy Institute, a nonprofit organization in California, ranked North Carolina in the bottom 40% of states in terms of attrition rates and among the bottom 20% of states in terms of teachers who hope to leave teaching as soon possible.59 According to the Learning Policy Institute, 12% of North Carolina’s teachers are interested in leaving teaching; based on the size of the state’s teaching corps, that translates to as many as 12,000 teachers who are considering leaving.60
By some estimates, national attrition and turnover rates have increased since the late 1980s, though the exact reasons for the increases are debatable.61 Demographic factors play a role, as the large cohort of teachers born during the “Baby Boom” largely has reached retirement age. Yet even today, just a subset of teachers cites a desire to retire as their primary reason for leaving the classroom. Instead, approximately one third of the job leavers interviewed in the National Teacher and Principal Survey cited dissatisfaction with some aspect of teaching (e.g., career, pay, benefits, workplace conditions, student discipline, administration, and accountability systems) as their most important reason for leaving a public school classroom.62
The exact impacts of attrition and turnover vary among states, school districts, and schools. High-need schools, for one, tend to have high rates of turnover, resulting in many of the students with the greatest educational needs being taught by the least-experienced teachers.63 Similarly, turnover imposes costs in time and money on school districts, while increasing the number of new hires required annually to fill all vacancies. Reducing attrition and mobility rates therefore is a powerful tool for mitigating teacher shortages and managing costs.

Turnover in North Carolina’s local school districts
The overwhelming majority of North Carolina’s public school teachers—83 of every 100—worked in the same district in March 2023 as they did one year earlier. Although seemingly modest, statewide rates of attrition and mobility mask important local differences in the abilities of school districts to staff adequately their classrooms.
Appendix 2 presents detailed turnover data for each of North Carolina’s 115 local school districts between March 2022 and March 223. After combining attrition and mobility, district-level total turnover rates ranged from a high of 31% in Asheville City Schools to a low of 6% in Camden County Schools.64 In all, 50 school districts (43%) had total turnover rates at or above the statewide figure of 17%; of those districts, 28 had turnover rates of 20% or higher, meaning that at least one of every five teachers employed in March 2022 was no longer there a year later.65 And in both Asheville City and Halifax County Schools, 30 of every 100 teachers left over the course of the year.66
Of the 25 school systems classified as a low-performing district, 17 had total turnover rates at or above the statewide figure, with four of the districts ranking among the 10 highest turnover districts in the state (Halifax County, Weldon City, Thomasville City, and Vance County). At the other end of the spectrum, eight districts had turnover rates lower than the statewide one, with two of those districts (Columbus County and Graham County) having some of the lowest turnover rates in the state (Appendix 3).67
Any number of factors influence turnover at the school-district level. Districts with effective management and strong organizational cultures, for instance, may succeed in retaining teachers regardless of the district’s socioeconomic challenges. Alternately, districts with teaching corps that are disproportionately older may experience high levels of retention as the practical and personal barriers to switching jobs likely are higher for older teachers than for younger ones. Districts that invest time and money in mentoring and developing young teachers also may have less turnover among that volatile cohort. A relative lack of job opportunities in economically distressed communities, meanwhile, may lead teachers to hold onto some of the better jobs that may exist locally. Although the exact mix of factors varies, understanding the local landscape is essential to managing the teaching corps.
To manage turnover, school districts rely on three broad strategies. First, districts can hire new beginning teachers and attempt to develop their professional skills in the hope of retaining them over time. Second, districts can attempt to hire educators from other states or bring new people into teaching via lateral entry and alternative certification programs. A downside inherent to both of those strategies is that they often result in the replacement of more experienced teachers with less experienced ones, and as research suggests, teacher experience matters. A 2016 study by researchers at Duke University’s Sanford School of Public Policy, for one, found a significant positive, increasing relationship between teacher experience and the test scores posted by middle-school students in North Carolina, along with lesser—but still positive—effects on behavioral problems like absenteeism.68
Lastly, districts can undertake teacher recoupment, defined as the recruitment of experienced teachers from other in-state districts. The viability of teacher recoupment strategies, however, hinges on a mix of practical factors. Based on data from the N.C. Department of Public Instruction, the districts with some of the highest recoupment rates between March 2022 and 2023 were smaller districts with relatively few positions to fill (Appendix 2). For instance, Weldon City Schools, which managed to replace more than 60% of the teachers lost to attrition and mobility, had to replace just 13 teachers in total.69 In larger districts that need to replace a greater number of teachers, recoupment helps to offset a smaller share of losses. In Wake County Public Schools, for one, recoupment offset 380 of the 1,748 teachers lost between 2022 and 2023.70
Larger districts also enjoy a recruiting advantage by being able to offer higher salaries thanks to larger local salary supplements. For example, New Hanover County Schools offers an average salary supplement of $9,272 per year, as compared to the average annual supplement of $6,277 paid in neighboring Pender County Schools.71
At a local level, an important statistic to measure is net turnover, which is the number of positions lost to attrition and mobility after accounting for teacher recoupment. In many districts, the difference between total and net turnover can be noticeable. Orange County Schools, for instance, posted a total turnover rate of 20% between 2022-2023, but after accounting for recoupment, the net turnover rate was 11%, meaning the district offset 44 of its 98 lost teachers, resulting in a gap of 54 teachers to fill.72 Even many low-performing districts had net turnover rates lower than their total turnover rates (Appendix 3). For example, teacher recoupment efforts allowed Wayne County Schools to reduce its turnover rate to 12% from 17%, resulting in a gap of 134 instead of 187 teachers.73
Recognize that relying on recoupment strategies to offset teacher turnover is a double-edged sword. Yes, a district may be able to offset their losses by hiring experienced teachers, but those teachers are coming from other in-state districts, which may simply shift losses to other public schools. In that sense, recoupment strategies may benefit individual districts without addressing—or even compounding—statewide problems in classroom staffing.

Why turnover matters
At first glance, teacher turnover in North Carolina seems to be manageable. Of the 90,638 teachers employed in the state in March 2022, some 80,262 were teaching in the same school district one year later, while another 4,835 teachers remained in the classroom, though in different districts. And of the 10,736 educators who stopped teaching entirely, 1,945 left for the understandable reason of retiring with full or partial benefits. That left 8,431 people who left for a reason that better policy or management might have had a role in addressing, especially given how 2,075 people reported leaving for reasons of career change or dissatisfaction.
Viewed in another light, however, teacher turnover is an important managerial and policy challenge that requires statewide attention for at least three reasons. First, reducing turnover, especially the component caused by attrition among teachers early in their careers, can reduce the time and money spent on recruiting. For example, retaining even half of the 10,104 beginning teachers who left teaching between 2022 and 2023 by itself would have lowered the statewide attrition rate by almost one full percentage point.74
Reducing turnover also matters since the overall growth in the state’s student population is increasing the annual need for teachers. The N.C. Office of State Budget and Management projects the number of children between the ages of 5 and 17 to increase by 11% from 2022 to 2040, climbing to 1.9 million from 1.7 million.75 That translates into an average annual gain of 10,232 new students. Depending on the age structure of the student population, policy choices about class sizes at different grade levels, and the growth of charter and private schools, North Carolina’s traditional public schools likely will need to add a few hundred teachers each year to handle population growth, before even considering the hiring needed to replace teachers who leave
Lastly, managing turnover effectively matters for instructional reasons. As noted earlier, research findings suggest that teacher experience can have a positive impact on both student test scores and certain behavioral outcomes. Research also shows that, not surprisingly, beginning teachers often are less effective than their more experienced peers. Meanwhile, less-resourced districts often struggle with turnover more than better-resourced ones do (especially when better-off districts hire teachers away from less-advantaged ones), which often forces less-advantaged communities to rely disproportionately on beginning teachers. And when less-advantaged districts primarily enroll students of color or those living below or near the poverty level, such staffing patterns raise troubling questions about educational equity.
National research suggests that there is no one formula for minimizing teacher turnover, especially among educators who leave early in their careers. Yet thinking about turnover only when an individual teacher departs is too late. Districts and policymakers must think instead of turnover holistically, beginning from when a young adult enrolls in a teacher education program and continuing through that person’s initial entry into the profession, the formative early career years, the prime-working years, and the pre-retirement period.
To that end, policymakers and local educational leaders need to think systematically about five sets of issues: 1) salaries and compensation; 2) teacher preparation and entry; 3) hiring and personnel management; 4) induction and early-career support for teachers; and 5) working conditions.76
Conclusion
As any number of popular movies reflect, a skilled classroom teacher has the power to alter indelibly the life of a student. Yet the presence of such transformative teachers in North Carolina’s classrooms, however, is not something that happens due to chance; instead, it is (or should be) the product of deliberate managerial and policy choices at the state and local levels—choices grounded in why and how aspiring teachers enter the field and what causes them to leave the classroom at different points prior to reaching retirement age. Understanding and managing teacher turnover therefore is essential to the adequate staffing of North Carolina’s classrooms and the education of its students, now and in the future.
Editor’s note: Appendix 1 was updated on Oct. 25, 2024 to correct typographical and data formatting errors in the version first published online on Oct. 23, 2024.

Recommended reading