|
|
Organizations throughout the private, public, and nonprofit sectors recently have shifted to digital dashboards as their preferred way of tracking, analyzing, and presenting key operational and performance indicators. A digital dashboard is a collection of related visual data “intended to give the 30,000-foot view of an organization’s key performance indicators on one page full of data displays, for fast assessment by CEOs and directors.”1
Dashboards are suited to the tracking of indicators that change often, require monitoring, and inform strategy.2 Advantages of dashboards include the ability to see multiple views of related data in one place, the simplicity in isolating one indicator or cross-referencing it with other ones, and the ease with which interested parties can download and analyze the underlying data. Plus, popular dashboard programs like Tableau and Microsoft Power BI interface easily with many existing data systems and websites.
At the same time, the volume of information present on a dashboard combined with its changing nature as information is revised or added can overwhelm a non-expert user and lead to the drawing of erroneous conclusions.
This EdExplainer explains how to use two educator preparation program dashboards: the “Educator Preparation Program Dashboard” maintained by the N.C. Department of Public Instruction (DPI) and the “Educator Prep Program Trends Dashboard” maintained by the University of North Carolina system office.
Sign up for the EdWeekly, a Friday roundup of the most important education news of the week.
DPI’s Educator Preparation Program Dashboard
Launched in early 2023, DPI’s dashboard tracks multiple quantitative and qualitative indicators about individual candidates for an initial teaching license who were enrolled or are currently enrolled in an educator preparation program located in North Carolina.3 Included programs are those offered by 15 University of North Carolina schools, 33 North Carolina private colleges and universities, and seven non-degree preparation programs. Teachers who completed their initial training elsewhere are not included.
To generate the information, the dashboard combines information from the individual preparation programs and the Department of Public Instruction. Data are generally available from 2015 to the present, with 2023 being the most recent year at the time of writing.
The combination of different sources requires a user to be mindful of definitions. For instance, completion of an educator preparation program is measured on an August 1-July 31 basis, meaning that a 2021 completer could have earned a degree as early as August 2020. Someone who graduated later in 2021, meanwhile, would be counted as a 2022 completer.
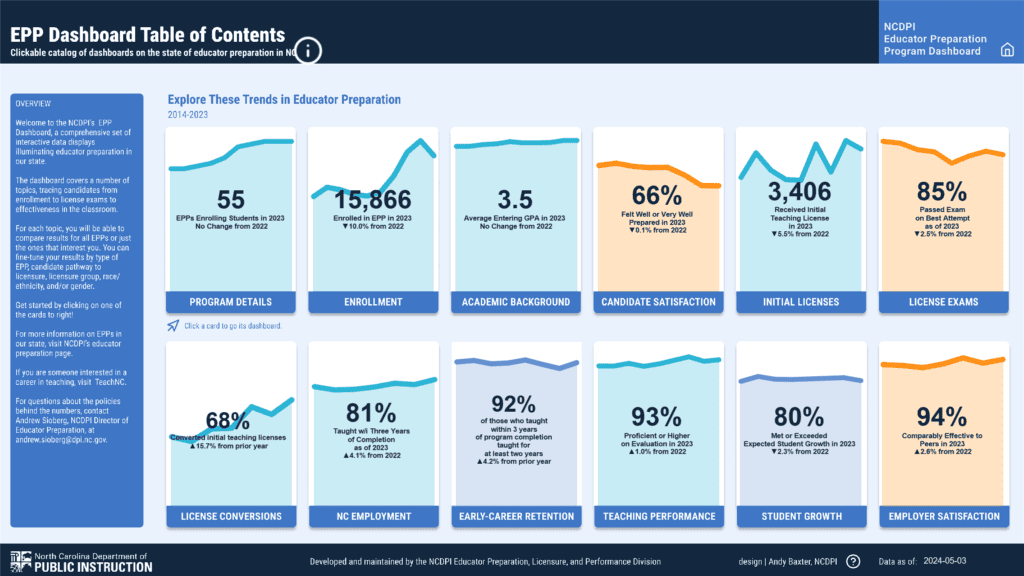
Figure 1 is a snapshot of the dashboard’s landing page at the time of writing. Taken together, the 12 tracked indicators offer insights into an educator’s or aspiring educator’s professional preparation, licensing, employment, retention, effectiveness, and satisfaction.

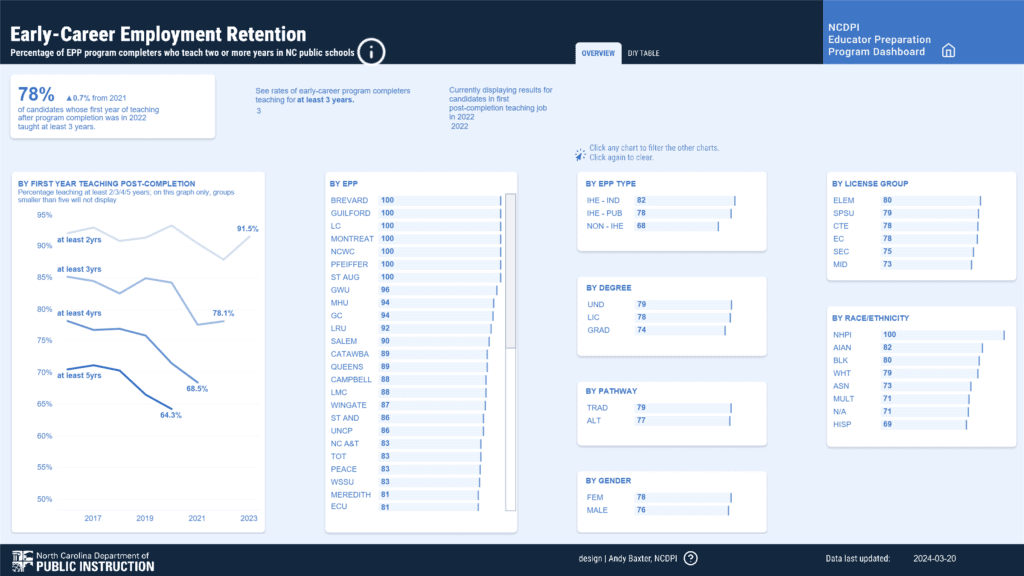
Imagine someone who wanted to gain deeper understanding of retention rates for early-career educators. Clicking on the appropriate tab on the landing page would open Figure 2 (below). The box at the top left shows that 78% of the people who began teaching in North Carolina in 2022 were still teaching three years later. (Clicking on the underlying data will show that 3,078 persons began teaching that year, meaning that some 674 of those persons left the classroom within three years.)
The small multiples data to the right, meanwhile, provide more detail for different variables. For instance, 82% of individuals who trained at a private university (421 out of 516) were still teaching three years later, versus 78% of those who trained at a public university (1,840 out of 2,350), and 68% of those who trained at a non-university program (144 out of 212).

Adjusting the selected options would allow a user to view other cuts of the data or to track retention rates over different periods. The tabular display in Figure 3 (below) offers detailed retention data for different cohorts.
Not enough time has passed for every cohort to have three-year retention data, but the available data shows a decline from the 85% three-year retention rate recorded by included teachers who began teaching in 2016 to 78% among those who entered the classroom in 2022. A similar pattern appears among the cohorts for which five-year retention rates exist; that figure fell to 64% among the 2020 cohort from 71% among the 2016 cohort.

UNC Educator Prep Program Trends Dashboard
Another source of online information is the “Educator Prep Program Trends Dashboard” maintained the University of North Carolina System Office. This public dashboard combines information supplied by DPI with enrollment and other data compiled by the UNC System to “track numerous metrics on students in the Educator Prep Program during their admission, enrollment, completion, and job placement following [program] completion.”
The dashboard focuses solely on educators who undertook their professional preparation in UNC-affiliated educator prep programs. Information about individuals’ professional preparation is combined with data about their subsequent employment, retention, and performance as a teacher in one of North Carolina’s public schools.
More specifically, information is available about admission to and completion of UNC education preparation programs, clinical experiences during that preparation, performance on licensing exams, employment and retention in a public school, classroom performance on EVASS, and literacy test scores and student performance for teachers of early grades. The information can be further refined by such factors as year, institution, gender, ethnicity, and pathway. Also, while the dashboard states that it is updated each February, no update has occurred since February 2023, at least as of the time of writing.
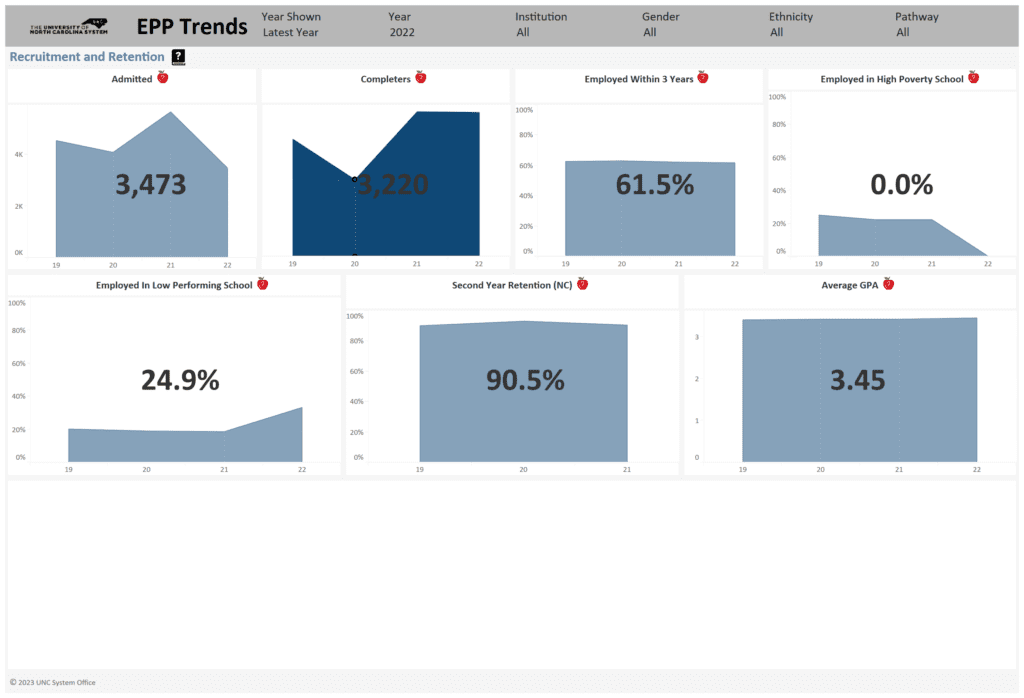
Figure 4 (below) is a snapshot of the dashboard’s landing page for “Recruitment and Retention” data. Taken together, the seven indicators offer basic trend data spanning the years 2019 to 2022. For instance, the number of persons admitted to a UNC-affiliated educator preparation program ranged from 4,540 in 2019 to a high of 5,643 in 2021 to a low of 3,473 in 2022. Over that same four-year period, slightly more than 62% of completers were employed within three years of program completion, while roughly 90% of first-time employed teachers remained in a North Carolina classroom for at least two years.

Where to look?
Of the two dashboards, DPI’s Educator Preparation Dashboard currently is the more useful resource for understanding trends among North Carolina public school teachers who completed their initial professional preparation within the state. That dashboard includes not just individuals who trained at a UNC system program, but also those who prepared for their careers at one of the state’s private colleges or through certain non-degree programs.
The DPI dashboard also covers more years, offers a greater ability to filter data by selected variables, and allows for a user to access more granular data. The dashboard is updated more regularly and allows for interested users to more easily download the underlying data and incorporate them into their own analyses.
Regardless of their relative strengths and weaknesses, neither dashboard is sufficient by itself for understanding teacher workforce trends in North Carolina. While the sites provide convenient, one-stop access to critical data, the information is of limited use absent an understanding of the indicators and variables, the knowledge needed to analyze that information, and an ability to explain that information to wider audiences.
Recommended reading


