“Minorities comprise more than half of the millennial populations in 10 states, including Texas, Arizona, Florida, Georgia, and New Jersey. In 10 additional states, including New York, Illinois, Virginia, North and South Carolina, minorities comprise more than 40 percent of millennial residents. Other states have whiter millennial populations, but only nine states are home to largely (over 80 percent) white millennial populations (e.g. Wyoming, Iowa, West Virginia, and Maine).” – William Frey, Diversity defines the millennial generation
If you took a snapshot of a typical North Carolina classroom 20 years ago, the racial and ethnic makeup would look a lot different than it does today. And that picture of today’s classroom will look different in only another five years as a new, increasingly diverse cohort of students prepare to enter kindergarten.
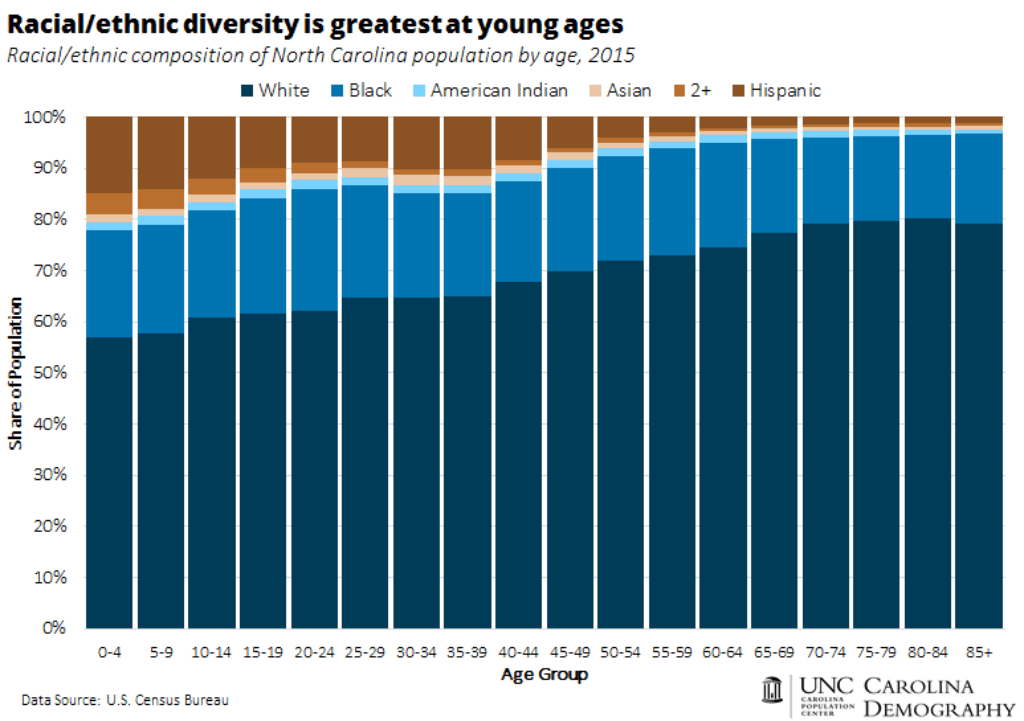
The chart below highlights the racial/ethnic composition of North Carolina’s population by five-year age group. Racial/ethnic groups that have long been present in North Carolina — white, black or African American, and American Indian — are shown in varying shades of blue. The orange shaded areas of the bars highlight racial/ethnic groups whose presence in the state has increased significantly over the past 25 years. This includes Asian and Hispanic residents, as well as individuals who identify as two or more races.
In 2015, North Carolina’s population was 68 percent white. Thirty-two percent of state residents belonged to a racial/ethnic minority group: 20 percent black or African American, 2 percent American Indian, 1 percent Asian, 2 percent multiracial, and 7 percent Hispanic. The racial/ethnic composition of individuals 40-44 was nearly identical to the overall composition of the state overall in 2015.
At younger ages, the populations were significantly more diverse. The most visible difference is the growing share of the Hispanic population, rising from 8 percent among North Carolina’s 40-44 year-olds to 15 percent among the youngest age group (0-4).
Younger individuals are also much more likely to belong to two or more racial groups; less than 1 percent of individuals age 40 or older are multiracial compared to 4.3 percent among North Carolina’s 0-4 year-olds.
One reason for an increasingly diverse young population? Population aging
In his recent article about diversity in young Americans, William Frey points to “a noteworthy demographic dynamic [that] is making the young post-millennial generation more racially diverse – the absolute decline in the number of white children (persons under age 18).” This, too, is happening in North Carolina. In 2015, North Carolina had 57,000 fewer white children than in 2010, with the declines most pronounced at ages 10 and under. These declines may be partly due to fertility declines, but they are more significantly impacted by population aging and an overall decrease in the number of potential white parents.
There were 100,000 fewer white (non-Hispanic) adults ages 35-49 living in North Carolina in 2015 than in 2010. This is not because of out-migration. Rather, it is driven by the aging-in and aging-out of groups with different population sizes. Individuals who were 45-49 in 2010 aged into the 50-54 year old category in 2015 and out of the 35-49 population. They were replaced by individuals who were 30-34 in 2010.
Individuals age 45-49 in 2010 were the youngest Baby Boomers and were the largest population of non-Hispanic whites in the state (484,000). The population of non-Hispanic white 30-34-year-olds in 2010 was substantially smaller: 368,000 or about 115,000 fewer individuals than the 45-49 year-olds they were replacing. The observed decline in the size of the 35-49 year old population — a loss of 106,315 individuals between 2010 and 2015 — can be fully explained by population aging. The much smaller base of potential parents contributes significantly to the declining size of the white child population.
Editor’s note: As a more racially and ethnically diverse group of students enter our state’s classrooms, they are attending schools where the majority of teachers and principals do not look like them.
This chart from the EducationNC Data Dashboard shows the racial composition of North Carolina public school personnel for the 2015-16 school year.
https://www.ednc.org/data-viz/nc-school-personnel-by-race-2015-16/
How does this affect our classrooms and the success of our students? Share your thoughts in the comments below about what the state’s growing diversity means for our schools.
This article originally appeared as two blog posts at the Carolina Demography blog. It is reprinted here with the author’s permission.


