This week we have tried to uncover why some schools serving low-income populations received As during the February release of the A-F School letter grades.
To recap
The narrative around the letter grades was that poor schools did poorly. But there were outliers – schools serving low-income populations that received As. We wanted to see what made them different.
Eleven of 17 of these schools were early college high schools. Early colleges operate differently and serve a different population of students than a traditional high school. These students as a group tend to be more determined, and while they might not be the best students, they certainly aren’t the worst. Traditional schools don’t have any say in which students they serve. They take all comers.
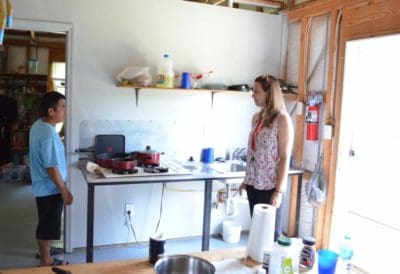
The remainder of the 17 A schools were traditional schools. There were five. One no longer exists – it was an academy within a larger school that was absorbed this year. That left four. I visited three of them.
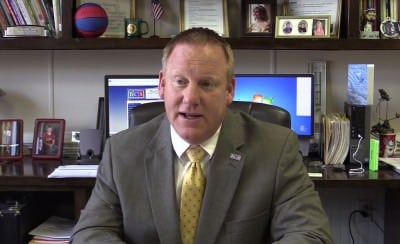
In the midst of my school visits, I talked with State Board of Education Chairman Bill Cobey. He told me that when I visited the schools, he thought I would find four things they all had in common.
Outstanding leadership in the schools
A stable teaching force (low turnover) that works together as a team
Teaching to the standards
High expectations
He was right – in part. All three schools I visited seemed to have outstanding leadership – administrators dedicated to helping their teachers perform at their highest levels.
And all the schools I visited were very mindful about teaching to the standards. They had found creative ways to teach them, but they did not stray far.
“High expectations” were two words repeated to me over and over at the schools I visited. Of the four bullet points Chairman Cobey gave me, this one echoed loudly throughout my visits.
But turnover isn’t as easy to pin down.
Riverbend Elementary School in Haywood County does fit into that category. According to the Department of Public Instruction’s NC School Report Cards website, it had a turnover rate of 5.9 percent in 2013-14. The district average for elementary schools was 13.8 percent, and the state average was 12.8 percent.
Rutherford College Elementary also fits. It had a turnover rate of 3.4 percent in 2013-14, which is a few points lower than the district average of 6 percent, and quite a bit lower than the state average.
Ocracoke School in Hyde County doesn’t fit, however. It serves Pre-K through 12th grade students, and its turnover rate was 19.1 percent. That’s a few points higher than the state average of 16.8 percent for similar schools.
Ocracoke is also the most unique school on this list. It’s a tiny school on an island with a small population. It exemplifies the term “community school.”
Here are some other points to consider.
Size
All three schools were small.
According to DPI’s NC School Report Cards website, Riverbend had a population of 215 for the 2013-14 school year. The district average that year was 375, and the state average was 496.
Rutherford College Elementary had a population of 197 that same year, though it has grown some since. The district average was 374.
And Ocracoke school was the smallest on the list. For 2013-14, it had a population of 152, though it has grown to 161 since, according to district staff.
Community
All three schools were “community” schools. They were centerpieces of the area where they were located, and the local population supported them.
In addition, the teachers often told me they knew all the students, whether they had them in the class or not. And they were invested in students’ progress even after they moved to another grade level.
Regular communication between parents and teachers was the norm.
Racial Makeup
In contrast to many schools serving low-income populations, all three schools on this list had little racial diversity, according to staff at the schools.
Riverbend was 97 percent white with only seven Hispanic students.
Rutherford College, too, is mostly white with only 17 percent minority: a mix of black, Hispanic, Asian and mixed race.
Ocracoke is the most diverse with 37 percent Hispanic students. But, there again, the rest are white.
Contrast that with Henderson Collegiate, the B charter school I visited: 84 percent black with 14 percent Hispanic students and only 2 percent white.
Student to Teacher Ratio
Much is made of student to teacher ratios. Many think the smaller the class size, the better students do. In some cases, the student to teacher ratio in the three traditional schools we visited was small. But not in all.
Jill Chambers, principal of Riverbend Elementary put her student to teacher ratio somewhere in the vicinity of 17 or 18 to 1. DPI’s most recent NC School Report Cards website doesn’t give classroom numbers for students in those grades. But an older School Report Cards website does.
Riverbend’s number are a little better than average district class sizes for most grades in 2012-13. The state’s average is higher than the district, so Riverbend beats it, too. But the numbers aren’t that much better, with a few exceptions. Go here to see them for yourself.
Rutherford College had similar class sizes to the district in 2012-13, and only slightly smaller than the state. The website says Rutherford College has a ratio between 1:17 and 1:18 depending on the grade. Here are those numbers.
Ocracoke School stands out in this category. It’s such a tiny school with so many grades that its student to teacher ratio is low. According to principal Walt Padgett, In the high school, it’s about 8:1, but the lower grades can go as high as 12:1. That’s currently.
When it comes to students enrolled in particular courses at the time of testing, check out these numbers for the Ocracoke School in 2013-14:
English II: 9
Math I: 8
Biology: 5
The average district numbers are:
English II: 13
Math I: 11
Biology: 13
For the state, the average numbers are:
English II: 18
Math I: 20
Biology: 18
The people on the ground in Ocracoke say the student to teacher ratio at the school is smaller than your typical classroom, and they believe it makes a difference.
Free and Reduced Price Lunch
These articles were an exploration of schools with 50 percent or more free-and-reduced-price lunch students. While it is true that all three traditional schools we visited were over that threshold for the A-F grades, some were only just over.
DPI puts Ocracoke at 52.9 percent for 2013-14.
Jeana Gallagher, the principal at Rutherford College Elementary puts the percentage at 52 percent now. But for the 2013-14 school year, DPI lists the school as having 69.4 percent.
Jill Chambers, Riverbend’s principal, said that this year the school is teetering on the 50 percent line. She said that last year it was a little over 50 percent. DPI puts the number at 56.8 percent.
Here is DPI’s list.
Conclusions
There is a lot of variability between the three schools we visited. But there are a few things we saw again and again:
Excellent teachers and staff
Good instructional strategies
A small student population
A school that is a community centerpiece
High expectations
Low racial diversity
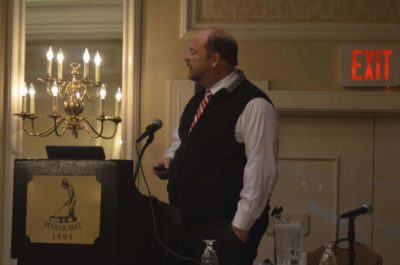
Chairman Cobey had this to say when I told him about some of my preliminary findings.
“In a sense by not growing fast out there, they have maintained community,” he said. “I happen to believe that smaller is better in education, when you can have it.”
He may be right. But the important caveat is “when you can have it.” Not every school can be a small school. The three traditional schools we visited didn’t strive to keep their populations low. Their schools are the product of the communities they live in.
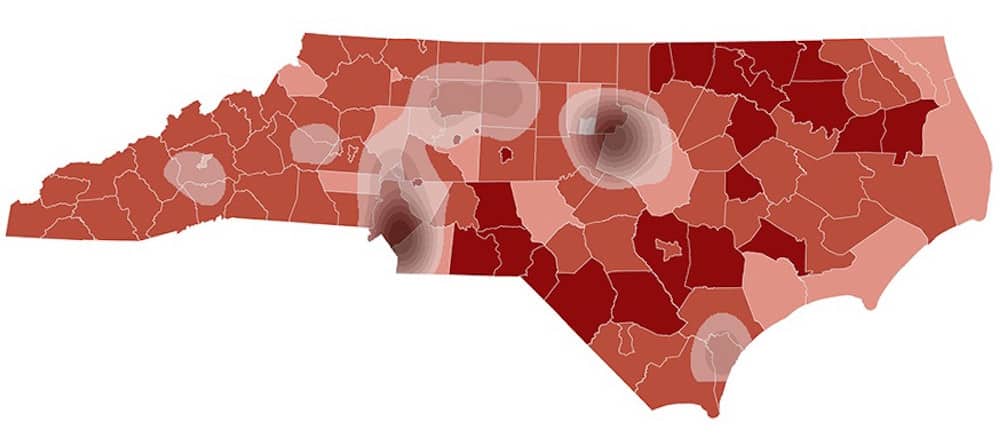
The Map: School Report Cards
Monday: A-F Grades: Why early college high schools succeed
Tuesday: Ocracoke School: An education like no other
Wednesday: Rutherford College Elementary: Another community school
Wednesday: Riverbend Elementary School: Excellence and intimacy
Thursday: Henderson Collegiate: A school built on idealism
Friday: Why do some schools serving low-income populations get As?

Recommended reading