
Through the budget that it approves and the policy legislation that it enacts, the General Assembly has a profound influence on the lives and work of North Carolina teachers, now numbering more than 96,000.
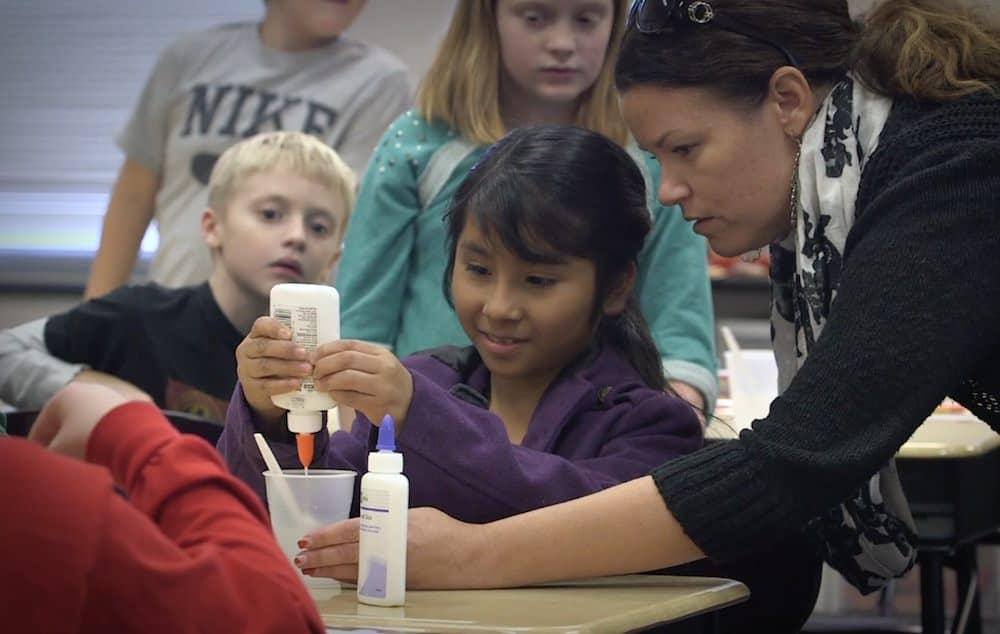
Students and most parents see teachers as specific individuals whom they encounter in classrooms and school events. Many adults have memories of one or more teachers as stern taskmasters or beloved mentors, either way influencing our lives by lifting our sights.
Now, let’s look at the statewide corps of public school teachers. I asked the Education Policy Initiative at Carolina (EPIC) for assistance, and Kevin Bastian, EPIC’s director of teacher quality research, produced the following chart.
Characteristics of the NC public school teacher workforce:
2004-05 & 2013-14
| Characteristics | Teachers in 2004-05 | Teachers in 2013-14 |
|---|---|---|
| Count1 | 93,565 | 96,804 |
| Percentage Female | 79.78 | 79.72 |
| Race/Ethnicity Percentages | ||
| White | 82.25 | 81.73 |
| Black | 14.34 | 13.40 |
| Hispanic | 1.28 | 1.88 |
| American Indian | 0.88 | 0.93 |
| Other | 1.25 | 2.07 |
| Average Age | 40.41 | 40.10 |
| Percentage of Workforce 30 or Younger | 25.83 | 25.56 |
| Percentage of Workforce 50 or Older | 27.39 | 23.75 |
| Average Years Teaching Experience | 12.65 | 11.99 |
| Percentage of Workforce with Less than 5 Years Experience | 27.50 | 25.53 |
| Count of Beginning Teachers | 6950 | 6830 |
| Percentage of Teachers with an Advanced Degree | 28.19 | 36.12 |
| Percentage of National Board Certified (NBC) Teachers | 7.42 | 12.11 |
| Percentage of Teachers with Licenses in… | ||
| Elementary | 46.41 | 46.21 |
| Special Education | 13.09 | 13.29 |
| Middle Grades Math or Science | 10.32 | 12.35 |
| High School Math or Science | 8.18 | 9.08 |
| Routes of Preparation2 | ||
| UNC System | 37.32 | 36.32 |
| NC Private | 15.01 | 12.74 |
| Out of State | 26.67 | 28.79 |
| Teach For America | 0.14 | 0.54 |
| Visiting International Faculty | 1.26 | 0.95 |
| Other Alternative Entry | 13.02 | 14.81 |
| Percentage of Teachers Returning to Teach in the Following School Year | 90.17 | 88.27 |
1 This is a count of unique individuals paid as teachers in NC public schools for at least ½ of the school year
2 Route of preparation data is not yet complete for teachers in 2013-14 and therefore the values in the right column (Teachers in 2013-14) are actually for teachers in 2012-13 (the most recent year of available data).
You can also find a statistical profile of full-time public school personnel on the Department of Public Instruction website. The observations that follow are drawn from both charts:
- Eight out of 10 teachers are women, who are especially prevalent in elementary classrooms. There is a narrower gender gap among principals: 1,454 women, 1,005 men.
- Somewhat more than eight out of 10 teachers are white, with black teachers accounting for barely 14 percent and Hispanics below 2 percent. The racial-ethnic profile of teachers is far different from the profile of students: 51 percent white, 26 percent black, and 15 percent Hispanic.
- About one quarter of the teacher workforce is 30 years or younger, and one quarter of all teachers has fewer than five years’ experience. About one quarter of the teacher corps is 50 years and older. Thus, about half of all teachers are in the 30s and 40s. The average length of teaching experience is 12 years.
- North Carolina appears to have made significant strides in enhancing the teacher corps, at least as measured by education beyond a bachelor’s degree. Fully 36 percent of teachers in 2013-14 had an advanced degree, up from 28 percent a decade earlier. Similarly, 12 percent of North Carolina teachers have attained national board certification, up from 7 percent a decade ago.
- The data show a slight dip in teachers who graduated from North Carolina’s public and private colleges and universities. Thirty-six percent of teachers were prepared in the UNC system, 13 percent in private institutions. North Carolina teacher corps includes nearly 29 percent of teachers from out of state, and 16 percent who came through alternative pathways into classrooms.
- Of the 96,804 teachers employed in 2013-14, 88 percent returned to teach in the 2014-15 school year. The returned rate dropped nearly two percentage points from 2004-05. Trip Stallings, director of policy research at the Friday Institute for Educational Innovation at NC State University, helped me understand the significance of that data. In an email, he wrote, “The percentage of returnees is worth noting. The state needed to replace 9,197 teachers for the 2004-05 school year, but that number climbed to 11,355 for the 2014-15 school year. This increase is due in part to overall state population growth, but that does not diminish the practical problem that the state faced a hole more than 2,000 positions larger than it was 10 years before.”
One more observation: North Carolina has long been a rather centralized state – more than most states – in the funding of public education. Dating back to the Great Depression, state government assumed the core financing of teacher pay and school operations, while counties had primary responsibility for school construction and maintenance. And yet, of the 96,000 teachers, about 81,600 are financed through state government, with 6,800 teachers paid with federal funds, and 6,500 with local funds.
These statistical charts point to challenges faced by a growing state: a dependency on recruiting teachers from out of state, a less-than-robust supply line of teachers emerging from universities and a significant share of baby-boom generation teachers nearing retirement. The more urgent question before legislators and education policymakers is not so much how to rid schools of unqualified teachers as how to supply North Carolina schools with an enriched corps of highly qualified professional educators.


