If you are looking for our 1.7 million children of school age in North Carolina, here is where you will find them:
- You will find more students in homeschools than in private schools.
- You will find that if you brought together all of the homeschool students in the state, they would comprise the third largest school district, just behind Wake County Schools and Charlotte Mecklenburg Schools.
- You will find fewer students in public charter schools than in private schools or homeschools but a steady increase with the biggest jump in total numbers in the last year.
- You will find about the same proportion in private school now as you would have at other times, despite the availability of charter schools and homeschools.
- You will find the most students by far in public schools: total numbers continue to increase with the growing population but market share slowly decreases with these other options available.
Let’s explore these statements further.
Maybe you are used to hearing of our 1.5 million children. These are the children in our public schools – both in school districts as well as public charter schools. These children are the focus of discussions on adequacy of school funding and opportunity for a sound, basic education. With legislation that extends public funding to private schools, the North Carolina Supreme Court is considering the constitutional interests involved in educating children in private setting with public dollars. As a matter of policy, it will be important to be clear on what we mean – when should we only be thinking of 1.5 million children and when should we be thinking of all of our children?
1. You will find more students in homeschools than in private schools.
This is a change that occurred in 2013-14 as a result of the continuing rapid increase in homeschool attendance while private school attendance remains relatively stable. In this year, more than 10,000 additional students attended homeschool. Even before this year, North Carolina’s growth in homeschooling far excels that of the national pace. Consider these points in time:
Percent of students in homeschools
| 1996-97 | 2003-04 | 2006-07 | 2011-12 | ||
| NC | 1.2% | 3.5% | 4.3% | 4.8% | |
| US | 1.7% | 2.2% | 3.4% | 3.4% |
What explains these trends? Why are so many parents and children choosing homeschool now? This gets to the next point.
2. You will find that if you brought together all of the homeschool students in the state, they would comprise the third largest school district, just behind Wake County Schools and Charlotte Mecklenburg Schools.
In the last year in which we can compare across schooling options, here’s where homeschool students would fit among school districts.
Number of students, 2013-14
| Wake County Schools | 153,803 |
| Charlotte-Mecklenburg Schools | 144,470 |
| Homeschools | 98,172 |
| Guilford County Schools | 72.895 |
| Forsyth County Schools | 53,789 |
| Cumberland County Schools | 51,774 |
| Union County Schools | 40,797 |
| Johnston County Schools | 33,786 |
| Durham County Schools | 33,114 |
| Gaston County Schools | 31,166 |
Such a large number should also garner attention. In the first ten years that homeschools were legal in North Carolina, they represented less than 1 percent of students. Now they represent almost 6 percent.
3. You will find fewer students in public charter schools than in private schools or homeschools but a steady increase with the biggest jump yet in total numbers in the last year.
Charter schools garner 3.1 percent of all students in 2013-14 – the last year in which we can compare across all settings. This figure may be higher now based on growth over the past couple of years. Consider the following growth:
| 2013-14 | 53,655 |
| 2014-15 | 64,186 |
| 2015-16 | 77,791 |
This growth is no doubt helped by changes in legislation to lift the cap on the number of charter schools and to make it easier for existing charter schools to expand their student size.
4. You will find about the same proportion in private school now as you would have at other times, despite the availability of charter schools and homeschools.
Private schools were attended by 5.6 percent of all students in 2013-14, which reflect just slight downward turn from the 6.4 percent attendance rate at the pre-recession years. Still, since 1985-86, the selection each year of private schools has been remarkably stable, from 4.6 percent to 6.4 percent of all students.
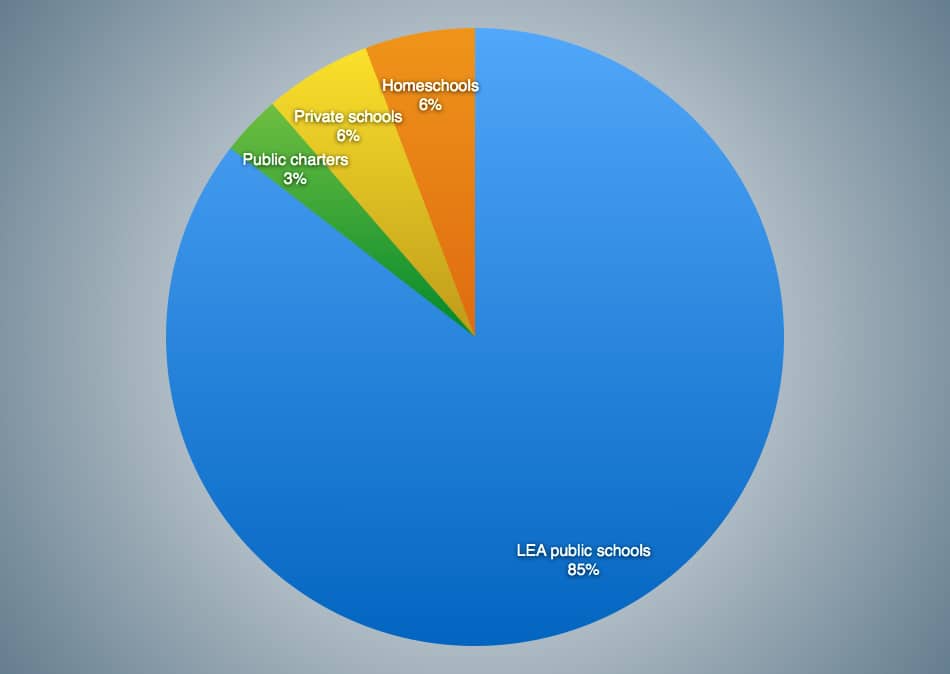
5. You will find the most students by far in public schools: total numbers continue to increase with the population but market share slowly decreases with these other options available.
Public schools continue to have by far the biggest slice of the pie – still at 85 percent – but this reflects a 10-percentage point reduction since homeschool were recognized as legal options under the compulsory attendance law. While the proportion has declined, absolute numbers continue to increase. Legislation passed in the short session to not automatically fund increases has serious implications.
Where are out students? Here is the full chart. Lots of implications. Lots more to discuss.
Market share of students in LEA public schools, public charters, private schools, and homeschools
| LEA public schools | Public charters | Private schools | Homeschools | Overall | |||||
|---|---|---|---|---|---|---|---|---|---|
| Year | Total students | % of total | Total students | % of total | Total students | % of total | Total students | % of total | Total students |
| 1985-86 | 1,080,887 | 95.0% | 55,799 | 4.9% | 809 | 0.1% | 1,137,495 | ||
| 1986-87 | 1,079,248 | 95.1% | 54,598 | 4.8% | 1,572 | 0.1% | 1,135,418 | ||
| 1987-88 | 1,079,370 | 95.1% | 53,629 | 4.7% | 1,756 | 0.2% | 1,134,755 | ||
| 1988-89 | 1,074,535 | 95.2% | 51,994 | 4.6% | 2,325 | 0.2% | 1,128,854 | ||
| 1989-90 | 1,071,843 | 95.1% | 52,083 | 4.6% | 3,206 | 0.3% | 1,127,132 | ||
| 1990-91 | 1,076,409 | 94.9% | 53,372 | 4.7% | 4,127 | 0.4% | 1,133,908 | ||
| 1991-92 | 1,086,380 | 94.8% | 54,186 | 4.7% | 5,556 | 0.5% | 1,146,122 | ||
| 1992-93 | 1,100,936 | 94.4% | 58,024 | 5.0% | 6,947 | 0.6% | 1,165,907 | ||
| 1993-94 | 1,125,028 | 94.0% | 62,300 | 5.2% | 8,927 | 0.7% | 1,196,255 | ||
| 1994-95 | 1,145,348 | 93.5% | 68,097 | 5.6% | 11,222 | 0.9% | 1,224,667 | ||
| 1995-96 | 1,167,030 | 93.2% | 71,599 | 5.7% | 13,801 | 1.1% | 1,252,430 | ||
| 1996-97 | 1,201,688 | 92.8% | 77,647 | 6.0% | 15,785 | 1.2% | 1,295,120 | ||
| 1997-98 | 1,226,060 | 92.1% | 4,106 | 0.3% | 82,001 | 6.2% | 18,415 | 1.4% | 1,330,582 |
| 1998-99 | 1,245,715 | 91.8% | 5,572 | 0.4% | 84,384 | 6.2% | 21,500 | 1.6% | 1,357,171 |
| 1999-2000 | 1,258,607 | 90.9% | 10,257 | 0.7% | 87,406 | 6.3% | 27,978 | 2.0% | 1,384,248 |
| 2000-01 | 1,274,326 | 90.2% | 14,230 | 1.0% | 89,789 | 6.4% | 33,860 | 2.4% | 1,412,205 |
| 2001-02 | 1,283,924 | 89.0% | 19,492 | 1.4% | 91,817 | 6.4% | 46,909 | 3.3% | 1,442,142 |
| 2002-03 | 1,306,153 | 88.9% | 19,832 | 1.3% | 92,314 | 6.3% | 51,571 | 3.5% | 1,469,870 |
| 2003-04 | 1,321,203 | 88.8% | 21,578 | 1.4% | 90,922 | 6.1% | 54,501 | 3.7% | 1,488,204 |
| 2004-05 | 1,345,469 | 88.5% | 24,784 | 1.6% | 91,084 | 6.0% | 58,780 | 3.9% | 1,520,117 |
| 2005-06 | 1,369,493 | 88.0% | 28,733 | 1.8% | 92,867 | 6.0% | 64,387 | 4.1% | 1,555,480 |
| 2006-07 | 1,405,455 | 87.9% | 29,170 | 1.8% | 94,785 | 5.9% | 68,707 | 4.3% | 1,598,117 |
| 2007-08 | 1,430,848 | 87.7% | 30,892 | 1.9% | 97,656 | 6.0% | 71,566 | 4.4% | 1,630,962 |
| 2008-09 | 1,441,872 | 87.4% | 34,694 | 2.1% | 96,545 | 5.9% | 77,065 | 4.7% | 1,650,176 |
| 2009-10 | 1,426,792 | 86.8% | 38,449 | 2.3% | 96,421 | 5.9% | 81,509 | 5.0% | 1,643,171 |
| 2010-11 | 1,434,436 | 86.6% | 41,314 | 2.5% | 96,229 | 5.8% | 83,609 | 5.1% | 1,655,588 |
| 2011-12 | 1,436,162 | 86.7% | 44,829 | 2.7% | 96,096 | 5.8% | 79,693 | 4.8% | 1,656,780 |
| 2012-13 | 1,493,998 | 86.1% | 48,795 | 2.9% | 95,948 | 5.7% | 87,978 | 5.2% | 1,726,719 |
| 2013-14 | 1,456,330 | 85.4% | 53,655 | 3.1% | 95,768 | 5.6% | 98,172 | 5.8% | 1,703,925 |
| 2014-15 | 1,456,119 | 64,186 | |||||||
| 2015-16 | 1,459,852 | 77,791 | |||||||
References
LEA and Public Charter School student counts are based on allotted average daily membership, available from the North Carolina Department of Public Instruction, http://www.ncpublicschools.org/fbs/allotments/support/
Private School student counts are available from the Division of Nonpublic Education of the Department of Administration, http://www.ncdnpe.org/hhh500.aspx
Homeschool student counts are available the Division of Nonpublic Education of the Department of Administration, http://www.ncdnpe.org/documents/hhh201.pdf. The numbers for 1985-86 through 1995-96 are actual numbers. The numbers for years after this are based on a random sampling of operating home schools.
National comparisons are available from the National Center for Education Statistics,http://nces.ed.gov/programs/digest/d13/tables/dt13_206.20.asp and http://nces.ed.gov/pubs2013/2013028/tables.asp