
On Tuesday, the 2017 National Assessment of Educational Progress (NAEP) data was released. This data includes the mathematics and reading test scores of over 298,000 fourth graders and 286,000 eighth graders from across the United States.
With the exception of eighth grade reading, nationwide average scores have remained relatively constant for the last decade. However, that is not the entire story; NAEP also offers local- and state-level data and breaks the data into subgroups based on demographics such as gender, socioeconomic status, and race/ethnicity.
The limitations of NAEP
While it can be enticing to make sweeping policy conclusions using NAEP data, there are a few important factors to consider:
- For the first time in 2017, NAEP testing transitioned to digitally based assessments given on tablets and laptops. Protecting trend lines to allow for comparison between years is a priority for NAEP, but there is still the possibility that students who are less acclimated to digital devices were placed at a disadvantage — especially in states like North Carolina where state law does not mandate online testing for annual assessments.
- Correlation does not mean causation. While it is tempting to leverage NAEP data to argue that a specific education policy was good or bad, NAEP data is better suited to establish correlations that can be used to build hypotheses rather than draw conclusions.
- NAEP scores are estimates based on samples of students and do not reflect entire populations. When considering year-to-year changes in NAEP scores, it is important to only consider results that are statistically significant. While North Carolina saw a two-point drop in average reading scores for fourth grade students, this drop was not significant. On the other hand, North Carolina saw a three-point drop in average math scores for fourth grade students, a difference that was significant.
- To that point, NAEP tests new cohorts of students each year. Each cohort is a representative sample from that state, but there could have been shifts in the demographics of that state from year to year. For example, a larger share of the student population may be English-language learners or low-income in 2017 as compared to 2007.
Guilford and Mecklenburg Counties
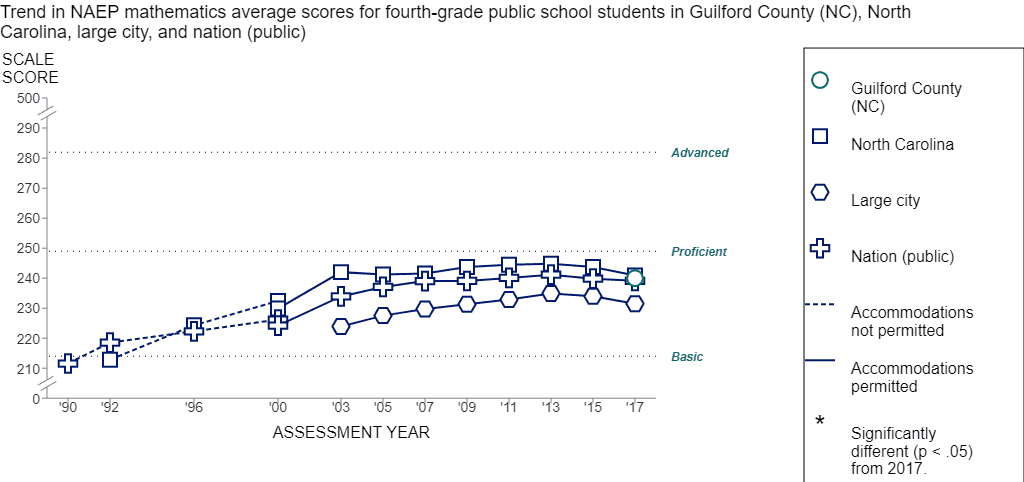
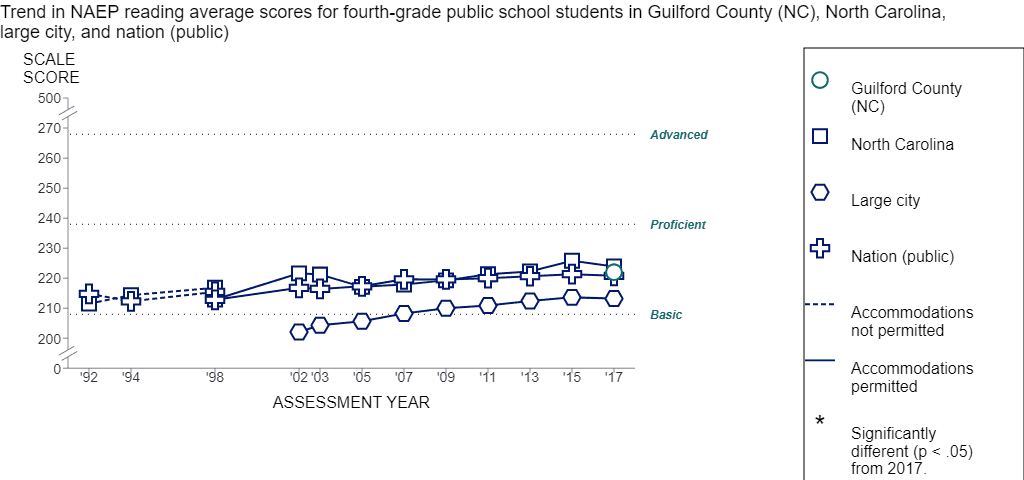
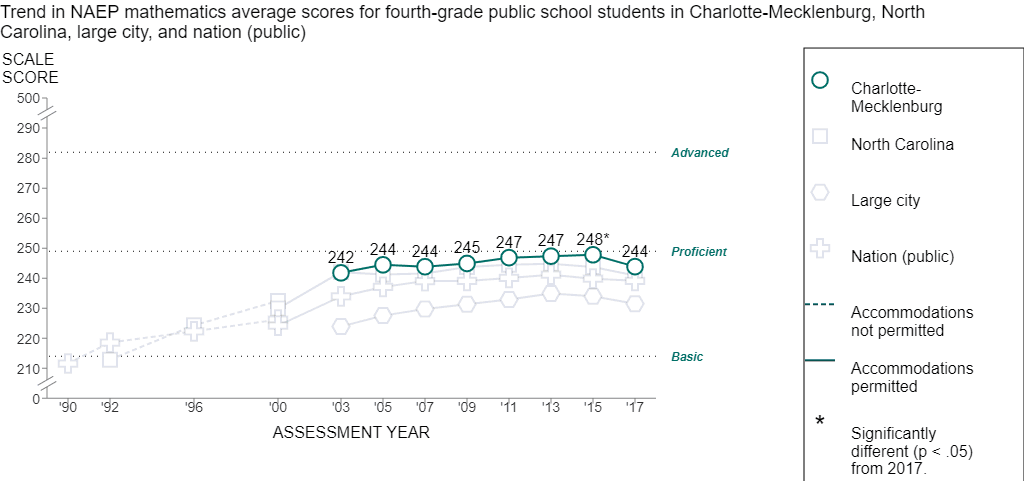
NAEP offered district-level data for Guilford County Schools for the first time this year. NAEP has offered district-level data for Charlotte-Mecklenburg Schools since 2003. This local data allows districts to compare their performance with that of students across the state, the nation, and in other large cities.
In both reading and math, fourth grade students in Guilford County Schools performed as well as their peers nationwide and statewide and better than students in other large city schools. Guilford County Schools eighth graders performed as well as students in other large cities in both reading and math but lower than their peers nationwide. Only eighth grade math scores for Guilford County Schools were lower than the statewide average.
While Charlotte-Mecklenburg Schools saw an insignificant one-point increase in eighth grade math scores, fourth grade math scores decreased by four points, a statistically significant drop. However, even with this drop, the average math score for Charlotte-Mecklenburg Schools fourth grade students is higher than that of their peers statewide, nationwide, and in large cities.
Sunshine state highlights: Florida and Miami-Dade Schools
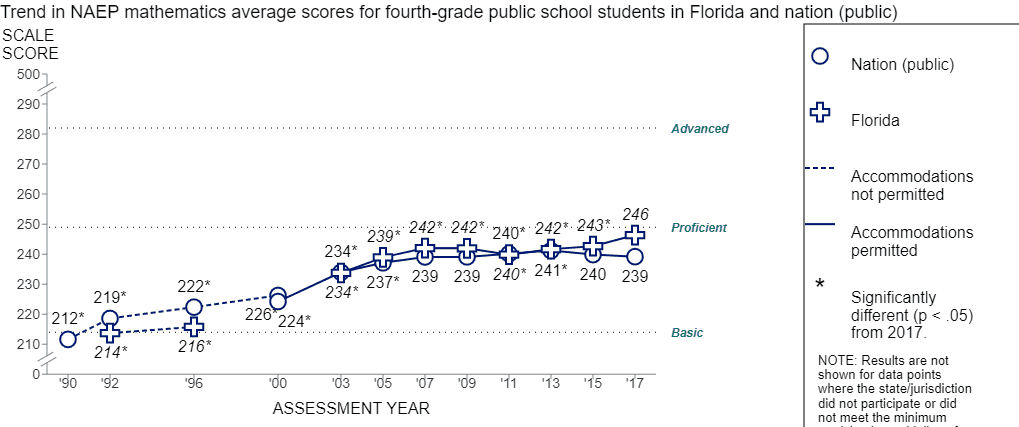
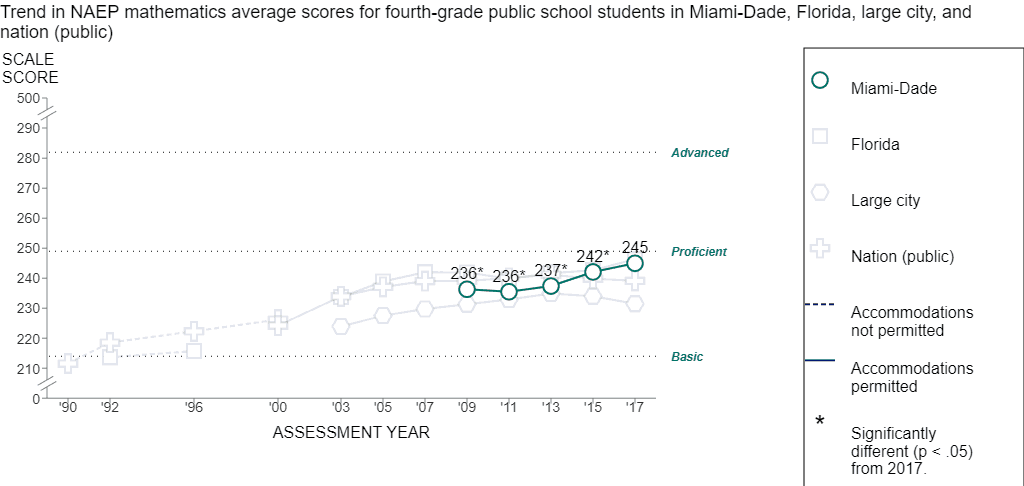
Florida was the only state where both fourth and eighth grade students scored higher on the math exam in 2017 than in 2015, and Florida achieved the highest ever fourth-grade math score since its students first took the NAEP exam in 1992.
Fourth graders in Miami-Dade County gained three points in both reading and math. With an average math score of 245, Miami-Dade County fourth graders have gained nine points since district-level data was first collected in 2009.
Black-white achievement gaps
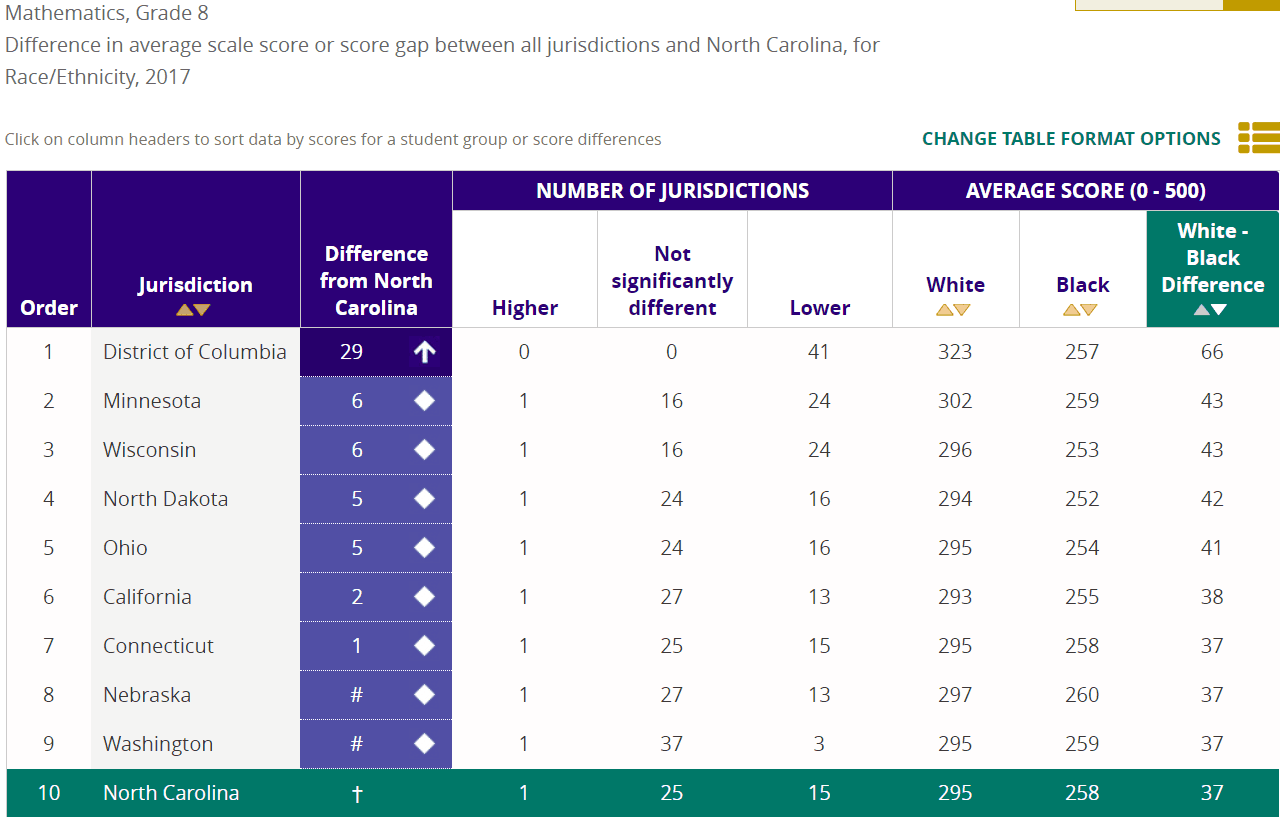
The NAEP data also allows for consideration of achievement gaps between students of different races. In North Carolina, the largest black-white difference in average scores was on the eighth grade math exam where white students scored an average of 37 points higher than their black peers. This gives North Carolina the 10th largest achievement gap for eighth grade math scores in the country.
Adjusting scores for demographic variables
A better way to compare NAEP performance between states is to use NAEP scores that control for demographic differences among students. This allows students to be compared with their peers in other states that match their demographic profile, as many demographic characteristics are correlated with test results.
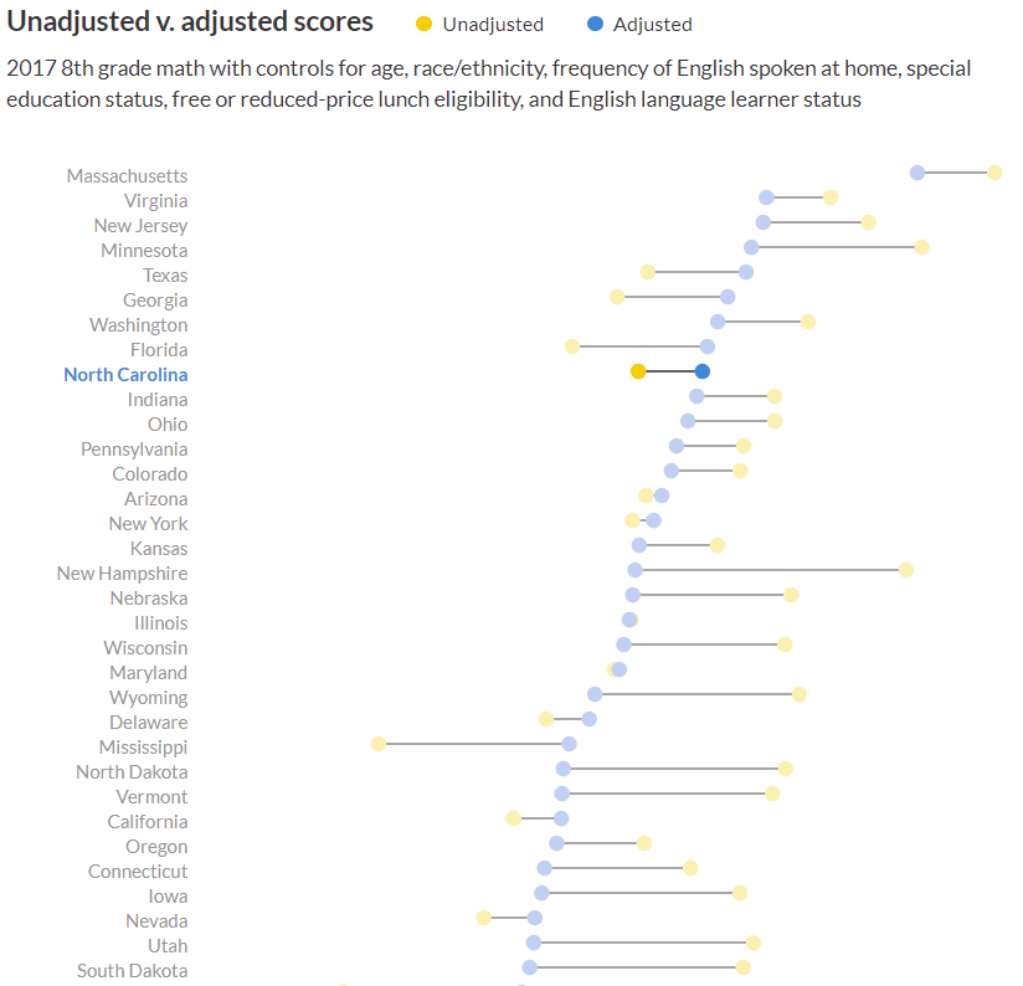
With every new release of NAEP data, the Urban Institute creates an interactive tool that shows both unadjusted and adjusted scores for each state and ranks them in order of adjusted scores. Controls in this data visualization include age, race/ethnicity, frequency of English spoken at home, special education status, free or reduced-price lunch eligibility, and English language learner status.
For example, consider adjusted (blue dots) and unadjusted (yellow dots) for eighth grade math scores. In this visualization, states like Minnesota and New Jersey have slightly lower scores after adjustment, while states like North Carolina and Tennessee have slightly higher scores after adjustment. After controlling for the demographic characteristics of students, these four states sit within mere points of one another.

Recommended reading