
These are just two of the headlines you might have seen this week following the release of the 2019 National Assessment of Educational Progress (NAEP) data on Tuesday. Also called the “nation’s report card,” the NAEP tests a representative sample of fourth- and eighth-grade students from each state in math and reading every two years. The results are the main point of comparison of educational achievement across states.
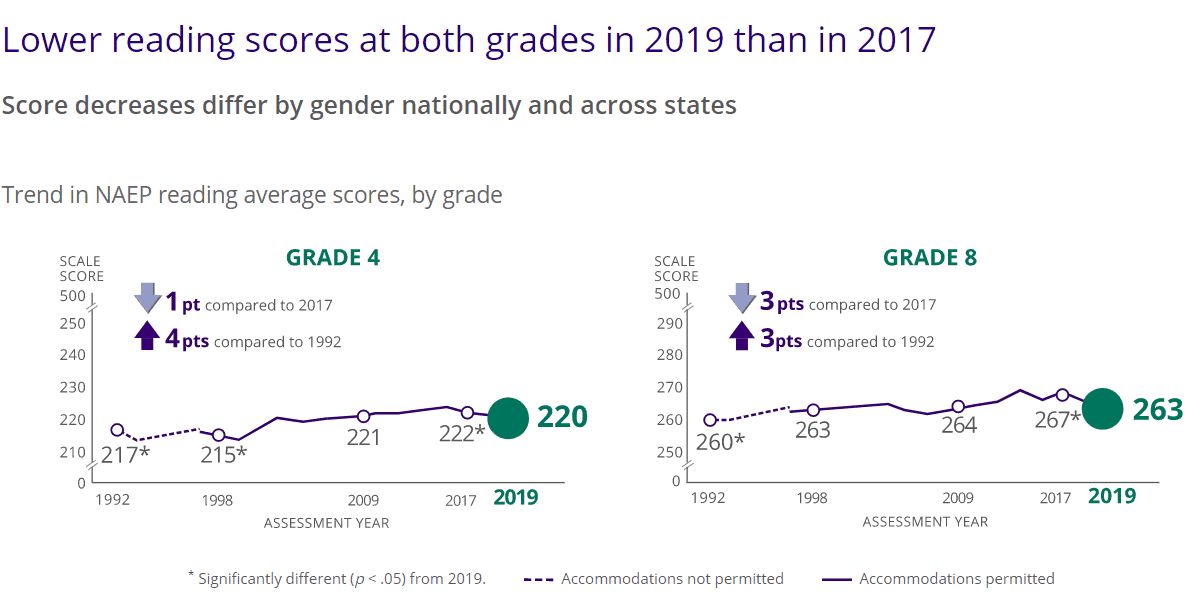
Nationally, the 2019 fourth- and eighth-grade math scores stayed relatively flat, with fourth-grade math increasing by one point and eighth-grade math decreasing by one point compared to 2017. In reading, however, the 2019 scores show declines in both fourth and eighth grade compared to 2017.
As my colleague Analisa Sorrells noted in her article on the 2017 NAEP results, there are a few things to keep in mind when looking at the NAEP results.
- The NAEP is administered digitally as of 2017. As Analisa pointed out, this could put students less accustomed to testing on computers and tablets at a disadvantage.
- Correlation does not equal causation. NAEP scores are the result of many complex, interconnected factors and should not be used as evidence that a particular education policy is working or not.
- NAEP scores are estimates based on representative samples of students, and as such it is important to note whether any increases or decreases in scores are statistically significant. As you can see in the graphs above, the 2019 eighth-grade reading score of 263 is statistically significantly different from 2017 but is not significantly different from 1998 or 2009.
- NAEP scores do not control for demographics. While the scores are taken from a representative sample of students in each state, they do not control for demographic differences between states and over time. Due to the correlation between demographic factors and test scores, the Urban Institute publishes a tool every year that accounts for demographic differences between states. Check it out here.
North Carolina’s results
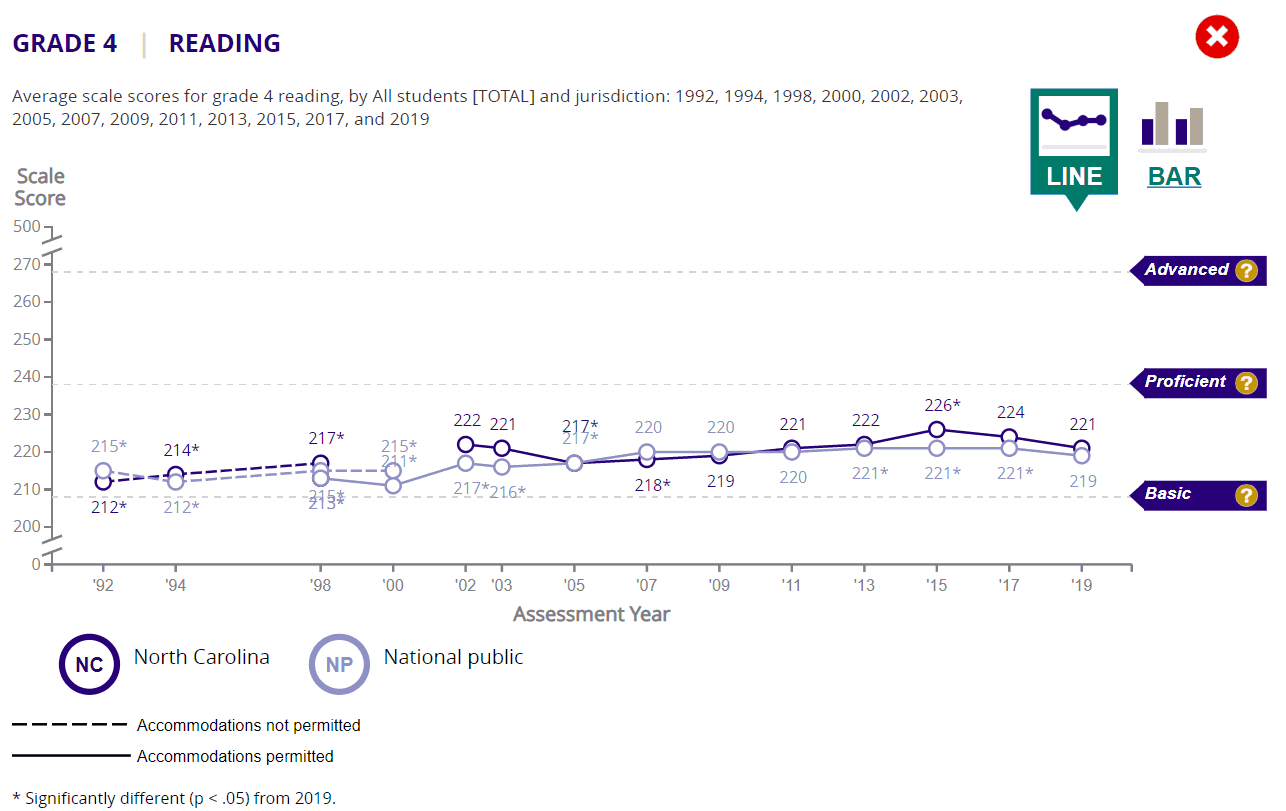
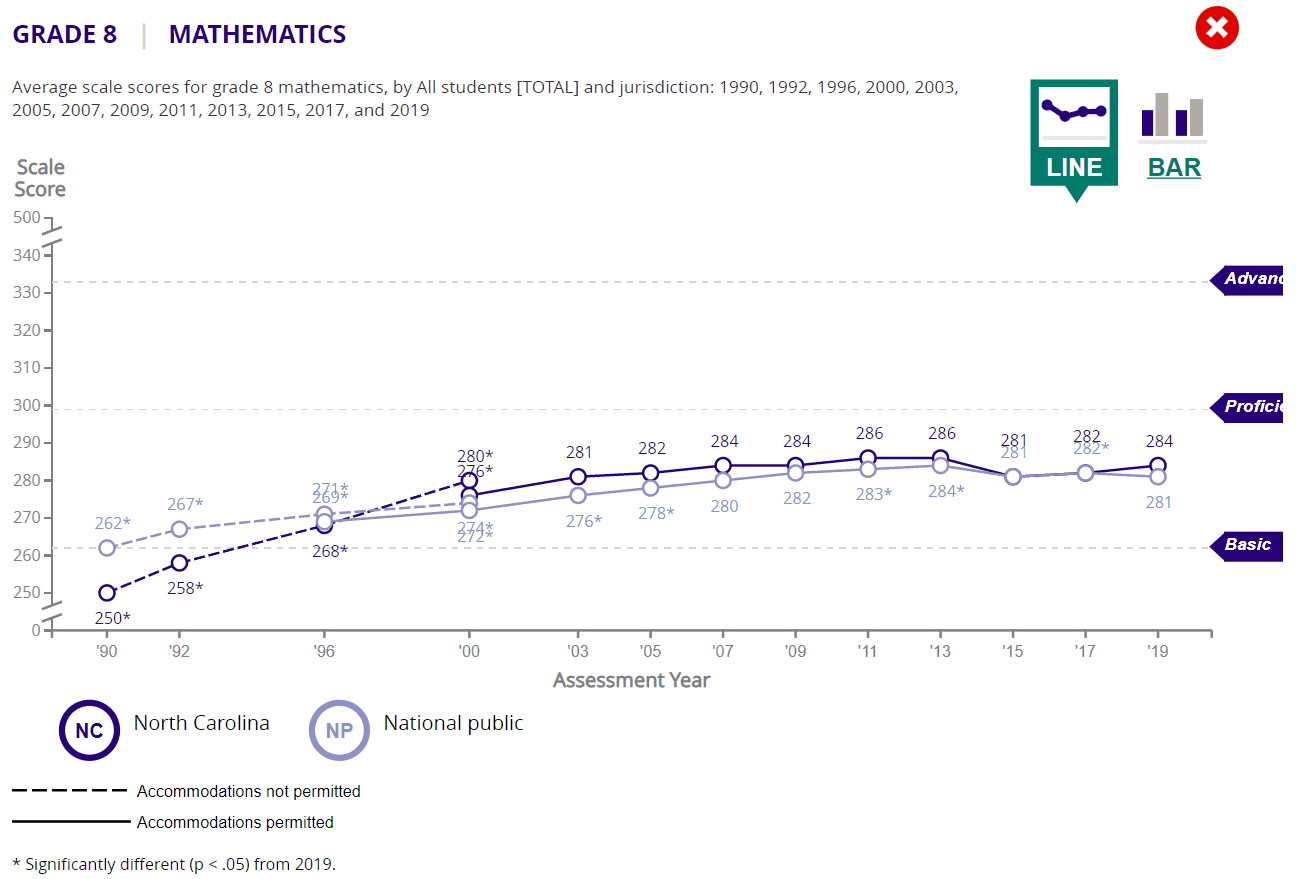
Compared to 2017, North Carolina’s fourth-grade math and eighth-grade reading scores stayed flat while fourth-grade reading scores dropped three points and eighth-grade math scores went up two points — although neither are statistically significantly different than 2017. North Carolina’s 2019 fourth-grade reading score is statistically significantly different than 2015, however, when the state scored five points higher.
North Carolina’s scores were on par with the rest of the nation in everything except eighth-grade math, where North Carolina outperformed the national average.
The NAEP also releases test scores for 27 participating urban districts, two of which are in North Carolina: Guilford County Schools and Charlotte-Mecklenburg Schools.
In both fourth- and eighth-grade math, Charlotte-Mecklenburg Schools (CMS) saw a small but insignificant increase compared to 2017. In reading, CMS’ fourth-grade score stayed flat while its eighth-grade score increased by an insignificant one point. CMS scored above both the national and North Carolina average in fourth- and eighth-grade math as well as fourth-grade reading. In eighth-grade reading, CMS scored slightly below the national and North Carolina average.
Guilford County Schools (GCS) participated for the first time in 2017, so there is less data available. Compared to 2017, GCS saw a statistically significant four-point decrease in fourth-grade math, bringing its score below the national and North Carolina average. On the flip side, GCS saw a statistically significant four-point increase in eighth-grade math scores, bringing its score to the national average although still below the North Carolina average. In both fourth- and eighth-grade reading, GCS saw an insignificant decrease.
The national picture
Among the negative headlines, there are a few bright spots nationally. Only one state/jurisdiction, Mississippi, scored higher on fourth-grade reading this year as compared to 2017 while 17 states saw a decrease. A majority of states (31) saw declines in eighth-grade reading, while Washington, D.C. was the only state/jurisdiction that saw an increase.
The picture is not quite as bleak in math. In 2019, nine states/jurisdictions scored higher in fourth-grade math, 40 states scored the same, and only three scored lower than in 2017. The nine that scored higher include Washington D.C., Oregon, Nevada, Arizona, Mississippi, Tennessee, Connecticut, Delaware, and the Department of Defense’s education system. In eighth-grade math, only three states/jurisdictions scored higher than 2017 (D.C., Mississippi, and Louisiana), six scored lower, and 43 scored the same.
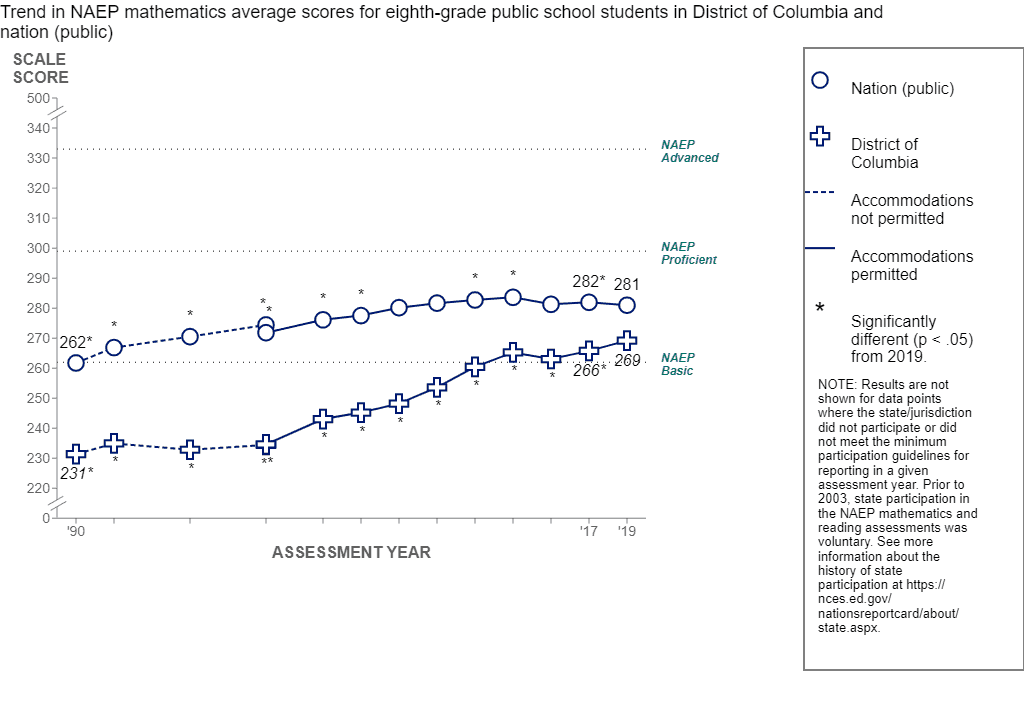
The big standout in all this data is the progress Washington, D.C. has made over the past decade in both reading and math. In the last ten years, D.C. has seen an eight point increase in eighth-grade reading scores and a 15 point increase in eighth-grade math scores. While D.C. still remains below the national average in both, the growth over the past decade has brought it much closer.
Adjusting for demographic differences
The NAEP allows us to compare student test scores across states, but as mentioned above, it does not account for the fact that states can serve very different student populations, and those differences can impact test scores. Demographic factors are highly correlated with test scores, yet when we compare state averages on the NAEP, we do not take into account these factors.
The Urban Institute publishes a tool alongside the release of the NAEP data that allows us to control for demographic factors. Doing so shows a more accurate picture of how North Carolina compares with other states.
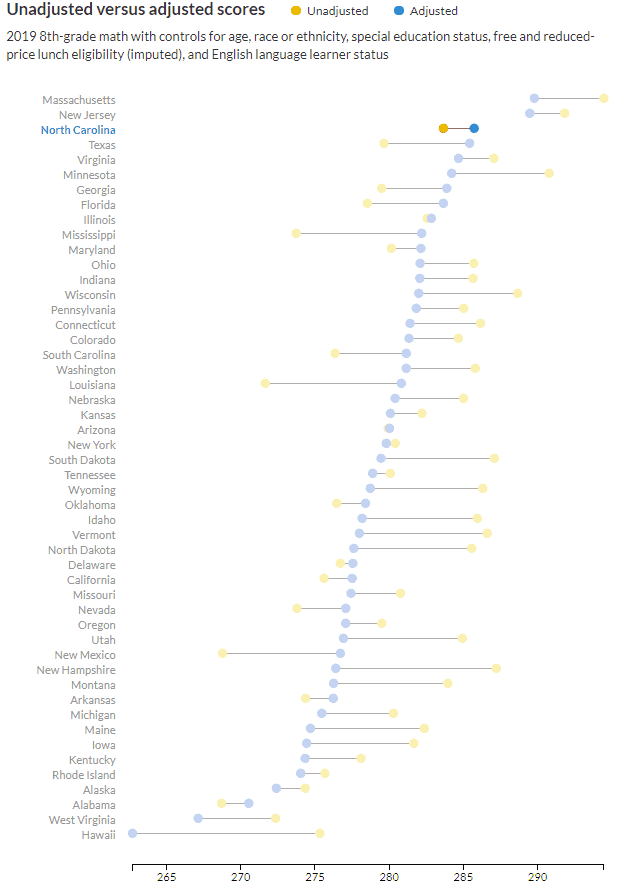
After controlling for race, special education status, English language learner status, and free/reduced price lunch eligibility, North Carolina ranks seventh highest in fourth-grade math and third highest in eighth-grade math behind Massachusetts and New Jersey. In reading, North Carolina comes in sixth in fourth-grade reading and 11th in eighth-grade reading.
In the graph below, you can see the unadjusted NAEP scores in yellow and the adjusted scores in blue. This graph shows eighth-grade math scores with controls for age, race/ethnicity, special education status, free/reduced price lunch eligibility, and English language learner status.

Recommended reading