Mapping Read To Achieve: How did districts fare last year?

Just before COVID-19 building closures and remote learning began, the Department of Public Instruction released reading proficiency data from last school year, including how many kids were proficient and the interventions used for students who were not proficient the year prior.
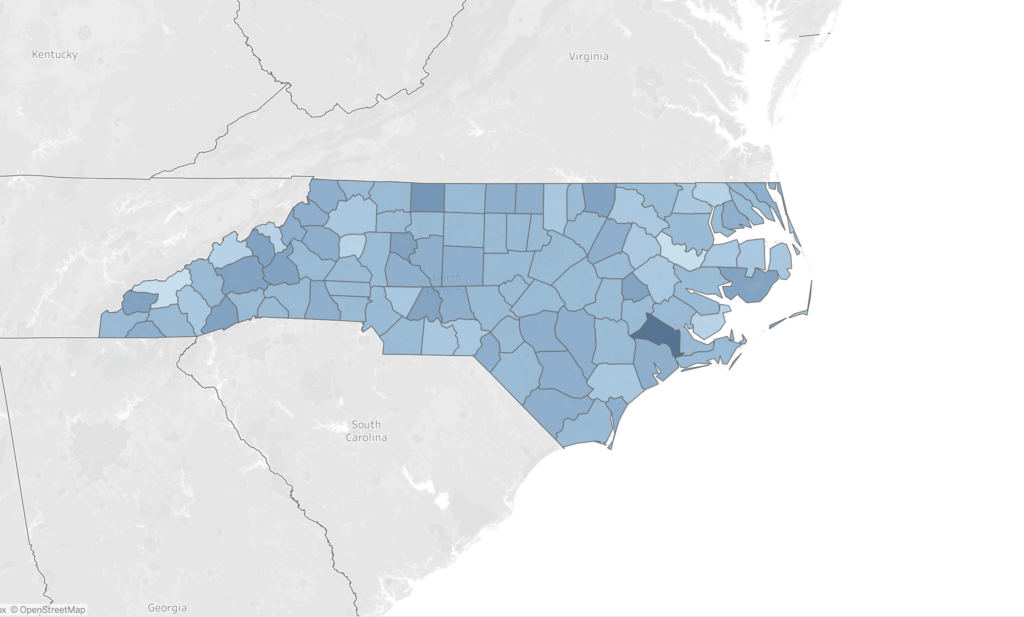
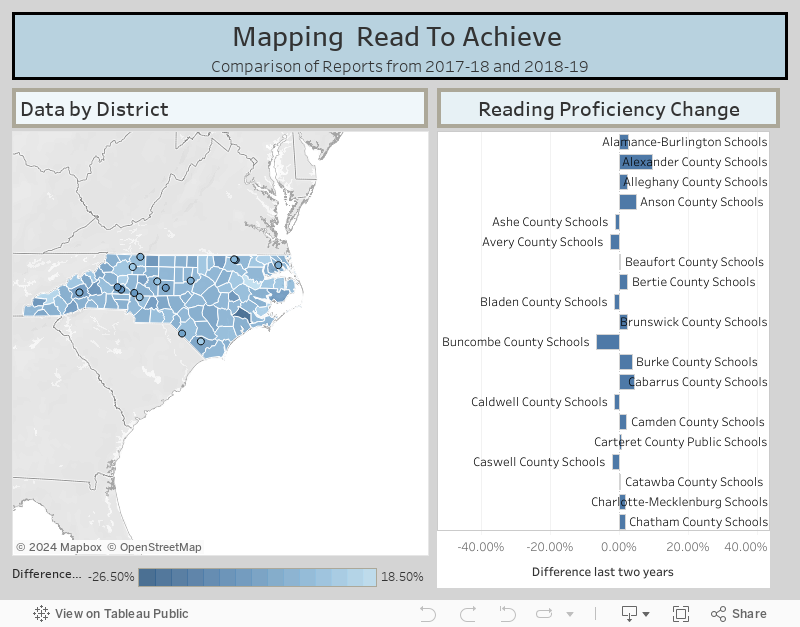
Using data provided pursuant to state law in the Read To Achieve reports for the 2017-18 and 2018-19 school years, EdNC mapped which counties saw an increase or decrease in reading proficiency, along with the interventions used in each district.
Statewide, reading proficiency crawled up a tick, rising one percentage point from 56.3% to 57.3%.
The data do have limitations.
For starters, the law requires districts to report “interventions” — typically, supports used after a student already has fallen behind. These reports do not tell us which core reading curriculum each district uses; the law does not require release of that information. While use of a strong core curriculum alone does not mean reading proficiency will rise, teachers, interventionists and advocates say that systematic, explicit core curriculum is nonetheless essential. In fact, states such as Colorado have begun vetting core curriculum and asking local districts to choose from a handful of approved material.
Another drawback from the data is lack of information about the scope and intensity of an intervention. For instance, in Mooresville City Schools the district lists both Fountas & Pinnell and HillRAP. These materials do not necessarily complement each other — one uses a balanced literacy approach and the other a structured literacy approach.
The data don’t tell us whether every school in a district used each intervention, or whether it was just some schools — or even just one. We also don’t know how intensely any of the interventions were used.
Finally, the data provide limited insight into charter school interventions, as these entities were not required to provide such information.
What the data do provide is a starting point. They let us peek into districts, and tell us where reading proficiency is up and where it is down. For example, we know that Jones County fell by more than 25% and Martin County rose by nearly 20%. For EdNC, this gives us a place to start digging for some answers.
The reports provide more information than that captured in our maps, such as retention data and the numbers of students who took alternative tests to the Beginning of Grade, End of Grade and End of Grade Retests forming the basis of proficiency data. If you missed it when it was released, the report is worth a look.