In keeping with last month’s interdisciplinary theme, I want to take a look this month at another tangential but very influential part of a student’s education experience: safety. As we established in last month’s Consider It Mapped, housing stability in a child’s home life can impact students’ education success. Whether a child feels safe at school is also important—according to research 1 on the topic, school safety can impact student test scores and learning outcomes.
Traumatic events such as violence at home or at school can have several impacts on students’ physical and emotional health. These impacts vary by age group, but generally include decreased ability to concentrate, aggression, anger, and in some cases, an interest in engaging in self-destructive, reckless behaviors. Physical symptoms such as stomachaches, headaches, pains, trouble sleeping, and reversal of developmental gains also are common. 2 All of these after-effects of experienced trauma can negatively impact student learning, potentially leading to lower test scores and lower overall achievement.
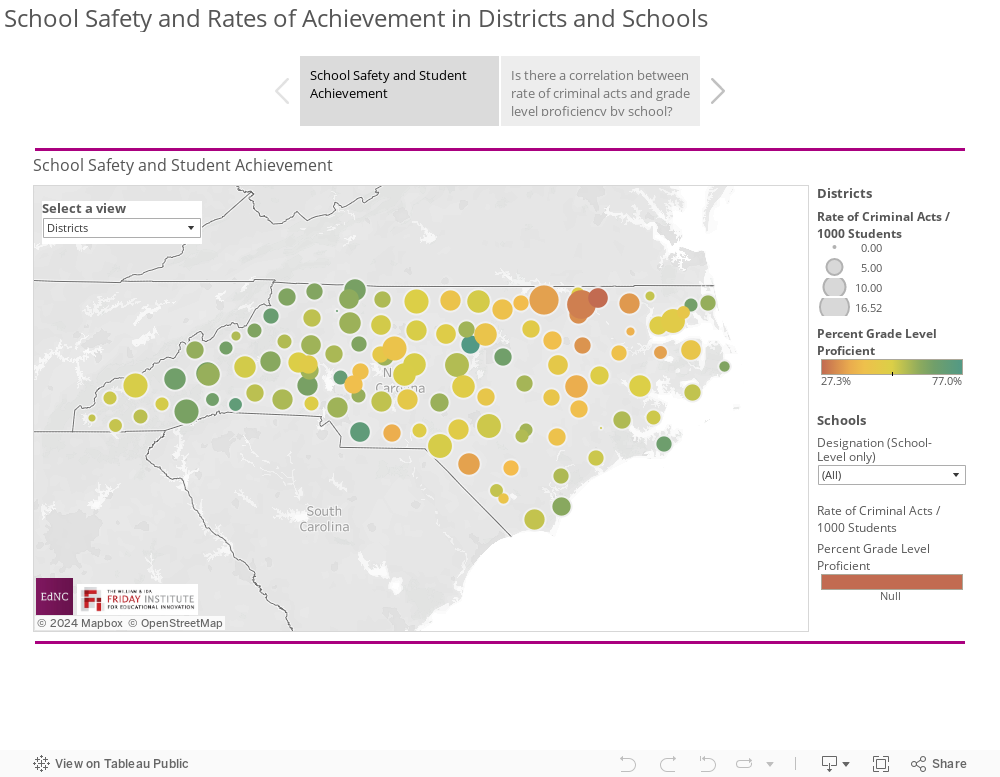
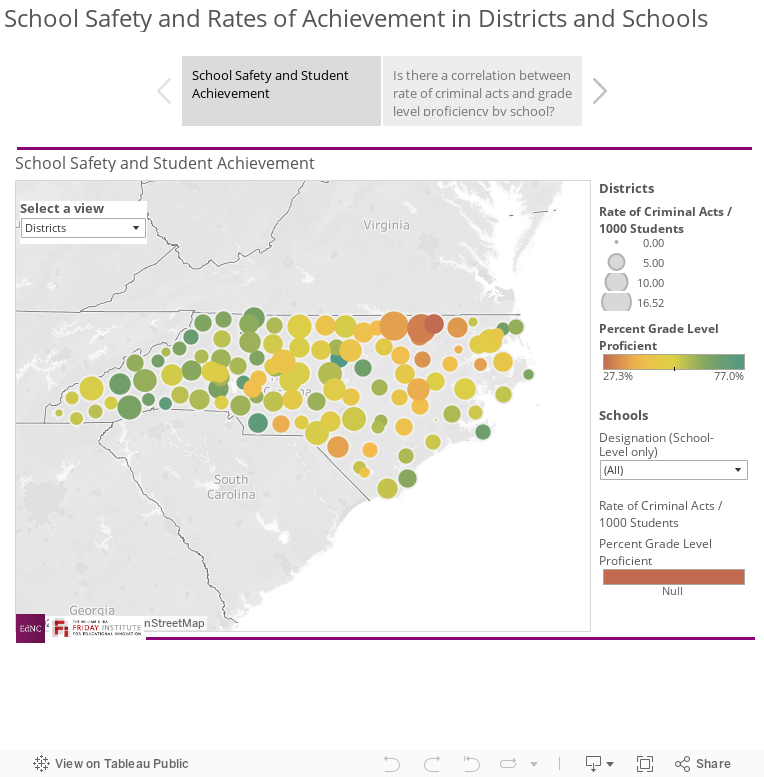
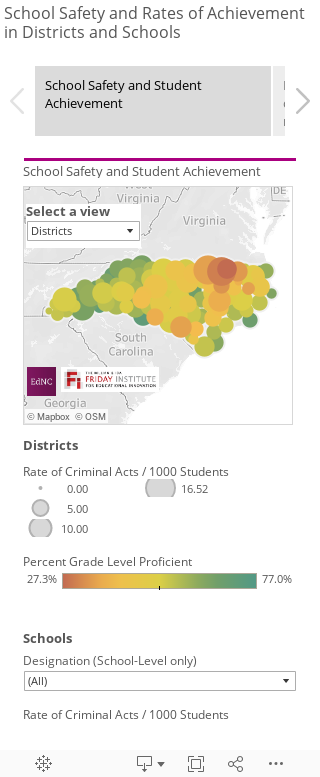
This month’s maps look at the intersection between school safety (as measured by the rate per 1,000 students of criminal “acts” that schools are required to report to the State) and student achievement (as measured by grade-level proficiency according to test scores for all grade levels). 3
North Carolina groups “acts” into 16 categories, such as possession of a weapon, possession of a controlled substance, assault resulting in serious injury, and sexual assault.4 5 Grade-level proficiency is a composite proportion of all students who scored a 3 or above on state diagnostic tests (End-of-Grade and End-of-Course). These two variables appear on the maps as the size (number of incidents) and color (grade-level proficiency) of each data circle. If you look at the school district map, for instance, and hover over the data point for Transylvania County Public Schools, you will see that the circle is a darker green, meaning that Transylvania has a high proportion of students who are grade-level proficient (64.5 percent), relative to other districts across North Carolina. The size of the circle shows the rate of criminal acts in Transylvania, with an average of 11.2 acts per 1,000 students for the 2014-15 school year. The size of the circle is relatively large compared to other districts, meaning that there are more incidents in the Transylvania school system per 1,000 students than in other districts across the state, but the color of the circle suggests that Transylvania students are succeeding in spite of the relatively high number of reported criminal acts.
Overall, while there is some variation in grade-level proficiency at the district level (i.e., the color of circles), there is less discernable variation in the rate of incidents (i.e., the size of circles).
Adjusting the map to show individual schools captures variations within school districts and tells a slightly different story. The map allows you to look at data for four different types of schools—traditional public schools, charter schools, schools designated as “alternative education” (typically, schools expressly for students with chronic behavioral issues), and schools expressly for exceptional children—but to begin, let’s consider a map with only traditional school data. To view data for traditional schools only, use the “designation” filter on the map and check only the box beside “traditional.” The resulting map appears to be characterized by a lot of yellow(ish), mid-sized circles, indicating that the majority of schools have average levels of grade-level proficiency and average rates of criminal acts, relative to all traditional public schools. There are, however, a number of schools that are characterized by small green circles (high proficiency, few instances of criminal acts), leading one to conjecture that schools with higher numbers of students who are grade-level proficient also have lower rates of criminal acts.
But is this really the case? To take a closer look at the relationship between grade-level proficiency and rates of criminal acts in traditional public schools, I correlated the two variables (remember, correlation does not equal causation, as I explained in this earlier article about National Board Certification) and found a slightly negative correlation between rates of criminal acts and grade-level proficiency, suggesting that higher rates of acts are, indeed, correlated with lower rates of student achievement. But this result alone could be misleading. Note that much of the distribution of schools is in a shapeless cloud on the left side of the chart, meaning that, at schools with lower rates of criminal acts, the proportion of grade-level proficient students is highly variable, ranging from very low rates of student proficiency to very high rates. So, while it might appear at first glance that rates of acts and of student proficiency may be at least somewhat related, we would need to conduct a more in-depth analysis to confirm the relationship. For now, the most we can say is that results from a small number of schools appear to be influencing this negative correlation.
When I originally created the individual school-level map, I did not separate the schools by school type, but I quickly realized that the rates of criminal acts in alternative and exceptional schools overshadow the rates in traditional and charter schools. Because the size of each circle on the map is generated relative to all other circles (i.e., the size is not fixed; it grows or shrinks based on values for the other schools included on the map), when special designation schools are included on the map that, by virtue of the student populations they serve, report much higher rates of criminal acts, differences across more traditional schools are very hard to see.
To see what I mean, use the “designation” filter to choose all four types of schools. If you select all of the school types, the alternative and exceptional schools feature more prominently; the variation across traditional public schools is only evident when only traditional schools are displayed. In the map of all schools, it is easy to see that the alternative and exceptional children’s schools stand out as larger red circles relative to the rest of the schools across the state. These schools have high rates of criminal acts and low proportions of students who are grade-level proficient.
So what does all of this mean? As an outsider with limited knowledge of all of the school systems across North Carolina, it appears that most traditional public schools trend toward the middle in terms of achievement and safety. What I find more compelling (although not surprising) are the higher rates of criminal incidents and lower rates of achievement at our state’s alternative education and exceptional children’s schools. Building on what I wrote last month, these data make me want to learn more about the possible reasons behind these rates by applying an interdisciplinary perspective. I’m not an expert in this area, but I would love to hear from those who are; my instinct is that students who have been re-assigned to these schools from their base schools are facing more than just the usual assortment of within-school academic and behavioral challenges. If these students are struggling with unstable home lives and trying to overcome other hurdles, is there a way to bring experts from different fields together to find holistic solutions that more directly benefit students, as well as the communities where they live?
While I know that for many of you this month’s information is neither new nor perhaps even surprising, I hope the maps this month help you to view it with a fresh perspective. How can you work with your peers across fields and educational philosophies to ensure the safety and wellbeing of students across our state? If you have ideas, share them with us below in the comments or on Facebook and Twitter.
About the author