In last month’s feature of Consider It Mapped, we discussed Free and Reduced-Price Lunches, or FRL, and the pros and cons of using this measure as a proxy for student need in North Carolina. That discussion not only explained some of the details behind a generally accepted measure for poverty, but also set a baseline against which to compare a new approach for determining eligibility for the National School Lunch Program (NSLP) and School Breakfast Program (SBP) — the Community Eligibility Provision (CEP).
This month, we look at what the CEP is, how it differs from traditional calculations of FRL, and how it could change the way we measure student need. Most importantly, we consider whether it is likely to have a positive or negative impact on districts’ ability to provide lunches for students in need.
Remind me: Why do we use the number of students who receive meal assistance as a measure of poverty?
I detailed this more thoroughly in last month’s Consider It Mapped, but in general, all schools must have school-level data on economically disadvantaged students to determine their eligibility to receive Title I funding and to allocate this funding to schools in need. For many schools and districts, the number of students enrolled in school meal programs provide the best estimate of students in need, and so this measure is often used to report student poverty. Free and reduced-price lunch eligibility currently is the most widely-accepted and uniform measure of student poverty.
What is the CEP, and how does it determine eligibility?
As mentioned in last month’s article, the CEP estimates a school’s need based on measurable community factors. As a result, it eliminates the need for families to submit applications for their students to receive free or reduced-price meals. In addition to reducing the amount of paperwork necessary to determine eligibility, this approach could also help reduce the number of students who should be eligible for assistance but who are not receiving it because of a failure to file for eligibility. Schools are not required to participate — they can continue to follow the current student-by-student approach for determining eligibility — but there are some advantages to adopting the CEP approach that may make it appealing for some schools.
| Traditional Free & Reduced-Price Lunch (FRL) program | Community Eligibility Provision (CEP) | |
|---|---|---|
| How are student meals subsidized? | Students can receive meals at a free or reduced rate if they are eligible. Otherwise students have to pay for school meals. | All students are eligible for free meals. In schools that opt into the CEP, free lunch is available and offered to all. |
| How is eligibility determined? | Individual household applications | Direct certification, which is a process that pulls students in need from external databases related to household poverty. |
| Who is eligible? | Students from households with incomes at or below 130 percent of the poverty income threshold receive free meals, and students from households with incomes above 130 percent but below 185 percent of the poverty threshold receive reduced-price meals. Some students are covered under direct certification and are not required to submit applications. | Students identified under direct certification, which pulls students in need based on eligibility for Federal programs (SNAP and TANF for instance), and students characterized as homeless, runaways, migrants, and Head-Start eligible. A full list of eligible students can be found on page 3 of the Community Eligibility Provision: Department of Education Title I Guidance. |
| Is there a threshold a group of schools or district must meet to participate in the program or provision? | No, all schools and districts are invited to turn in paper applications. | Yes, to participate in the CEP, groups of schools and districts must have at least 40 percent of students directly certifying for free meals. |
| How is reimbursement for free or reduced price meals calculated? | Percentages eligible for free or reduced price meals are calculated by school through individual household applications. Reimbursement rates are based on aggregated percentages from these applications. | Percentages are calculated by school through direct certification. The percentage determined through direct certification is then multiplied by 1.6 to capture any students who may not qualify for free meals, but would have qualified for reduced-price meals based on the application system. A district is reimbursed at the free rate for the percentage of students directly certified multiplied by 1.6. If this percentage is less than 100, the district is reimbursed at the paid rate for the remaining percentage. |
| Advantages | -Best available measure of individual and school-level student poverty.
-Commonly accepted measure that has been used for many years. |
-If direct certification is calculated for all schools, there would be a common estimate of school-level need for all schools that is not dependent on parents/guardians opting into free meals.
-Saves time in not having to process individual applications. -Possible misrepresentation would be less likely. |
| Disadvantages | -Potentially inflates the number of students in need.
-Possible misrepresentation (those who opt into the program may not be in need, and those who are in need may not opt into the program). |
-Potentially inflates the number of students in need.
-Still may have to process individual applications and direct certifications together as not all schools and districts will opt into CEP. -Will no longer have a measure of individual student poverty. |
Under the new provision, schools that opt in to the CEP must provide free meals for all students — regardless of the number of students who would qualify based on individual family financial circumstance. Districts are then reimbursed for these costs based on a process called “direct certification.” Direct certification involves counting the number of students who are eligible for other Federal programs, such as the Supplemental Nutrition Assistance Program (SNAP) and Temporary Assistance for Needy Families (TANF), as well as students who are identified as homeless, runaways, migrants, or Head-Start eligible. (For a full list of directly certified students, see page 3 of this document). Schools are eligible for the CEP if the direct certification process identifies 40 percent or more of their students. Schools that opt in under CEP then provide free lunch for all of their students. Districts that do not meet the 40 percent threshold still can use the traditional per-family paper application process for determining individual student eligibility for free or reduced-price meals.
To determine a district’s reimbursement under CEP, the final tally of directly certified (identified) students is multiplied by 1.6. The multiplier assumes that direct certification does not capture all students who should be considered eligible. For example, while the direct certification method will identify most of the students who would have been eligible for free meals under the old provisions, it potentially could miss many students who would have qualified for meals at the reduced rate. Reimbursement rates are based on the size of the identified eligible population after the multiplier is applied. If, for instance, direct certification determines that 60 percent of students are eligible, this number is then multiplied by 1.6, resulting in 96 percent, and the CEP will cover lunches for 96 percent of students at the free federally subsidized rate for a school with that proportion of identified students. The other 4 percent of students must be provided free meals as well, at district expense, but the district is partially reimbursed for those meals, too, at a lower rate (called the “paid rate”). The table below illustrates the difference in reimbursement rates for lunches.
| National School Lunch Program Reimbursement Rates effective July 1, 2014 – June 30, 2015 | ||
| Student Lunch Category*◊ | Less than 60 percent eligible** | 60 percent -100 percent eligible |
| Paid | $0.28 | $0.30 |
| Free | $2.98 | $3.00 |
| *Alaska and Hawaii have different rates of reimbursement | ||
| **Lunches served by school food authorities in which less than 60 percent of lunches served in the school lunch program during the second preceding school year were served free or at a reduced price. | ||
| ◊ School food authorities certified to receive performance-based cash assistance will receive an additional 6 cents (adjusted annually) added to the above amounts, yielding the maximum rate. Certification is achieved by being in compliance with meal pattern and nutrition standard requirements put forth by the State; those that meet requirements receive the boost in each of the above categories (raising the paid rates, for example, to $0.34 and $0.36). | ||
| http://www.fns.usda.gov/sites/default/files/cn/NAPs14-15.pdf | ||
Under the CEP, districts can re-assess eligibility every year if they wish, without risk: even if the re-assessment reveals a lower number of eligible students, the eligibility level from the first year is retained, for up to four years. This stability is advantageous for schools in a number of ways: it can save time (if they opt not to re-calculate eligibility each year), it allows schools with typically highly variable rates of eligibility year-to-year to keep their numbers at the higher level for reimbursement, and it makes financial planning easier, since a district knows what its reimbursement will be for several years in a row.
At the school and district levels, the proportion of identified students may be used as a proxy for poverty, with some of the same advantages and disadvantages outlined in last month’s article about FRL. This month’s map focuses on ways in which student need can be measured using the CEP and how these measures compare with the latest FRL percentages for 2014-15.
At a state or national level, measurement of student poverty potentially could incorporate CEP estimate in one of two ways:
- Poverty rates for districts with proportions of identified students over 40 percent could be based on the CEP’s direct certification process, and poverty rates for districts with proportions of students below 40 percent still could be based on the previous method (tallying individual household applications).
or
- Student poverty levels could be identified via the CEP’s direct certification method, regardless of whether a district opts in to or even qualifies for the CEP.
Using data from the North Carolina Department of Public Instruction (NCDPI) on FRL rates for 2013-14 and 2014-15 (which includes the CEP direct certification results for some schools) we can map the first scenario above. Unfortunately, because direct certification rates are not currently public for all schools, we cannot map estimates for each district. Because it would provide a uniform measure of poverty statewide, we recommend that the state consider sharing CEP eligibility regardless of district interest in the program, so that we can continue to have a way to directly compare poverty data across districts.
Mapping methods and interpretations
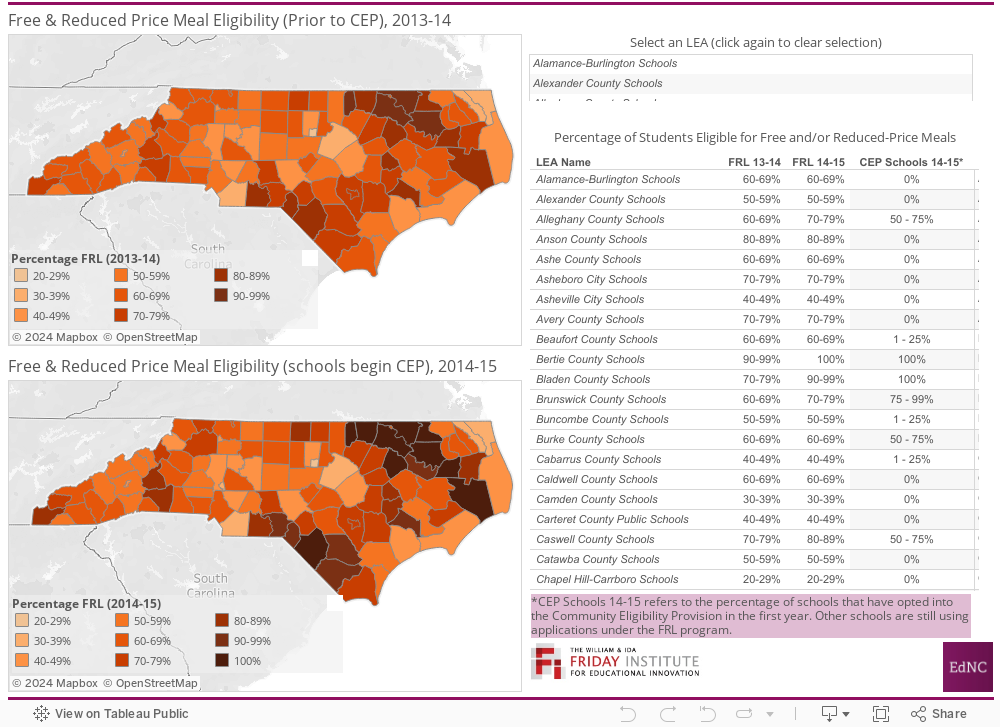
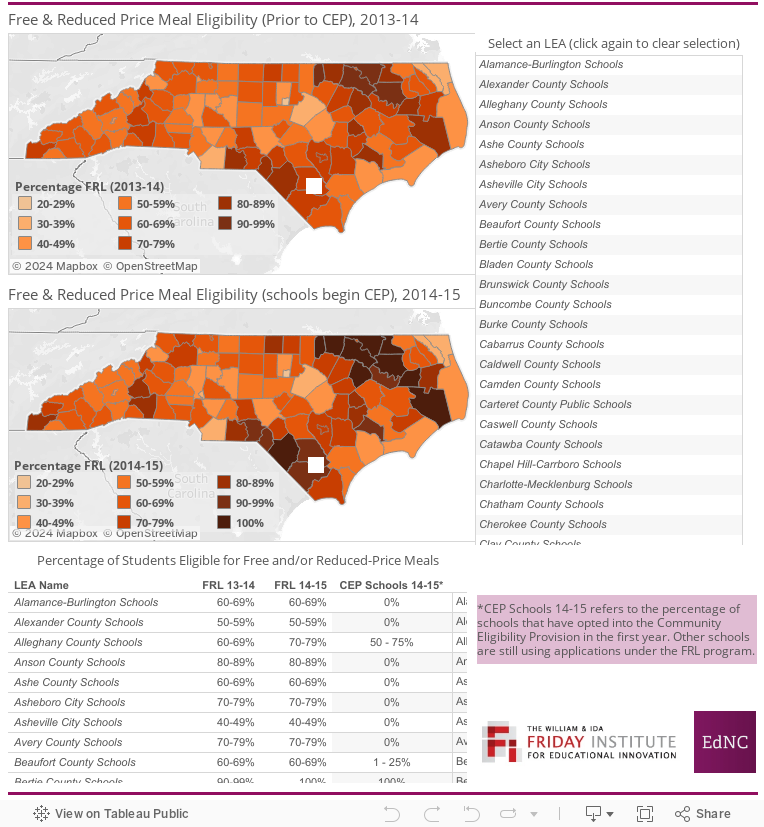
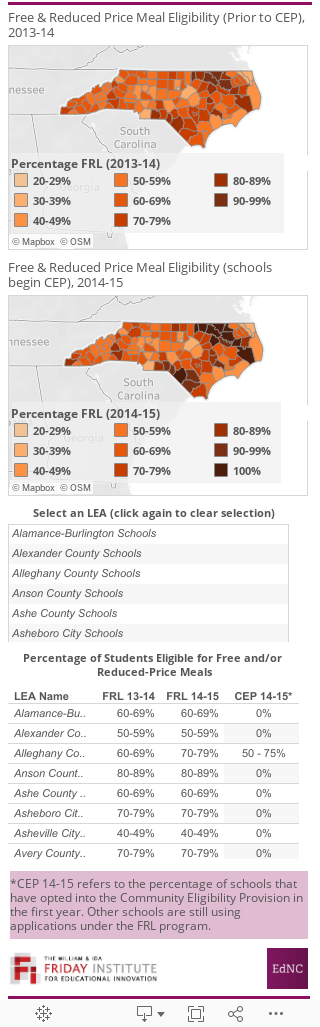
To create the first map, I used the FRL 2013-14 and 2014-15 datasets from NCDPI. The 2014-15 dataset includes schools that are continuing to use the traditional eligibility application process to identify students in need, as well as schools that are opting into CEP. For each of the CEP schools, I applied the 1.6 multiplier before aggregating all schools to the district level for estimates by district. An example of the method I used is on page nine of this guidelines document.
The first map shows FRL rates for the 2013-14 school year right before the CEP was introduced. The second map shows rates for the 2014-15 school year and reflects the introduction of the CEP into some or all of the schools in 57 districts. The accompanying table shows percentages of students eligible for free and/or reduced price meals over time as well as the percentage of schools that have opted into the CEP program in the first year, by district.
One of the major takeaways from this map is that, in many districts, as higher percentages of schools opt into the CEP, districts receive coverage for more students. There are also many districts in which the percentage of students identified as being in need under the CEP is on par with the percentage of students in need before the CEP was introduced. While none of the districts lost eligible students with the introduction of CEP, this is also a potential scenario. This scenario may indicate that it would be better for a group of schools within the district to opt in to the CEP, and that a group of schools should continue submitting applications for free and reduced-price meals on a per-student basis so that each school is covering the populations that need assistance. The comparison is limited to two school years only, but thus far, the CEP direct certification process appears to be a relatively good substitute for application-based FRL for most districts.
Considerations
In many cases, when direct certification identifies a high percentage of eligible students, a district will likely opt into the provision, especially in districts where the percentage of identified students is estimated to be 62.5 percent or higher (schools with 62.5 percent of identified students will be reimbursed for 100 percent of meals at the free meal rate since the percentage combined with the 1.6 multiplier is 100 percent).
However, schools that have identified student percentages near the 40 percent mark may have more to consider before opting into the CEP. If a school has 40 percent identified students, the school will be reimbursed at the free rate for only 64 percent (40 percent x 1.6) of its meals, but will still have to provide free lunches for all students. In this scenario, the reimbursement rate for the remaining 36 percent would only be at the lower rate (the “paid rate” in the table above). Opting in to the CEP means a district must calculate if it is willing or even able to cover the costs for non-eligible students.
Also, it is important to note that the move toward the CEP approach will impact those who use FRL as a proxy for need. Is it more appropriate to use the combination of FRL and CEP values or the direct certification measure only to approximate need in each school and district?
Finally, and perhaps most importantly, it is important for parents not only to be informed of but also to understand the changes in the free and reduced-price lunch program and how those changes might impact the services provided by their children’s schools.
We will be following the roll-out of the new provision across the state and the impacts of the program closely as it nears the middle of its first year.
Do you have first-hand experience with the Community Eligibility Provision or thoughts that you’d like to share? Give us a shout!
About the author