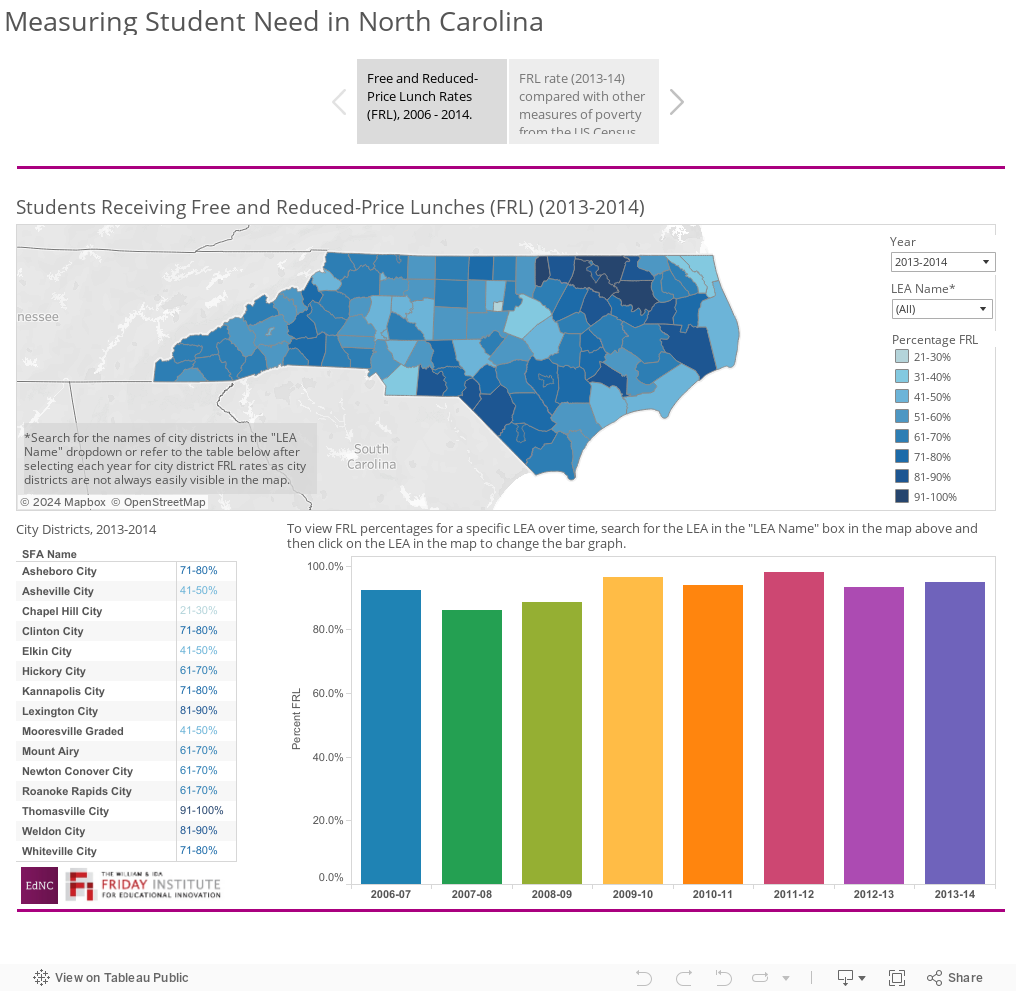
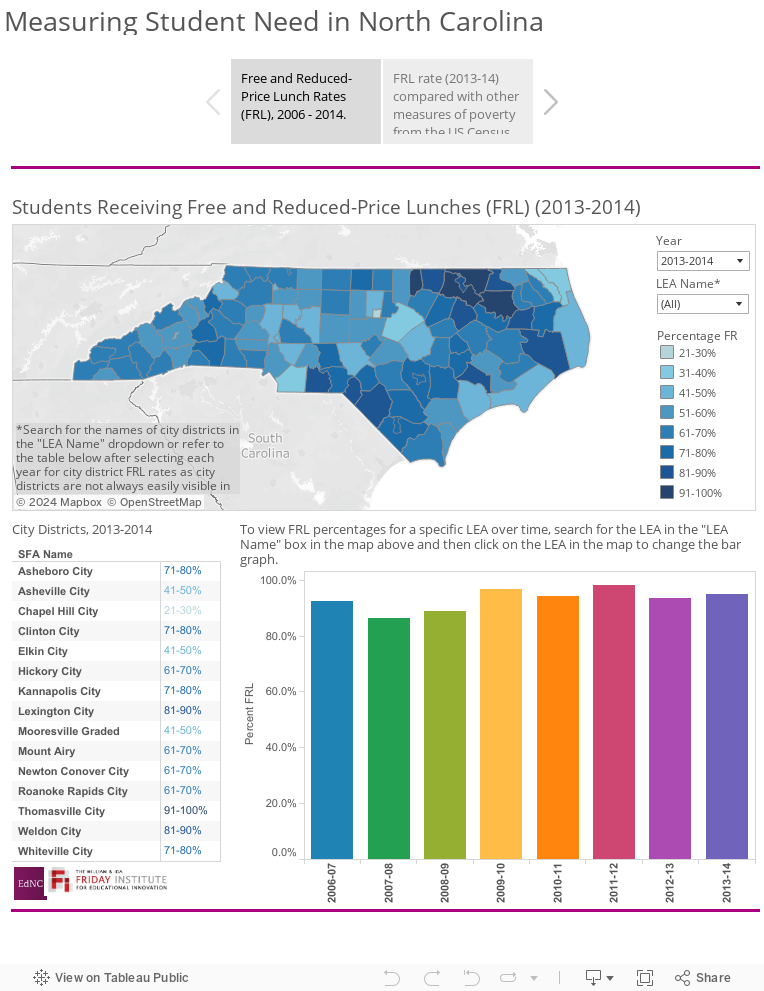
The proportion of students in a school who opt into the federally-funded National School Lunch Program (NSLP) to receive free or reduced-priced lunches (FRL) has long been used as a proxy for poverty in North Carolina and most other states. Many education leaders and researchers (including me) have grown so accustomed to using this measure that it is sometimes easy to forget that FRL rates and poverty are not exactly the same thing (see maps in the second tab, above). This month’s maps show the historical trajectories of FRL rates by school district over time, as well as a comparison of the most recent FRL rates with county-level poverty rates as calculated by the U.S. Census.
Before the 2014-15 school year began, North Carolina opted into a new approach for identifying students eligible for free or reduced-price lunches. The approach is called the Community Eligibility Provision (CEP), and it either already is or will soon become the standard in most school districts.
Because the CEP is the first major change in decades in how we determine eligibility for our most important measure of school-level poverty, we decided to make exploration of this new measure and how it compares to previous approaches the focus for Consider It Mapped for the next few months. For this month, to lay the groundwork for future entries, we consider some basic questions about the FRL program before the implementation of CEP:
1. How has eligibility for FRL traditionally been determined?
The National School Lunch Program (NSLP) enables students to purchase full-price lunches at school regardless of family income by providing partial to full coverage of the cost of lunch. Eligibility is determined by identifying how close a student’s family’s income is to the federal income eligibility guidelines for a family of a given size. Students from households that have an income at or below 130 percent of the poverty income threshold—that is, households in which total income is 1.3 times or less the amount the federal government defines as living in poverty—can receive free lunch, and students from households that have an income above 130 percent but below 185 percent of the poverty income level can receive lunch at a reduced rate.
In most cases, to register a student for eligibility, an adult household member must fill out an application and return it to the student’s school. Information includes names of household members who contribute to household expenses and the amount and source of income received by each.
Some students are eligible for free meals without submitting an application through a process called direct certification. Direct certification allows school personnel to identify eligible students in households that already receive federal assistance (through the Supplemental Nutrition Assistance Program [SNAP] and Temporary Assistance for Needy Families [TANF], as well as students registered as foster children who are the legal responsibility of a social services agency or the court). These students are automatically eligible for free lunch.
2. Why are FRL rates used as a proxy for poverty in schools?
The poverty rate for children under 18 as measured by the U.S. Census Bureau is available only at the county level, not at the school level. In addition, while many school district boundaries in North Carolina align with defined county boundaries, there are a number of districts—charter schools and the 15 city districts—that do not. The Census does have smaller geographic designations, but none match school or school district boundaries. Simply stated, the FRL rate is the most reliable approximation of school-level poverty currently available; while it is not a perfect assessment of student poverty (see below), it is a reasonable gauge of a school’s poverty level.
3. Is the FRL rate an accurate measure of student poverty?
This article from the National Center for Education Statistics and this article from National Public Radio explain some of the advantages and pitfalls of using FRL as a proxy for poverty. In sum:
- Advantage: Best Available Approximation. Proponents of using FRL as a proxy for poverty believe that it is the best measure we have available and that this measure has proven a useful approximation when “predicting student outcomes,” according to the NPR piece linked above. Further, as mentioned, the Census Bureau measures poverty at the county level, but not at the school or district level, and there are no Census-defined boundaries that align with these designations. Getting poverty data at the student and school level is difficult and would put more of a burden on parents who may not want to provide additional information. Capturing the actual rates of students in poverty by school would also be costly for schools in that they would have to create protocols to collect and process the data.
- Advantage: Consistency. Other supporters of using FRL in place of poverty rate point out that the measure has been collected for years and provides ample historical data for analysis of the program or analysis in conjunction with other variables. Further, FRL is a widely accepted measure partially for its consistency. Researchers and policymakers alike understand the importance of reliable and consistent program data that has been measured in the same way for many years.
- Disadvantage: Likely Overestimation. Some critics of using FRL rate as a measure of poverty argue that FRL overestimates, as the rate includes those living in households above the poverty line because of the way thresholds are calculated (for example, students receiving free lunch can be in households with income at 130 percent of the poverty level). Therefore, while FRL rates are relative to poverty, they are not a direct measure of poverty.
- Disadvantage: Possible Misrepresentation. Other critics write that not all students who need FRL will apply, and not all households that apply for FRL are in need. The concern about households taking advantage of the system may not be invalid: after all, a very small percentage of the applications are vetted to ensure that the applicants are deserving, and many districts that receive high amounts of funding for FRL are also eligible for other assistance and bonus money, which may create an incentive to report higher numbers of students opting into the FRL program. However, if using actual poverty rates to supply FRL to students would result in an underestimation of students in need and the reported FRL rates could potentially result in an overestimation (see the accompanying maps for a visual of this statement), isn’t it better to make meals available for too many students rather than too few?
Because neither proponents for nor opponents of the use of FRL as a measure of school poverty have proposed alternative measures for use in research and practice, FRL remains the best estimation we have available.
How will the new Community Eligibility Provision (CEP) impact the National School Lunch Program (NSLP)?
The primary advantage of the CEP is that it will eliminate the cumbersome application process for many households, substituting instead a determination of schoolwide eligibility based on existing measures (including the proportion of students who are classified as homeless, runaways, migrants, and Head Start-eligible, among others). These measures will be combined with the measure of students identified via direct certification outlined above. The details of the program are somewhat complicated, which is why Consider It Mapped will dedicate future entries to exploring the new measure in greater depth, starting with next month’s topic: How do the rates of identified students under the new CEP guidelines compare to rates of students determined under the traditional FRL guidelines?
Have something you’d like to add to the conversation? Let us know!
About the author