Love them or hate them, smart phones make our lives easier to navigate. Personally, I love to take mine on road trips and type “gas near me” into the Google search bar when I’m running low. Within seconds, I have every gas station in close proximity at my fingertips, and when I click on a specific location, I can see its address, phone number, and directions to that location. The genius of this function is that I can use it with a lot of different types of businesses – grocery stores, hotels, hospitals, and more.
Wouldn’t it be awesome if there were a similar, comprehensive list of organizations to turn to when we look for education services and areas of operation?
Admittedly, this information is difficult to pin down.
What constitutes an “education organization?”
Where can we find information about them?
Funders originally asked EdNC for this information, and we decided to pilot a project to see how hard it would be to pull the information together. EdNC summer intern and UNC MPA student Megan Garrett started the process by scouring information available at the North Carolina Center for Nonprofits, the Foundation Center, and the North Carolina Department of the Secretary of State to draw up a list of education-related organizations in operation in the eastern part of the state.
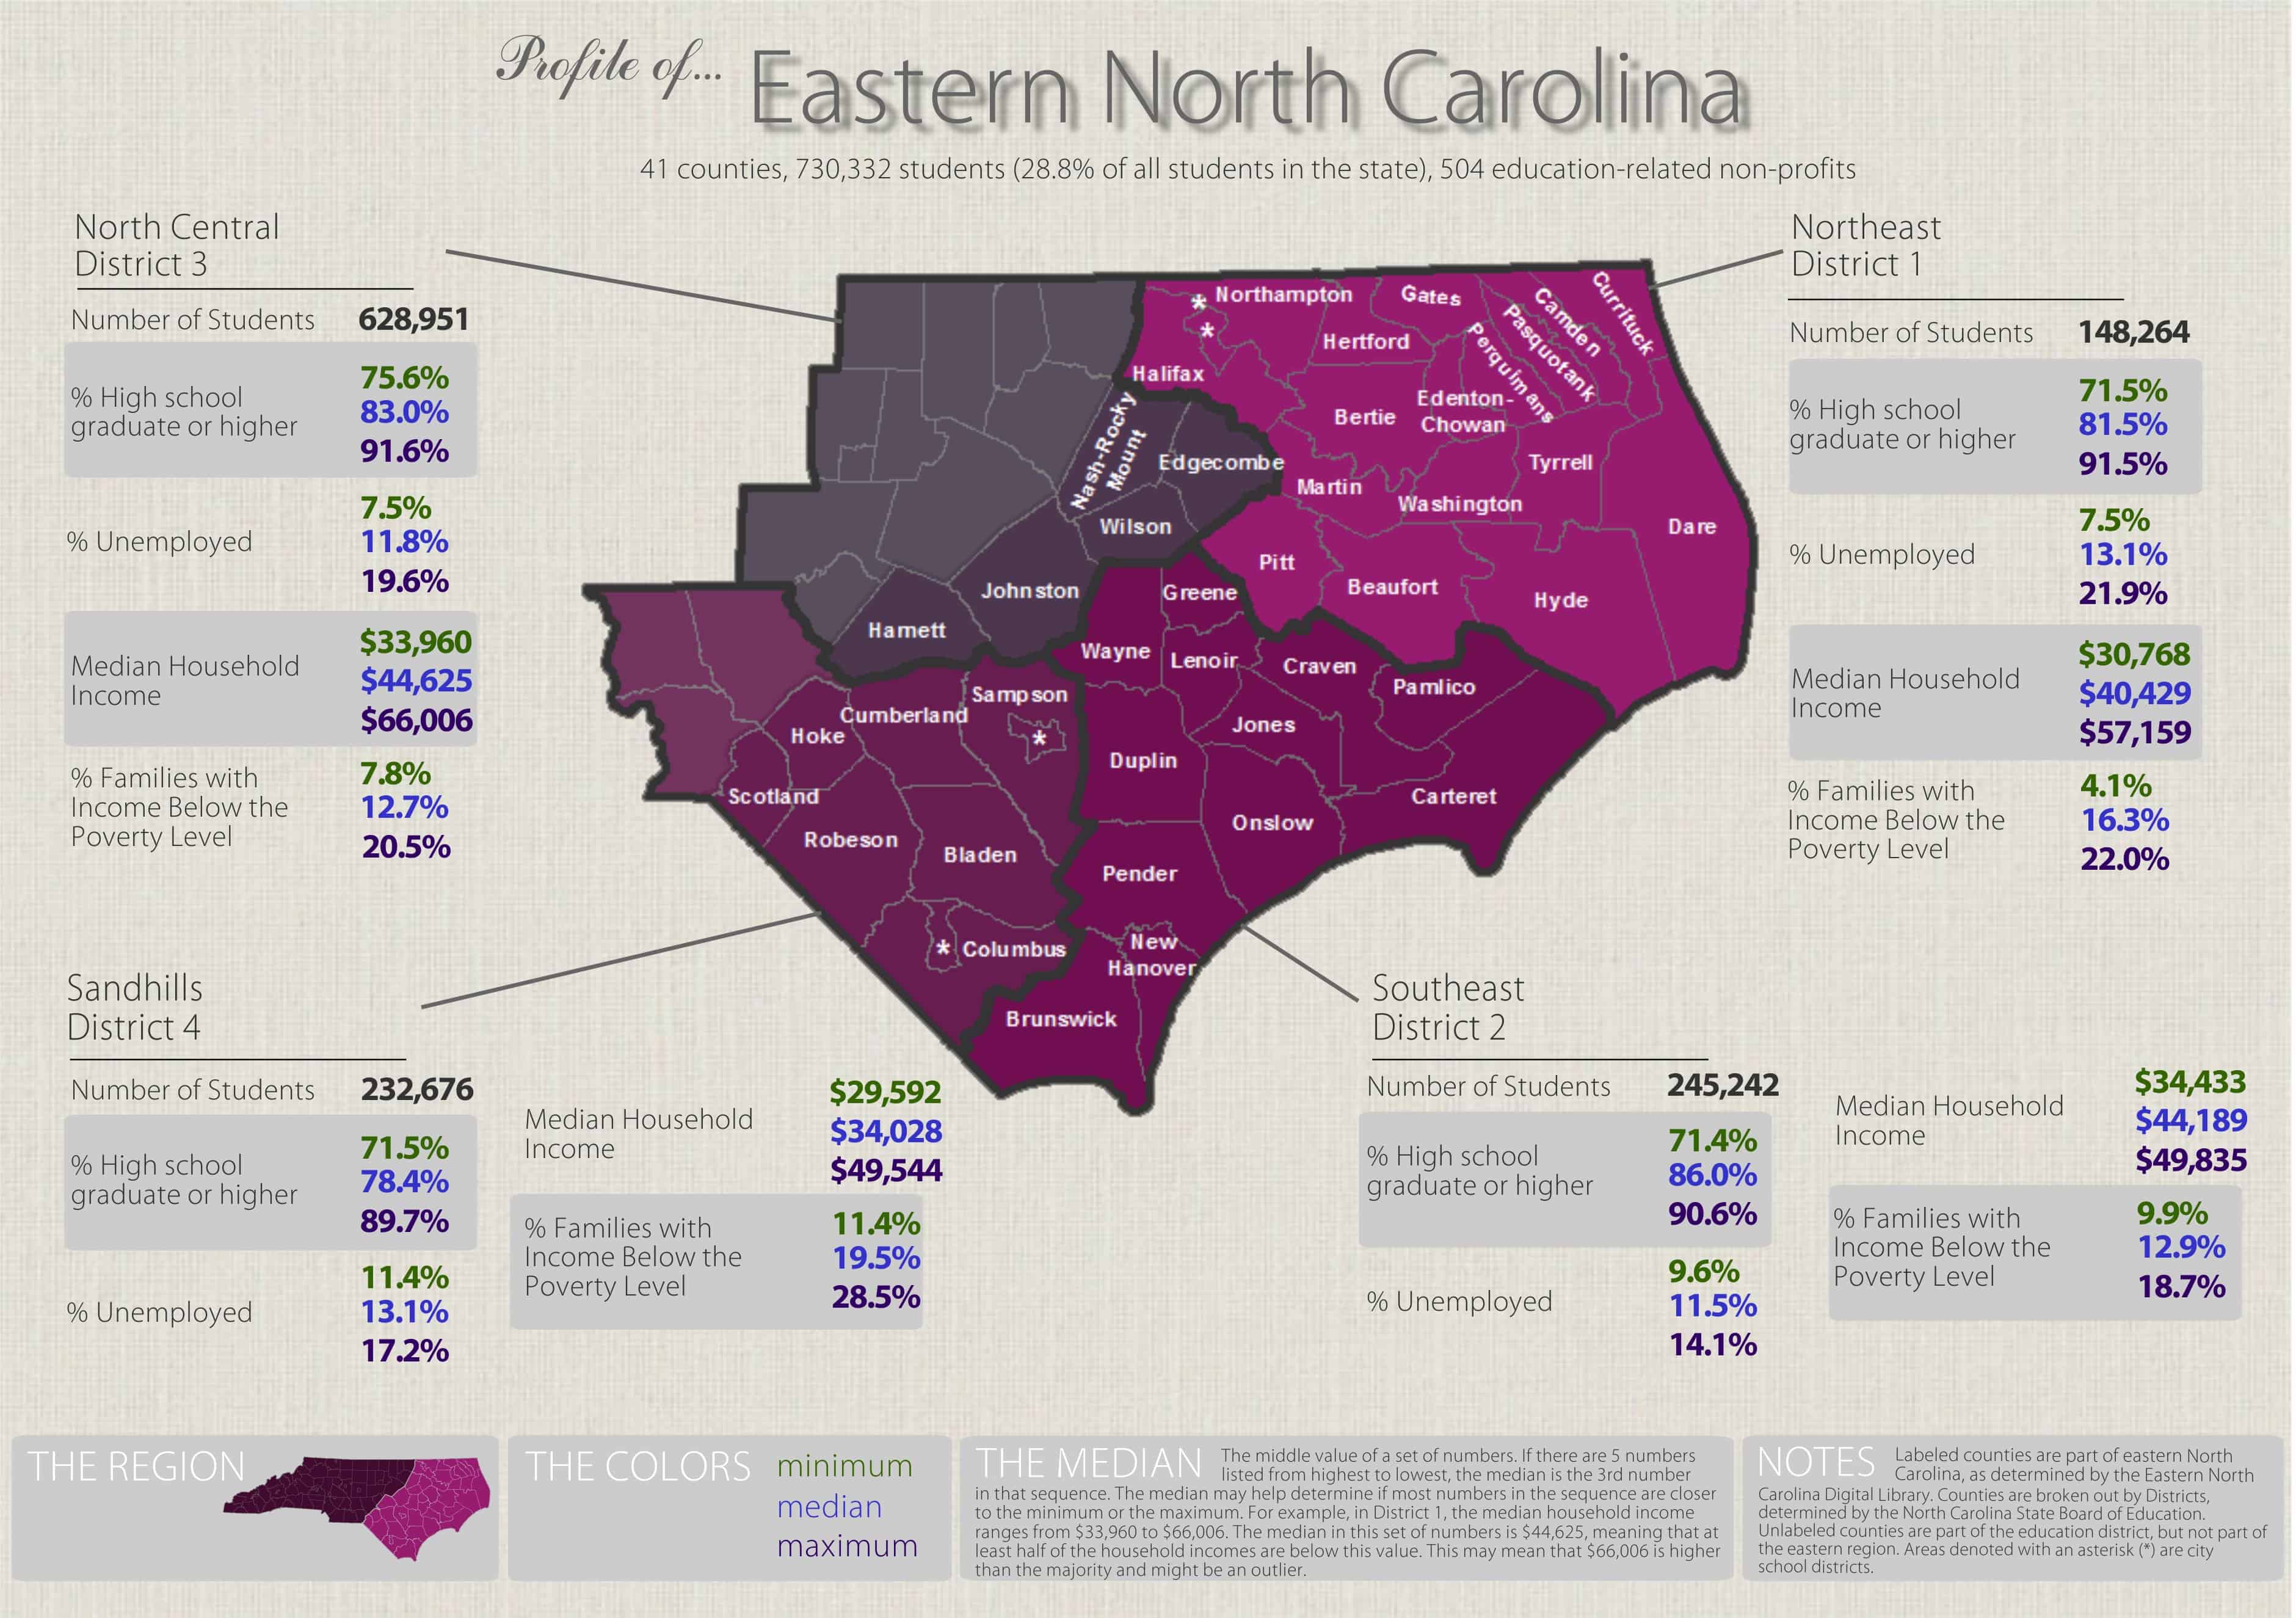
Of the three regions in North Carolina, the eastern region is often thought of as higher-need than the other regions with respect to educational services. Some school districts in eastern North Carolina, sometimes referred to as the “Coastal Plain” region, have the highest rates statewide of students who opt in to the free- and reduced-price lunch (FRL) program, as demonstrated in last month’s Consider It Mapped. That map also highlighted the correlation between student economic disadvantage and school performance, with the highest concentrations of low school performance grades on the state’s new A through F scale coinciding with the high concentrations of students in the FRL program in the Coastal Plains. In addition to having the highest poverty concentrations, eastern North Carolina’s population is also the most transient of the three regions with an economy that relies on tourism and two of the largest military bases in the country. Students who change schools frequently are at higher risk of falling behind due to the social and academic challenges associated with making those school changes.
https://www.youtube.com/watch?v=4dy02JinCW0&feature=youtu.be
It’s the job of people like Bethany Leighton to worry about the students who aren’t able to get the services they need in order to stay on track in school. Leighton is the resource development director for communities in Schools of Cape Fear, a nonprofit that serves youth at risk of dropping out in New Hanover and Pender counties. One of the ways Communities in Schools accomplishes its mission is by placing site coordinators in schools identified as high-need. These coordinators “get [students] everything from tutors to help them in certain subjects, glasses, food, clothes—whatever it is they need so their focus can turn back to school,” Leighton explains. Communities in Schools is successful in part because it helps fill in gaps, providing supplementary resources to teachers who may not have the means to give individualized attention to students who are falling behind in class.
This is just one example of a nonprofit that is a vital cog in the education process in North Carolina. Many districts and parents rely on schools as the primary provider of student educational services, but student resource needs often rely on more than what the schools alone can provide—afterschool programming provided by secondary institutions and funded by nonprofits, nutritional services supplemented by outside agencies, and parent-teacher organizations that serve as a voice for the needs of students and the broader community, to name a few. These organizations can “form partnerships [with students] that someone who is in the school maybe cannot,” says Leighton.
Unfortunately the recent recession hit many of these organizations that supplement services very hard, making it difficult for them to continue to provide for their communities. In some cases, organizations had to choose whether to merge with peer organizations in their area or close, and many with missions that were not completely aligned with other organizations opted to close. The result? Fewer operators in an area sorely in need of services. Those left are now competing for the reduced funding that is still available.
Teresa Thompson-Pickney, executive director of Back-to-School, Inc., knows this battle well. Even though she has a 90 percent success rate with the grants she has applied for in her lifetime, she’s seen other groups suffer and go under because they lack funding. As she sees it, services for children are the first to go, but “there are enough poor youth to go around for all of [the nonprofits] to serve them.” As cuts are made in education, the region needs these nonprofits more than ever, but those in operation are cutting back as well. Pickney believes finding a strategic way to collaborate is how nonprofits need to start thinking if they’re going to continue to provide services.
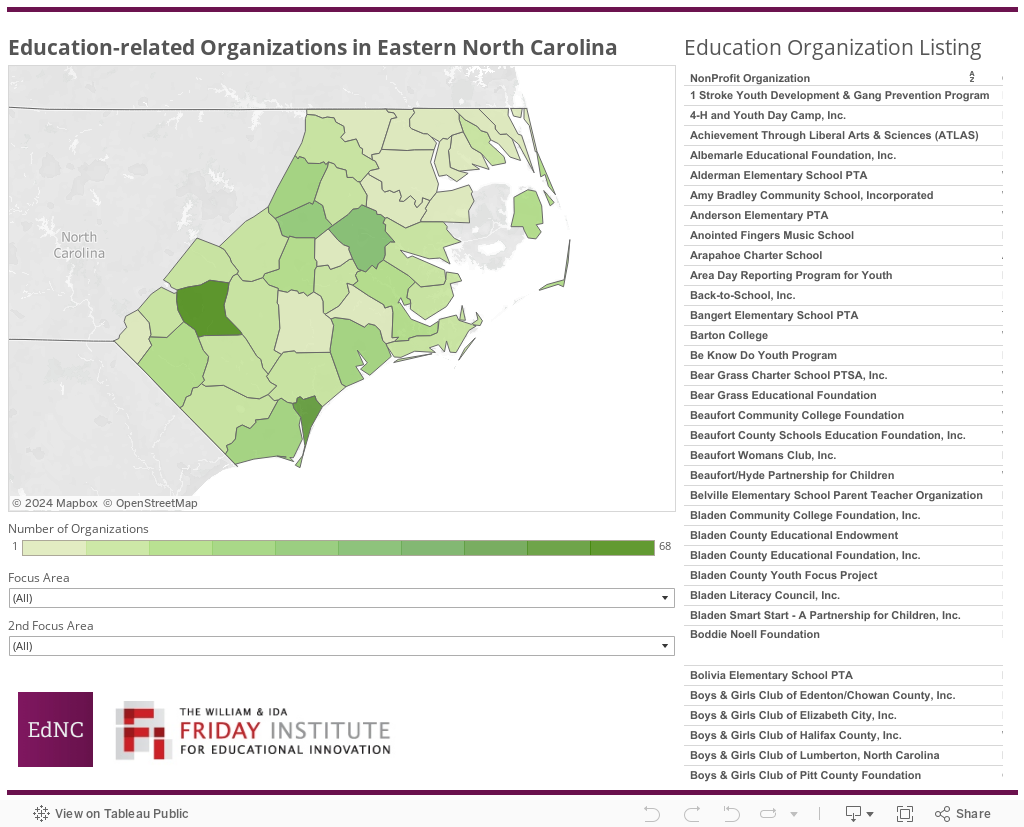
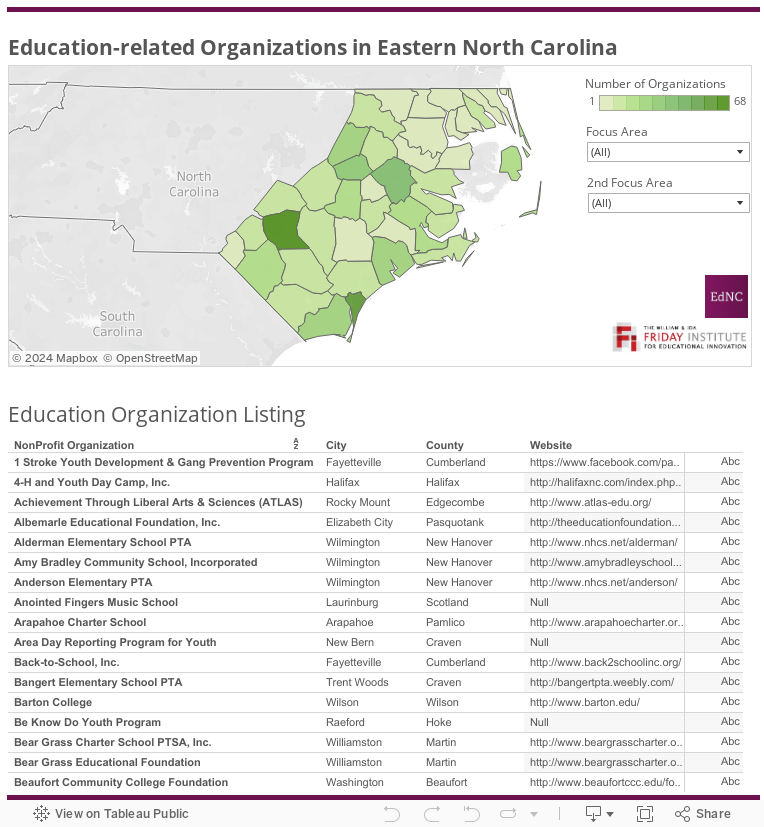
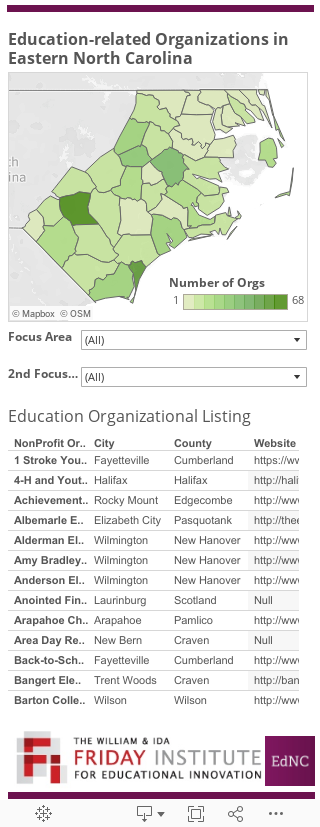
Using data from the sources listed above, this month’s map shows the organizations that provide supplemental educational services in the Coastal Plains region and the counties in which they operate.
The map features 41 counties in the eastern region of the state, as defined by the Eastern North Carolina Digital Library project at Eastern Carolina University and used by North Carolina Maps at UNC-Chapel Hill. Not only can parents, teachers, and school administrators use this map to locate needed service organizations, but organizations can further use it to see others operating within their area and with whom they can develop new partnerships.
The map can also help service organizations and policymakers identify gaps in programming: for instance, Hyde and Tyrrell counties do not appear to have any active entities.
Admittedly, this resource is not Google Maps. Megan’s work allowed us to pull around 500 records of nonprofits from a list of around 1100; many of the nonprofits that didn’t make it onto the map have no available records online or have closed their doors in recent years—another reminder that the climate for these organizations is always changing. Because the data are not static, it can be tricky to navigate, so if we are missing an organization or information, please let us know and we can update our resource.
Source: U.S. Census Bureau, Estimates from the 2013 American Community Survey.
Here is the complete database with additional information about each organization.
About the author