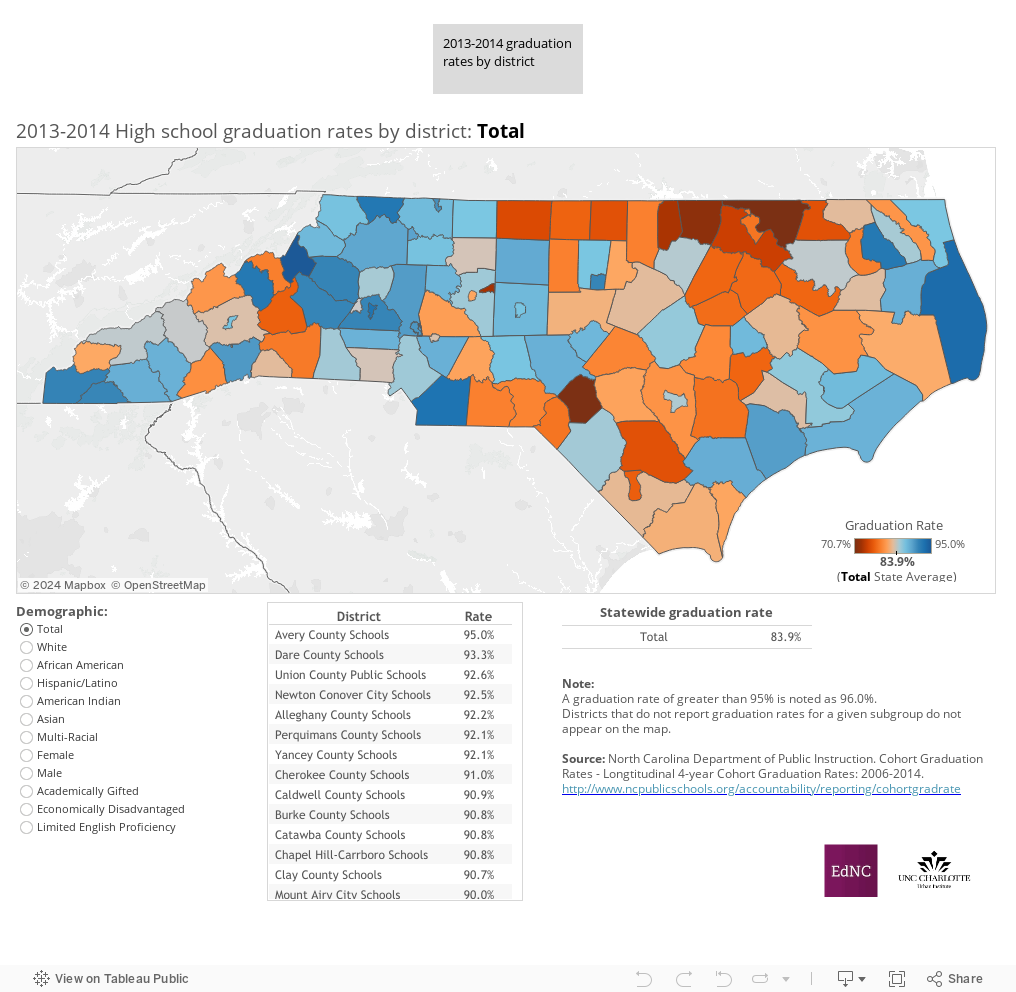
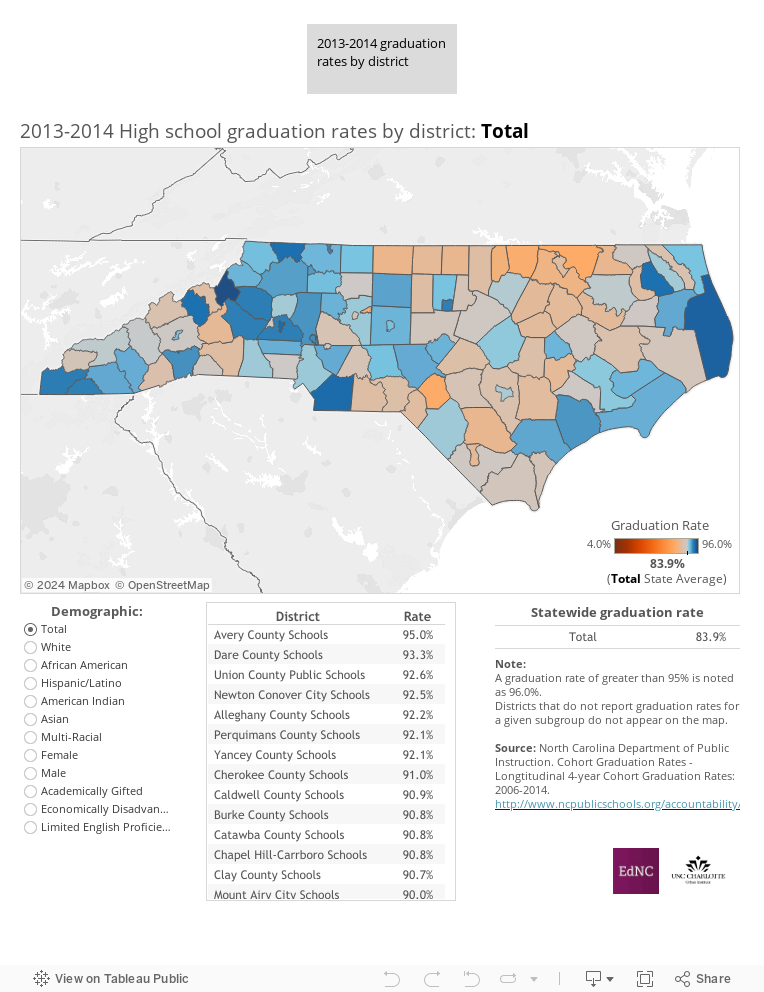
This week’s map continues on the theme of high school graduation rates across the state, and presents these latest numbers for various demographic groups.
Choose from the menu below the map to see the rates for students of a particular race/ethnicity, sex, socio-economic status, English ability, or gifted status. Districts in blue are above the state average for all students (83.9 percent), and those in orange are below. Districts with too few students of a demographic group will not show up at all.
A few observations about the numbers:
- Statewide, Asian students experienced the highest graduation rate (91.3 percent) of all race/ethnic groups, and Hispanic/Latino students had the lowest (77.4 percent).
- Graduation rates were higher among females than males. More than one-third of districts had graduation rates for female students that were 90 percent or higher, while this was true for males in less than 10 percent of districts.
- The graduation rate for Limited English Proficient students was below 80 percent in the vast majority (95 percent) of school districts.
- Academically gifted students graduated at a rate of 95 percent or higher in almost all of the state’s districts.
About the author