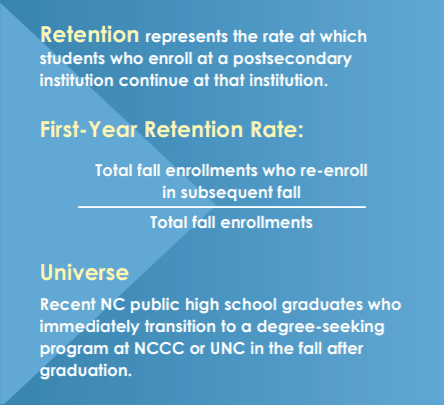
Access to and enrollment in a postsecondary program is the first step toward postsecondary attainment. Following enrollment, students must continue to degree completion, typically referred to as retention. Although we can measure retention at many points, we focus here on first-year retention rates, also sometimes referred to as “freshmen-to-sophomore retention rates.” This is the rate at which individuals who enroll at an institution as freshmen in the fall semester are still enrolled at the same institution in the following fall.
Why It Matters
First-year retention rates are a critical indicator: “Students are more likely to drop out of postsecondary education during the first year than any other time.”1 There are well-documented differences in retention by
- type of program (two-year vs. four-year),
- type of institution (public, nonprofit, or for-profit),
- selectivity of the institution,
- intensity of attendance (full-time vs. part-time), and
- sociodemographic characteristics of the student and his or her family.2
Seventy-four percent of North Carolina’s 2014-15 public high school graduates who immediately enrolled at NCCC or UNC for fall 2015 returned for fall 2016, six percentage points higher than the national first-year retention rate of 68% at public institutions.3 Because there are well-documented differences in retention by type of program (two-year vs. four-year), we examine patterns separately for NCCC and UNC.
NCCC First-Year Retention Rates
Eighteen percent of NC public high school graduates immediately enrolled in the NCCC system in 2016. Of these students, 56% were still enrolled at one of the state’s fifty-eight community colleges in 2017. These first-year retention rates were comparable to the national retention rate for two-year public institutions (55%), although they are thirty-one percentage points lower than the first-year retention rates at UNC (84%). One reason for differing retention rates at two-year and four-year institutions is the institutional difference in the share of part-time and full-time students. Nationally, 97% of first-time undergraduates at four-year public institutions enrolled full time in fall 2015 compared with 62% of first-time enrollments at two-year public institutions.4
Retention rates increased for Asian and Hispanic students and declined for all other racial/ethnic groups
First-year retention rates at NCCC declined by one percentage point from 2007 to 2016, dropping from 57% to 56% (Figure 40). NCCC retention rates also declined for the state’s American Indian, Black, and White students. Between 2007 and 2016, retention rates decreased for
- American Indian students by one percentage point (52% to 51%);
- Black students by five percentage points (50% to 45%), the largest decrease for any racial/ethnic group; and
- White students by two percentage points (59% to 57%).
At the same time, the state’s two newest and fastest-growing racial/ethnic minority groups, Asian and Hispanic students, experienced increases in their first-year retention rates at NCCC. Between 2007 and 2016, retention rates increased for
- Asian students by one percentage point (66% to 67%); and
- Hispanic students by three percentage points, rising from 60% to 63%, the largest improvement of any group over this time.

Reflecting these differing patterns of change, some racial/ethnic groups fell further below the state average retention rate at NCCC while others pulled further away, as shown in Figure 41. First-year retention rates for Black students decreased faster than the state average between 2007 and 2016. Consequently, this group was even further below the state average in 2016 (-10.3 pp) than in 2007 (-7.4 pp). Although the first-year retention rate for American Indian students did not decline as much as the statewide rate, American Indian students remained less likely to return for their second year at a community college in 2017 (4.5 percentage points below the state average).
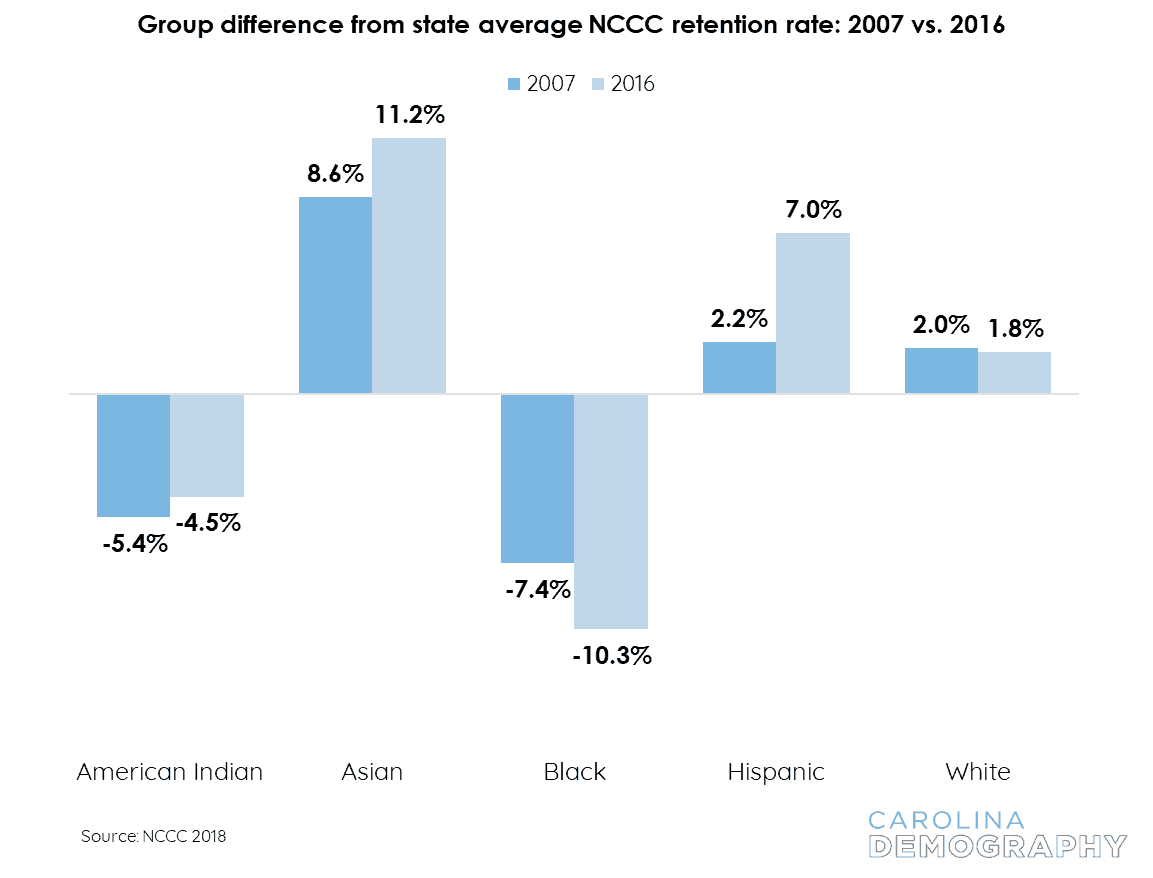
While the first-year retention rates for White students also declined over this period, their rate remained above the state average in 2017 by 1.8 percentage points. Because of the improvements in retention rates among the state’s Asian and Hispanic students, these groups were far above the state average in 2016:
- Asian students were 8.6 percentage points above the state average in 2007. This gap increased to 11.2 percentage points in 2016.
- Hispanic students were 2.2 percentage points above the state average in 2007. By 2016, Hispanic students were 7.0 percentage points above the state average, reflecting the large improvements in first-year retention rates for these students over this time.
Female students are more likely to return to NCCC for their second year
Overall, the first-year retention rate for the fall 2016 cohort of female students at NCCC was 57%, compared to a retention rate of 54% for male students, a gap of three percentage points. For nearly all racial/ethnic groups, female high school graduates who enrolled at NCCC in fall 2016 were more likely than their male counterparts to return in fall 2017 (Figure 42):
- The gap between American Indian female students (53%) and American Indian male students (48%) was five percentage points.
- The gap between Black female students (47%) and Black male students (43%) was four percentage points. Both female and male Black students had lower first-year retention rates at NCCC than any other subgroup.
- The gap between Hispanic female students (65%) and Hispanic male students (59%) was six percentage points, the largest of any subgroup.
- The gap between White female students (58%) and White male students (57%) was one percentage point, the smallest gap of any group.
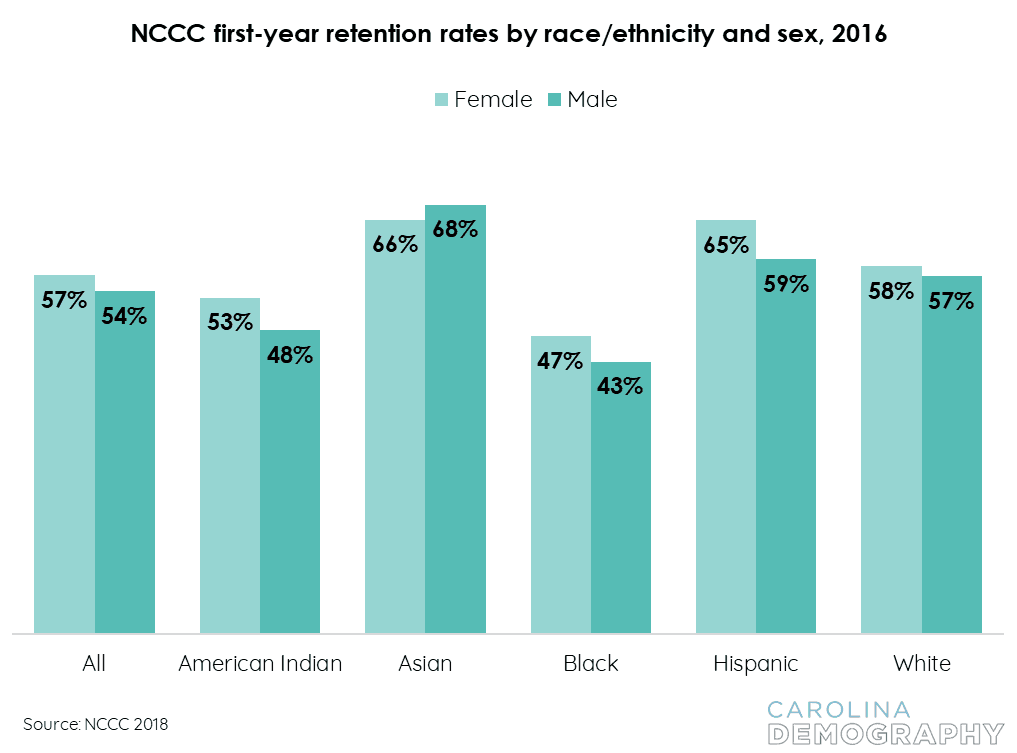
These patterns are consistent with broader national research finding that men were more likely to leave postsecondary programs than women after the first year.5 Asian students were the only group where female students were not more likely to return for their second year than male students. Among the fall 2016 cohort, 66% of Asian female students returned for a second year at NCCC, two percentage points less than the retention rate for their male counterparts (68%). Both female and male Asian students had higher first-year retention rates than any other subgroup.
UNC System in Focus
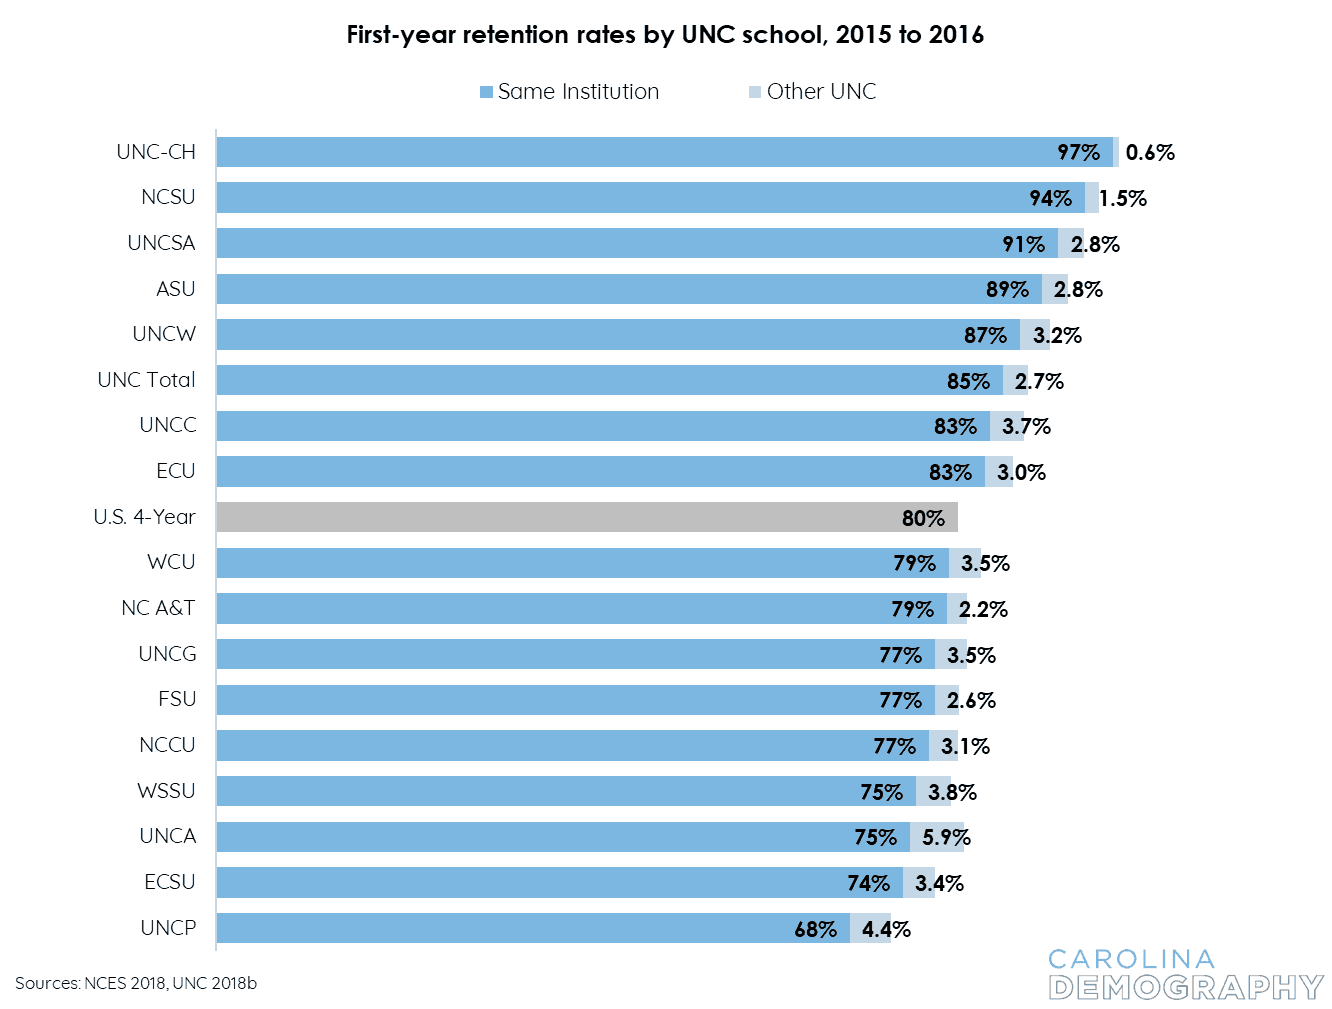
Nationally, four-year institutions retained 80% of first-time undergraduates between 2015 and 2016. This varied from 45% among open-admissions for-profit institutions to 96% among the most selective public and nonprofit institutions. Within the UNC system, this rate was 85%, although there was significant variation across institutions (Figure 43). The first-time undergraduate retention rate ranged from 68% at UNC-Pembroke to 97% at UNC-Chapel Hill.
Overall retention within the UNC system was even higher: an additional 2.7% of first-time UNC students changed schools within the UNC system between their first and second years. UNC-Asheville (5.9%) and UNC-Pembroke (4.4%) had the highest share of first-year students who transitioned to another UNC school between fall 2015 and fall 2016.
UNC First-Year Retention Rates
Twenty-five percent of NC public high school graduates immediately enrolled at a UNC school in fall 2016. Of these students, 88% were still enrolled at one of UNC’s sixteen universities in fall 2017. Overall, the UNC system had higher first-year retention rates than other four-year institutions (see “UNC System in Focus”), and these retention rates have improved over time.
First-year retention rates at UNC improved for all groups except for American Indian students
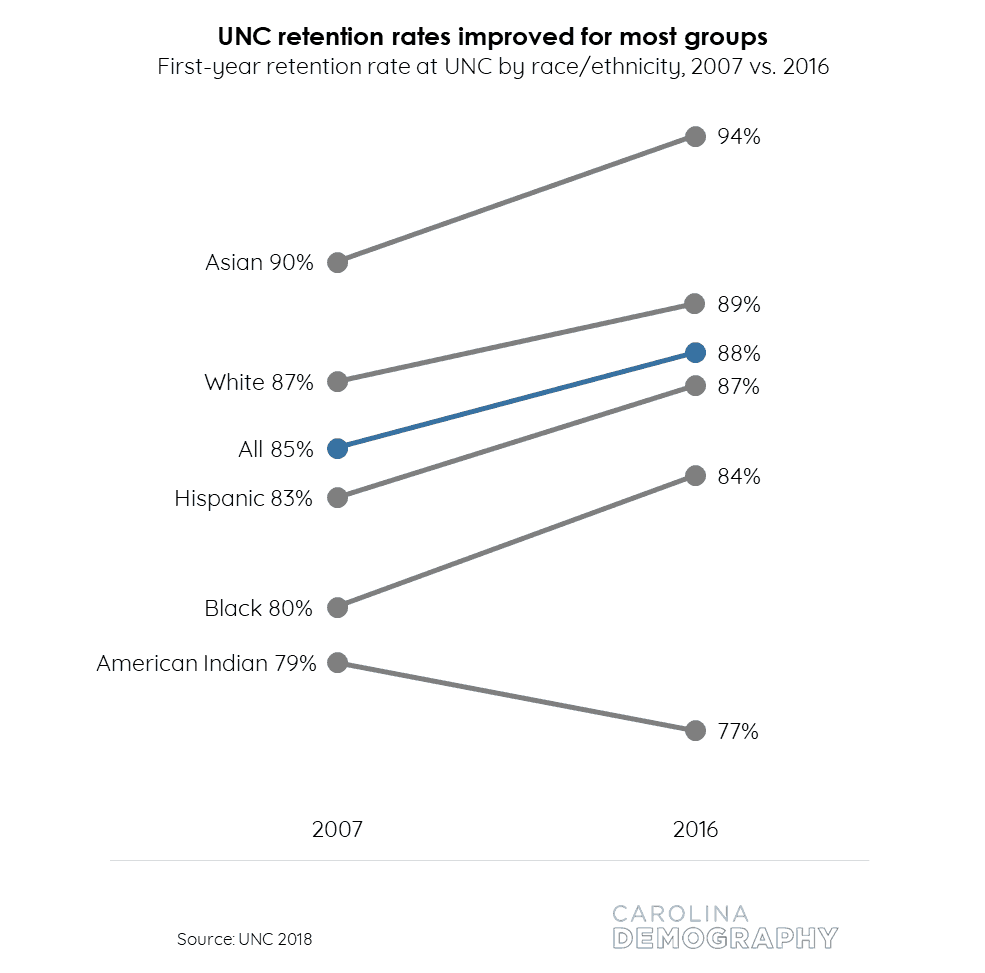
Between 2007 and 2016, UNC’s first-year retention rate increased by three percentage points, rising from 85% to 88% (Figure 44). Nearly all racial/ethnic groups saw improvements in their first-year retention rates at UNC. Between 2007 and 2016, first-year retention rates increased by four percentage points for Asian, Black, and Hispanic students and by two percentage points for White students. In contrast, first-year retention rates for American Indian students declined two percentage points, from 79% to 77%. This was the only group to see declining first-year retention rates.
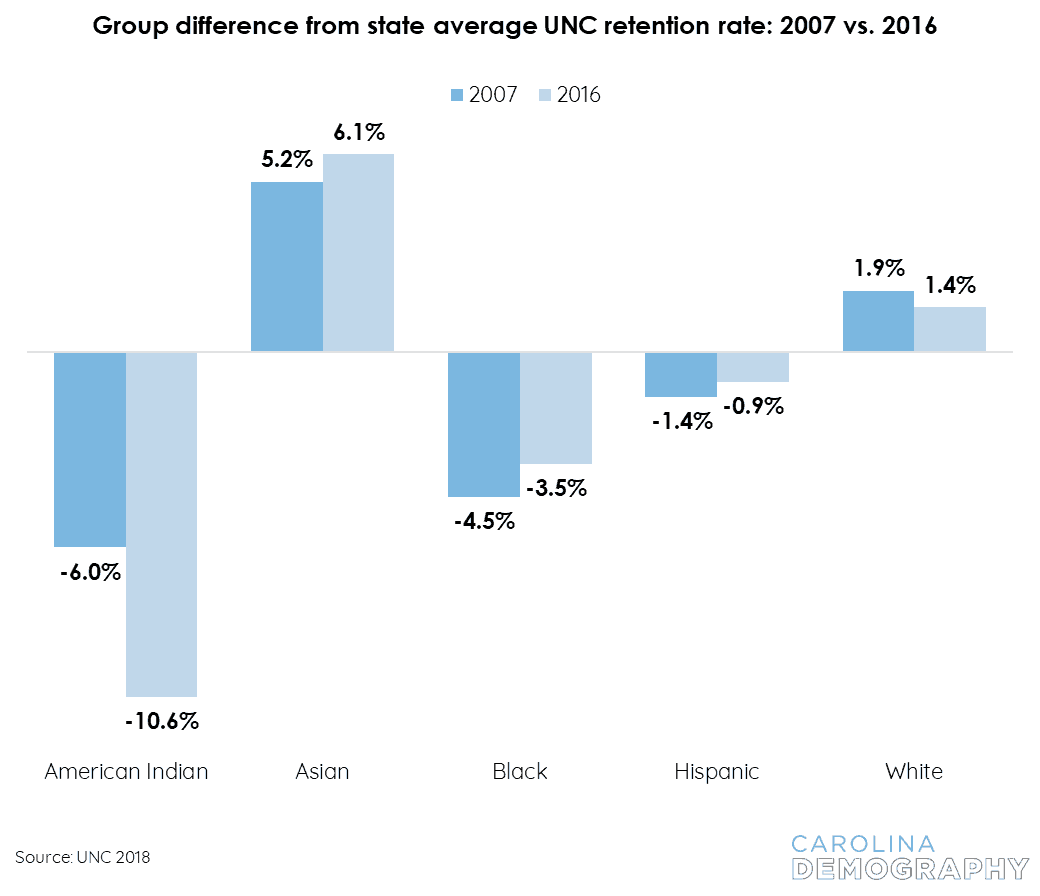
Except for American Indian students, the first-year retention rates at UNC improved for the state’s minority students faster than they improved overall. As a result, the gaps between the group average for many racial/ ethnic groups and the overall state average first-year retention rate narrowed, as shown in Figure 45. There were notable improvements among Black and Hispanic students, the state’s two largest racial/ethnic minority groups:
- In 2007, Black first-year retention rates at UNC lagged the state average by 4.5 percentage points. This gap narrowed to 3.5 percentage points in 2016.
- In 2007, Hispanic first-year retention rates at UNC fell below the state average by 1.4 percentage points. In 2016, Hispanic student retention rates were within one percentage point of the state average (0.9 percentage point gap).
Female students more likely to return to UNC for their second year
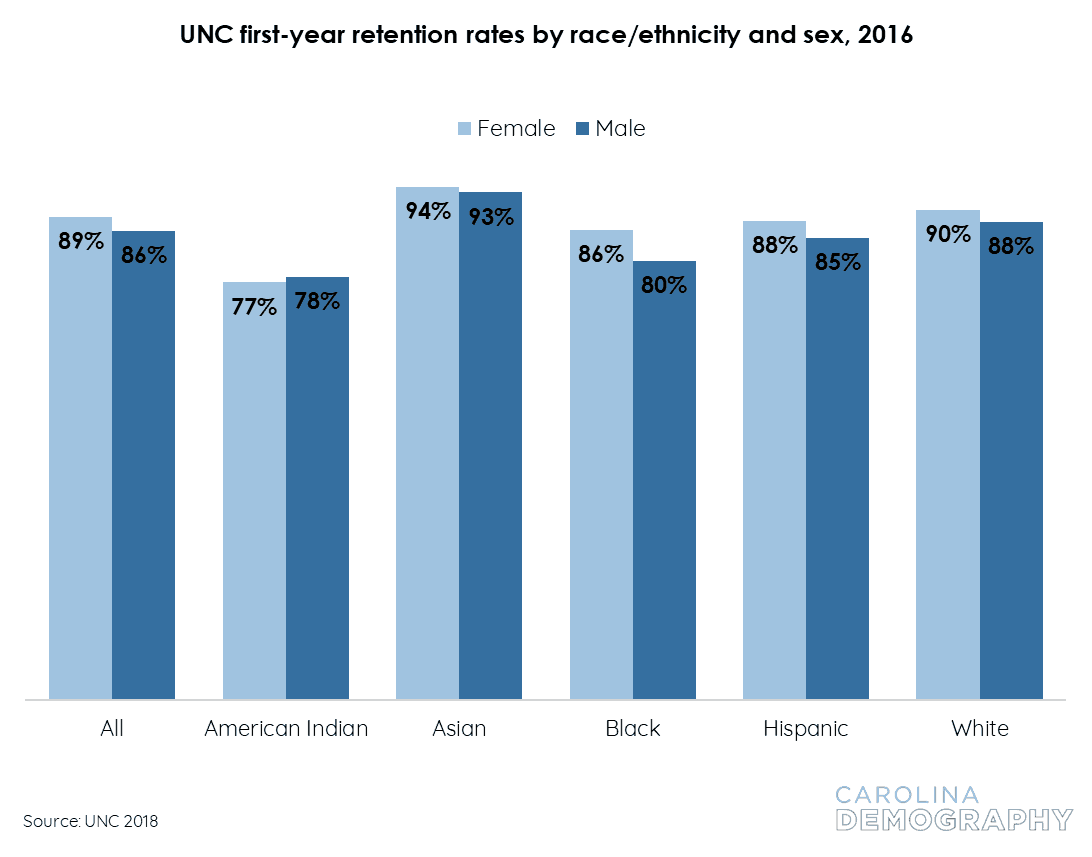
Figure 46 shows UNC first-year retention rates for the fall 2016 entering cohort by race/ethnicity and sex. Similar to the patterns observed among NCCC students, female students were more likely than their male counterparts to return for their second year. First-year retention rates for female students at UNC in 2016 were 89% compared with 86% for male students, a gap of three percentage points. Similar patterns existed for nearly all racial/ethnic groups:
- Asian female students had first-year retention rates one percentage point higher than Asian male students (94% vs. 93%).
- The gap between Black female students (86%) and Black male students (80%) was the largest of any subgroup: six percentage points.
- The gap between Hispanic women (88%) and Hispanic men (85%) was three percentage points, the second largest of any subgroup.
- First-year retention rates for White female students (90%) were two percentage points higher than those of White male students (88%).
The only racial/ethnic group where this pattern did not hold was among American Indian students. In 2016, 78% of American Indian male students returned for their second year compared with 77% of their female counterparts, a gap of one percentage point. Both male and female American Indian students had lower first-year retention rates at UNC than any other group.
Pipeline Takeaway
One in four first-time undergraduates left the NCCC or UNC system within one year
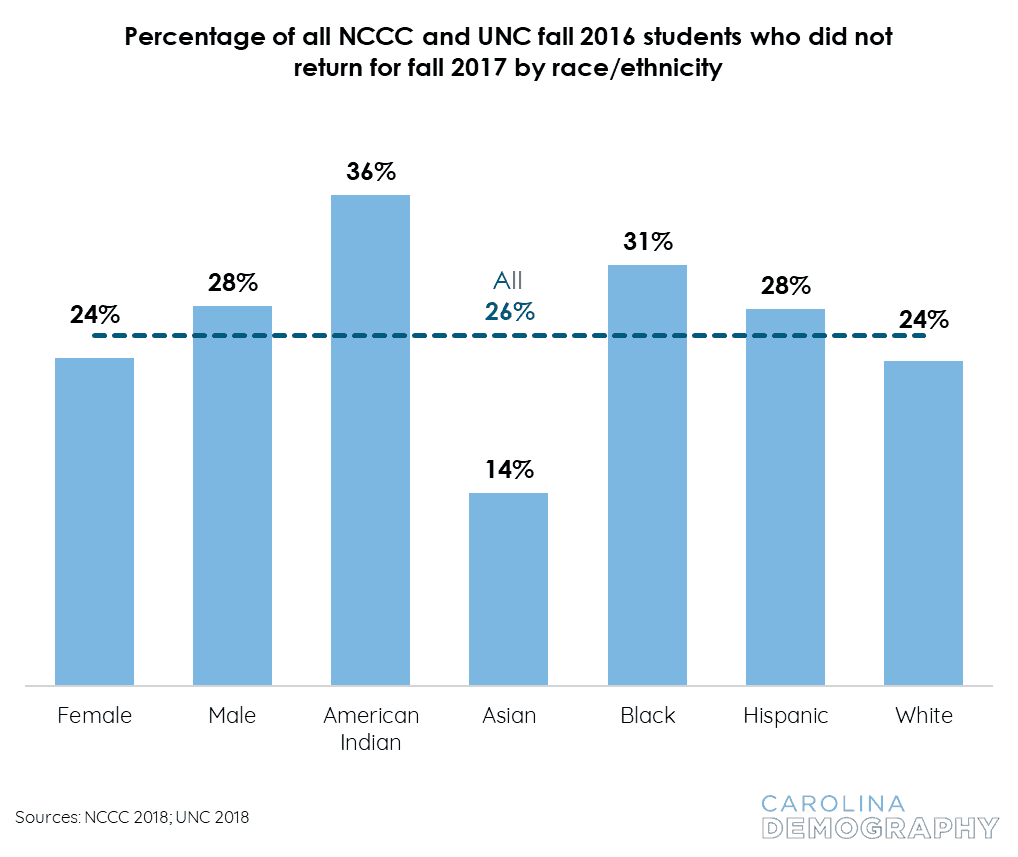
Overall, 26% of NC high school graduates who immediately enrolled at an NCCC or UNC school in fall 2016 did not return for fall 2017 (Figure 47). This represents nearly 11,300 students who began college in the fall but did not return for their second year. Forty-five percent of students who left their institutions left after fall semester and did not return for spring; over half (55%) were enrolled for the full year at their starting institutions.
Overall, male students were more likely to leave (28%) than female students (24%), although sex differences were not as pronounced as differences in attrition by racial/ethnic subgroup. More than one in every three (36%) American Indian students who began NCCC or UNC in fall 2016 did not return for their second year, the highest rate of any group; this first-year attrition rate was twenty-two percentage points higher than Asian students (14%), who had the lowest attrition rate. Black (31%) and Hispanic (28%) students were also more likely to leave than the state average rate. For Black students, this reflects belowaverage retention rates at both NCCC and UNC. For Hispanic students, this reflects their greater likelihood of enrolling in community colleges where retention rates are generally lower.
Many students may have persisted in their education
Some of the students who were not retained after their first year may have transferred to another institution and persisted in their postsecondary education, but the current data do not provide detail to understand “loss” due to transfer versus loss due to stopout or dropout.
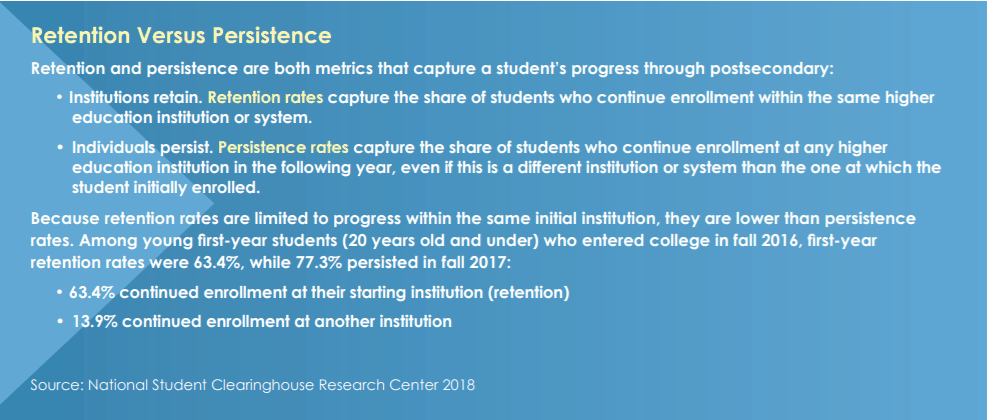
Nationally, the first-year retention rate was 63% among all students who entered postsecondary institutions in fall 2016, meaning 37% of students did not return to their institutions for a second year. Many of these students persisted in their postsecondary education, however: about 14% of students who began postsecondary in fall 2016 continued their education at a different school in their second year.6 Applying a similar rate to North Carolina would yield an additional 6,140 students who enrolled in fall 2016 and were not retained at their starting institution but had persisted in the postsecondary pipeline.
Academic preparedness and affordability
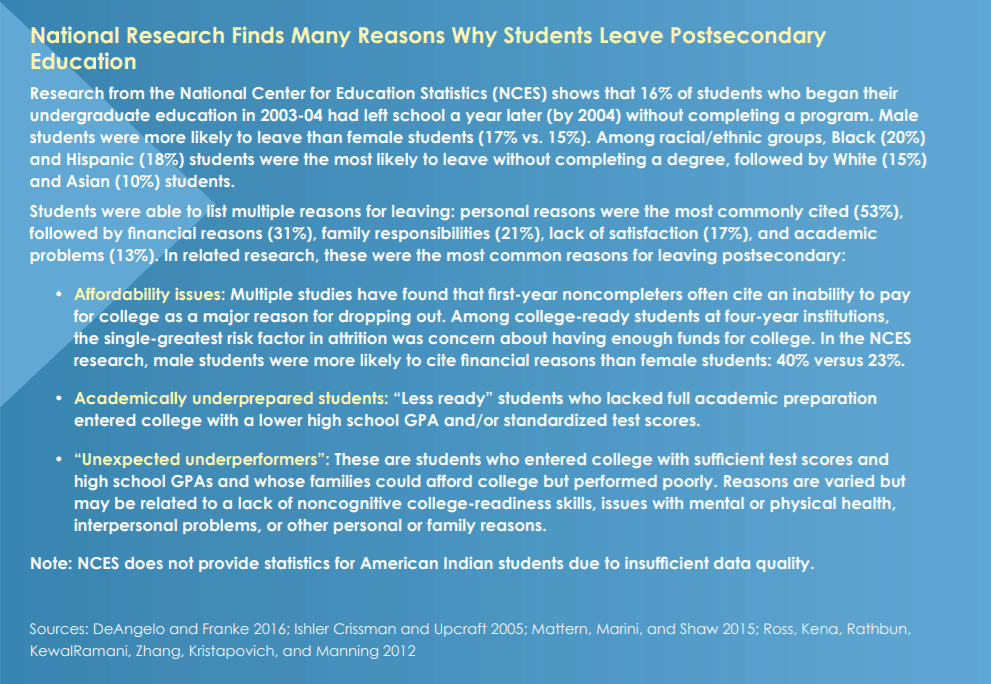
For students who enter postsecondary, the first year represents a critical time point, particularly for more vulnerable college students.7 Recent analysis found that students identified as “less ready” accounted for 75% of attrition in the first year of college, signifying the importance of effective readiness and transition programs prior to the first fall semester.8
Affordability is also cited as a common reason for leaving college after the first year.9 For students with a strong academic profile (i.e., “college-ready”), the greatest risk factor in dropping out was concern about paying for college.10
Recommended reading
