April is National Child Abuse Prevention Month, so this week we take a look at how North Carolina’s children are faring. Last week, NC Child released their 2018 County Data Cards, which provide snapshots of children’s well-being by county.
NC Child pulled data from the NC Office of State Budget Management, NC Department of Health and Human Services, U.S. Census Bureau, University of North Carolina at Chapel Hill Jordan Institute for Families, and NC Department of Public Instruction to create the data cards.
The data cards are broken into five categories: a strong start, family economic security, nurturing homes and communities, high-quality education, and health and wellness. Each category includes three different measures.
The overall state data card (embedded below) shows small improvements in some categories. The median family income in North Carolina increased from $46,868 in 2011-2015 to $48,256 in 2012-2016. Teen births per 1,000 girls ages 15-17 decreased from 14.3 in 2015 to 9.7 in 2016.
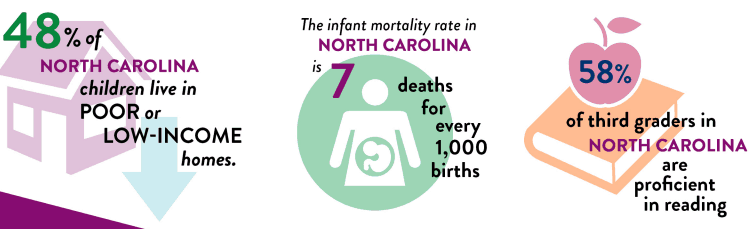
However, there are some troubling statistics, particularly the fact that 48.2 percent of children live in poor or low-income households and only 57.8 percent of third grade students scored proficient in reading in 2016-2017. According to data from the Kaiser Family Foundation, North Carolina falls behind at least 25 other states in the percent of children without health insurance (5.5 percent).
Looking at the data by county reveals great disparities. In general, children in rural counties are faring worse than children in urban and suburban areas.
In Robeson County, 70.5 percent of children live in poor or low-income households and 93.4 per 1,000 children were assessed for abuse or neglect in 2016, almost double the state average of 56.3. The median family income for 2012-2016 was $31,298 and just 38.6 percent of third grade students scored proficient in reading in 2016-2017. Children in Scotland County next door did not fare much better.
Children in Eastern North Carolina counties like Edgecombe, Bertie, Halifax, and Northampton are also faring significantly worse than the average child in North Carolina. Deaths per 100,000 children jumped in Northampton County from 93.3 in 2015 to 127.6 in 2016, double the state average. Also in Northampton, 76.6 percent of children live in poor or low-income households, only 30.3 percent of third grade students are proficient in reading, and 9.7 percent of children do not have health insurance.
Compare that to Wake County, where 31.7 percent of children live in poor or low-income homes, the median family income is $70,620, and 67.4 percent of third grade students are proficient in reading. Only 27.9 children per 1,000 are assessed for abuse or neglect in Wake County compared to the state average of 56.3.
In Mecklenburg County, home to the city of Charlotte, 41.5 percent of children live in poor or low-income homes, the median family income is $59,268, and 58.4 percent of third graders are proficient in reading. Six percent of children do not have health insurance, slightly above the state average of 5.5 percent.
These data cards paint a disturbing picture of a state where a child’s future looks very different depending on where he or she is born. Hopefully the data is a starting point and provokes action to address these stark disparities.
Recommended reading