Information
Superintendent: Dr. Bert L’Homme
Number of Schools: 54
Number of Students, 2014-15: 33,626
Number of Teachers, 2014-15: 2,389
Website: www.dpsnc.net
District Demographics, 2014-15

| Race/Ethnicity | Male | Female |
|---|---|---|
| American Indian | 79 | 65 |
| Asian | 435 | 374 |
| Hispanic | 4,667 | 4,496 |
| Black | 8,197 | 8,115 |
| Pacific Islander | 17 | 17 |
| White | 3,244 | 2,986 |
| Multiracial | 458 | 476 |
| Total | 17,097 | 16,529 |
Source: Durham Public Schools, 2014-15, Month 1, http://www.dpsnc.net/files/_FPAs6_/e1afc3e5c54d7f613745a49013852ec4/DPI_Month_1_Enrollment_Numbers_2014.15.pdf
Funding, 2015


| Per Pupil Expenditure | $ | Rank in State |
|---|---|---|
| Sate | 5,705.27 | 78th |
| Federal | 1,156.22 | 48th |
| Local | 3,772.31 | 4th |
| Total | 10,633.80 | 23rd |
Source: DPI, Statistical Profile, Table 24, http://apps.schools.nc.gov/pls/apex/f?p=1:134:594061855264701::NO:::
Teacher Turnover, 2014-15

District Turnover Percent, 2014-15: 20.43%
State Turnover Percent, 2014-15: 14.84%
Rank: 16th
Source: DPI, 2014-15 State of the Teaching Profession in North Carolina Report, http://www.dpi.state.nc.us/docs/educatoreffectiveness/surveys/leaving/2014-15turnoverreport.pdf
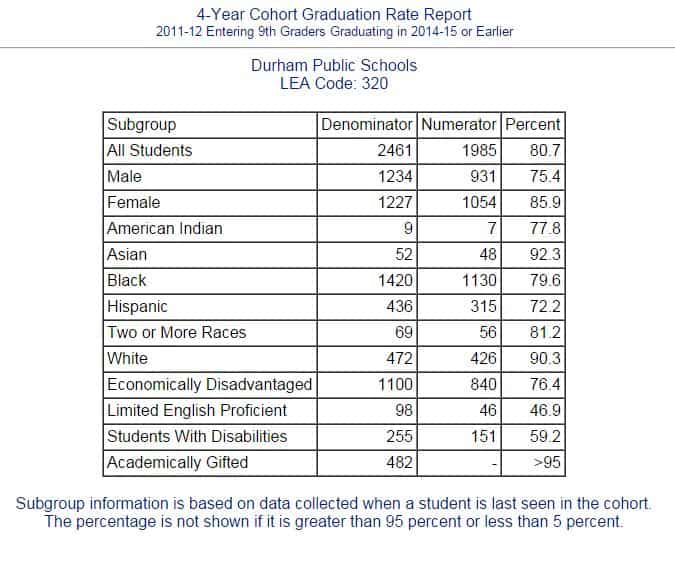
Graduation Rates, 2014-15


Suspensions and Expulsions, 2013-14
| Gender | Race/Ethnicity | # Short Term Suspensions | # Long Term Suspensions | Expulsions |
|---|---|---|---|---|
| Female | American Indian | <10 | <10 | 0 |
| Female | Asian | <10 | <10 | 0 |
| Female | Hispanic | 152 | <10 | 0 |
| Female | Black | 1,261 | 11 | 0 |
| Female | White | 46 | <10 | 0 |
| Male | American Indian | <10 | <10 | 0 |
| Male | Asian | <10 | <10 | 0 |
| Male | Hispanic | 414 | <10 | 0 |
| Male | Black | 3,156 | 51 | 0 |
| Male | White | 184 | <10 | 0 |
| Male | Multiracial | <10 | <10 | 0 |
| Total | 5,235 | 69 | 0 |
Source: DPI Consolidated Data Report, 2013-14, http://www.dpi.state.nc.us/docs/research/discipline/reports/consolidated/2013-14/consolidated-report.pdf
School Performance
Here is an Excel file of data on school performance in DPS for 2014-15.
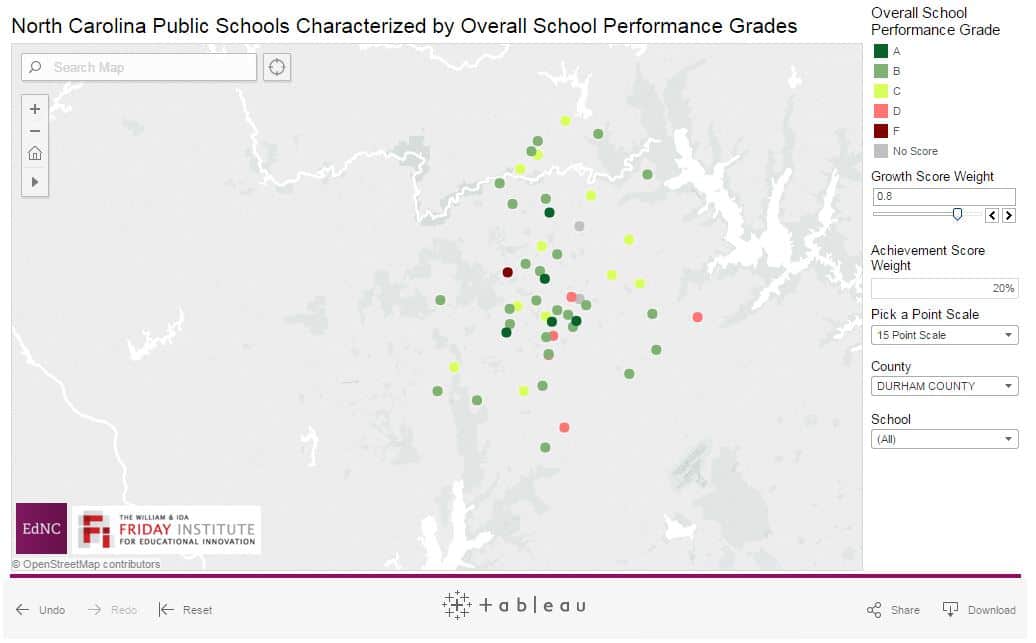
Here is a map of the school performance grades for schools for 2013-14 in the Durham Public Schools using the state’s formula of 80 percent achievement and 20 percent growth:
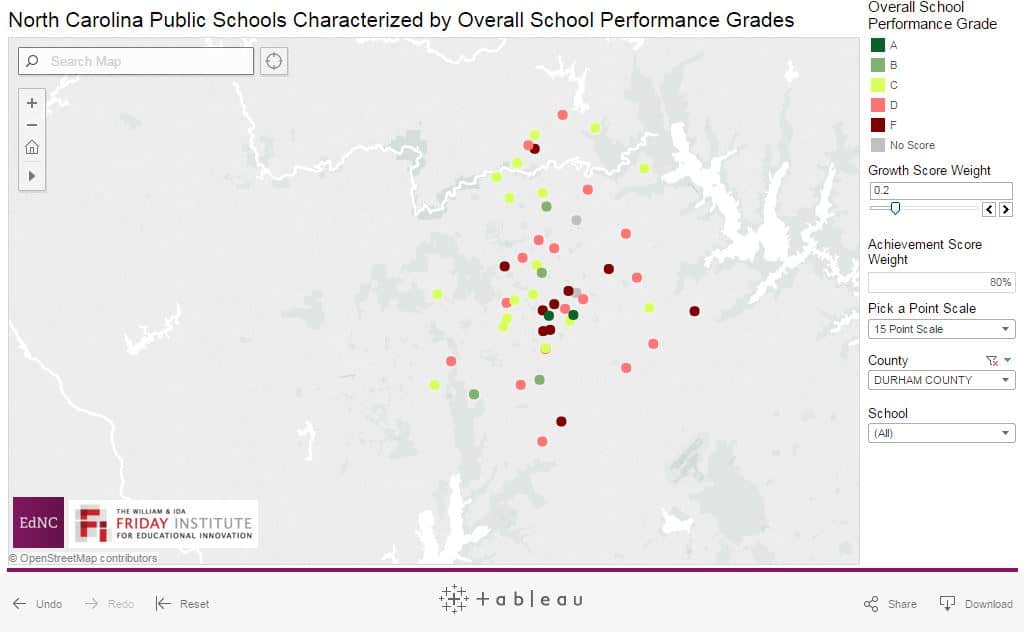
Here is a the same map using the formula of 20 percent achievement and 80 percent growth:
Source: Emily Antoszyk, Consider It Mapped, EdNC, https://www.ednc.org/map/2015/06/school-report-cards/