
Share this story
- Traditional public school enrollment experienced a slight decline since 2022. But some small counties are the hardest hit.
- Charter school enrollment has grown 4.9% over last year, but it still makes up less than 10% of total public school enrollment. Read more about the most recent public school enrollment data in North Carolina here.
Correction: This article previously included laboratory, regional, and virtual school ADMs in the total for charter schools.
Public school enrollment has increased slightly in North Carolina since the last school year. However, for the first time since the pandemic, traditional public schools observed a decrease in students while charter school enrollment continues to rise.
In October, the state Department of Public Instruction (DPI) released its first look at how many students are in the state’s public schools for the 2023-24 school year.
Though the total number of student enrollment measured through average daily membership (ADM) rose from last year, the state is still thousands of students short of pre-pandemic totals.
According to the state’s most recent numbers, traditional public schools have 1,358,003 students in 2023-24, losing 0.4% of students from last year to this year and down 3.6% overall from before COVID-19.
Charter schools have 139,985 students in 209 schools in 2023-24, gaining 4.9% over last year. Despite the growth in charter school enrollment, as a sector it makes up less than 10% of total public school enrollment.
Traditional public schools are still largely the school of choice for most families.
These numbers matter because the information gathered during the student accounting process is used to make decisions for evaluations, planning, and funding for different school programs and resources.
For more on what ADM is and how it affects school funding, watch former Watauga County Schools Superintendent Scott Elliott explain it in this video.
The ADM numbers for traditional as well as charter, laboratory, and virtual school students in 2019 (pre-pandemic), 2020 (at the peak of the pandemic), 2021, 2022 (last year), and this year are displayed in the chart below.
Total Average Daily Membership for Month 1
| 2019 | 2020 | 2021 | 2022 | 2023 | |
| TOTAL | 1,526,144 | 1,463,903 | 1,479,719 | 1,503,532 | 1,504,424 |
| Traditional | 1,408,592 | 1,337,469 | 1,348,000 | 1,363,399 | 1,358,003 |
| Charter + Other | 117,552 | 126,434 | 131,719 | 140,133 | 146,421 |
ADM is a measure of enrollment. DPI defines ADM and its calculation this way:
The total number of school days within a given term — usually a school month or school year — that a student’s name is on the current roll of a class, regardless of his/her being present or absent, is the “number of days in membership” for that student. ADM for each school month is based on the sum of the number of days in membership for all non-violating students in individual LEAs/Charters, divided by the number of days in the school month. The final ADM is the total days in membership for all students over the school year divided by the number of days school was in session. ADM is a more accurate count of the number of students in school than enrollment.
Methodology
To analyze the Month 1 ADM data from this year, we compared it with Month 1 ADM data from the last four school years for each school district (also referred to as LEA or local education agency for the sake of this report). You can find all the original data from DPI here under “Average Daily Membership and Membership Last Day by LEA (ADM & MLD).”
The data for this year are the numbers as of Nov. 3, 2023 and are preliminary.
Districts sometimes see an increase in ADM in Month 2. Month 2 data for this year aren’t available, so we used only the Month 1 data in our analysis.
We looked at the 115 public school districts in the state, which includes the 100 county districts and 15 city districts.
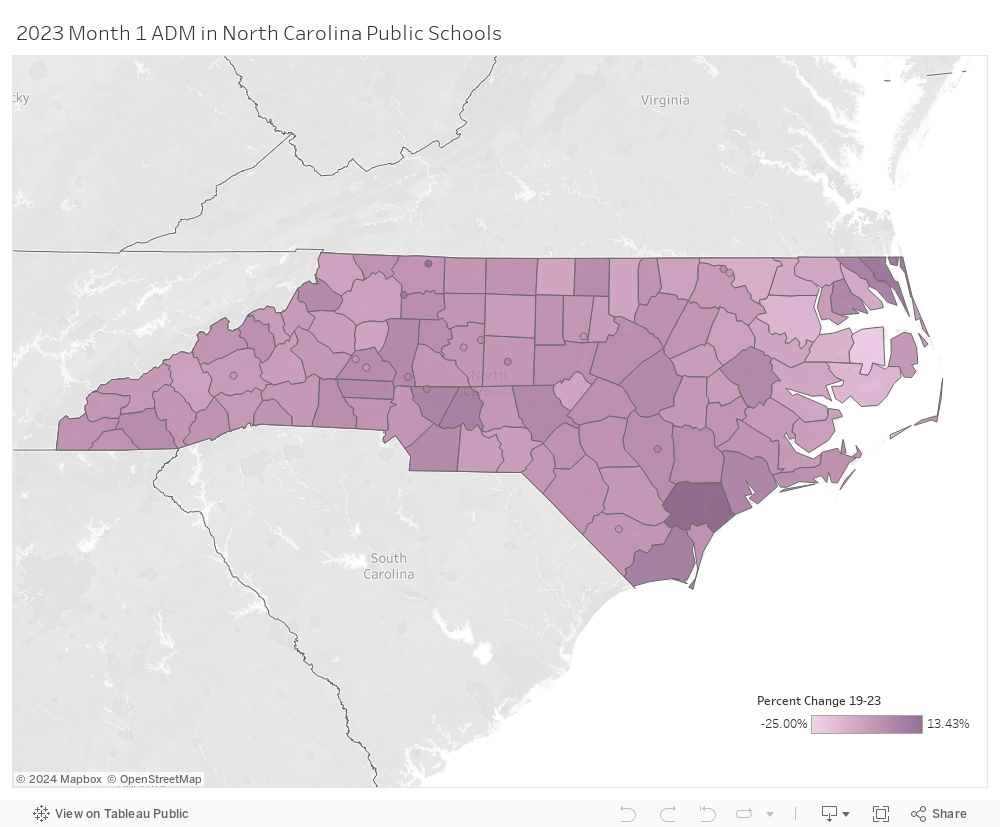
ADM Analysis
This year, most districts experienced a 0.1 to 4.99% fall in ADM compared to last year.
The largest drop was in Warren County Schools, where they lost 6.88% of their students, while the LEA with the most gains with 6.36% in Weldon City Schools.
Here are the top five districts for growth over the past school year:
- Weldon City Schools (6.36%)
- Vance County Schools (2.51%)
- Brunswick County Schools (2.45%)
- Rockingham County Schools (1.74%)
- Sampson County Schools (1.51%)
Year after year, the smallest LEAs produce the largest percentage changes.
For example, Tyrrell County Schools reported an ADM of 445 students. Even though they only lost 32 students compared to the previous year, they still experienced one of the highest percentage drops compared to other districts.
The following are the five districts that took the largest loss of students.
- Warren County Schools (-6.88%)
- Tyrrell County Schools (-6.71%)
- Newton-Conover City Schools (-6.31%)
- Edenton-Chowan Schools (-4.48%)
- Pamlico County Schools (-4.34%)
Each district experienced a smaller change compared to last year, and one district experienced no change at all — Hyde County Schools.
Thirty-one districts saw an increase in ADM.
Schools including charters, lab schools, a regional school, and virtual schools collectively experienced more significant changes since 2019 compared to traditional public schools.
The state legislature this year granted oversight powers to a new Charter School Advisory Board. They are responsible for reviewing and approving school applications and updates about changes, compliance, and student performance.
Of the state’s five largest districts — Wake County Public School System, Charlotte-Mecklenburg Schools, Guilford County Schools, Winston Salem-Forsyth County Schools, and Cumberland County Schools — all of them saw a slight decline, except for Wake County. Their district saw a 1.06% increase.
Data included in this year’s analysis will be the last to be unaffected by school choice expansion. Recent legislation provides more state funding for vouchers for families to send their children to private schools.
Reactions
Those involved in education advocacy do not believe the patterns in charter and traditional public school enrollment can be pinned on one thing.
Matt Ellinwood, a project director at the North Carolina Justice Center, noted disruption from the pandemic and the population changes in different districts throughout the state as causes.
“One factor I would highlight that is not often discussed is that charter schools are located disproportionately in growing urban areas where enrollments in public schools are increasing across the board. Very few are located in rural areas that are experiencing population declines and declining enrollment in local public schools,” Ellinwood said.
Others point to parents’ choices and laws passed at the General Assembly.
Brian Jodice, the executive vice president of Parents for Educational Freedom in North Carolina, said that the trend of North Carolina families seeking options like private schools, homeschooling, and public charters has been on the rise for the past 10 years. The pandemic accelerated this trend, he said.
“I believe that during the height of the pandemic families, perhaps for the first time, had a chance to come face-to-face with their child’s education because, for many of us, it was happening now at our kitchen tables and in our living rooms, when students were home for that extended period,” Jodice said.
He said parents seek other options for a variety of reasons.
“Those reasons range from quality of education, to safety and security, to curriculum, to smaller classroom size, and-on-and-on,” Jodice said. “The key is to listen to those families, there is a lot of value in their why, and I would encourage all school makes and models to listen to families and students.”

Recommended reading