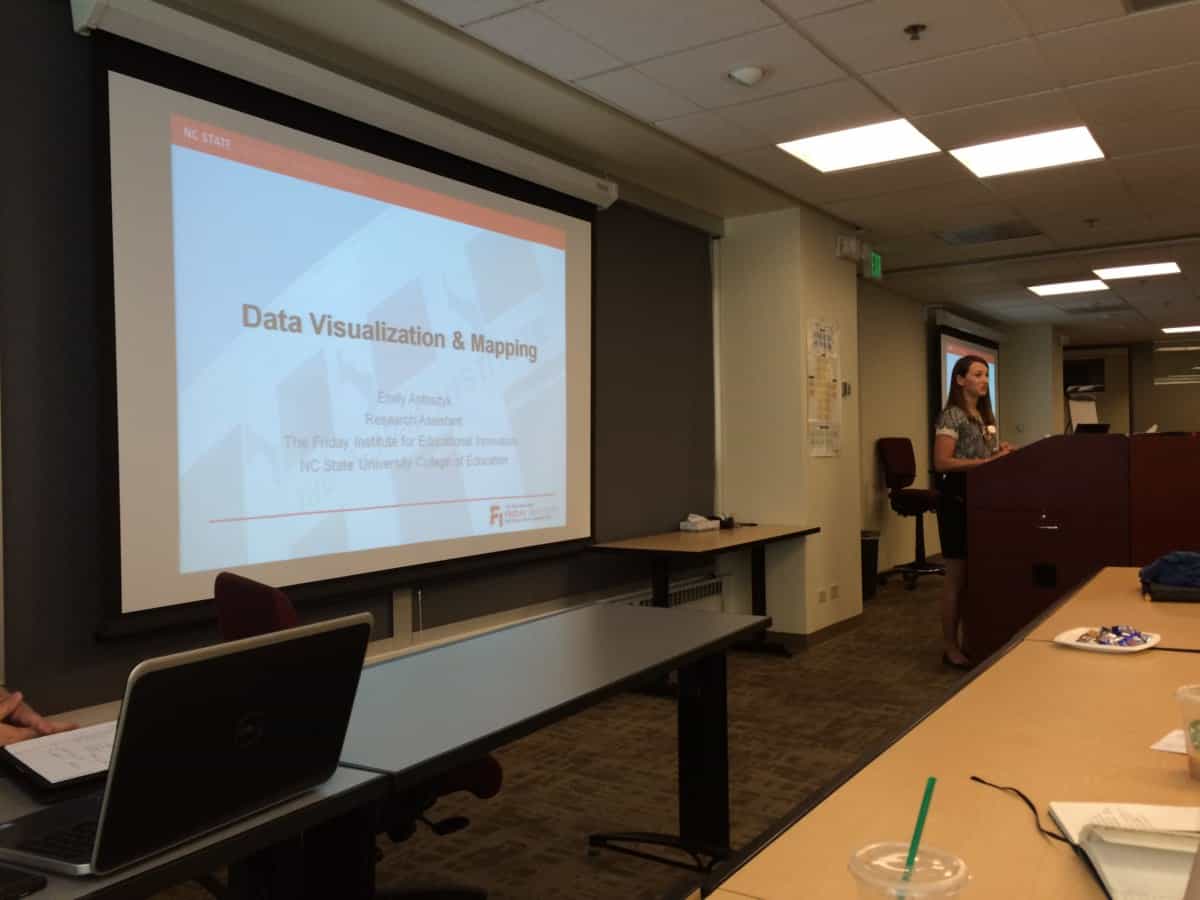
Today EdNC releases our latest map on school grades across North Carolina, developed by Emily Antosyk of the Friday Institute for Educational Innovation.
Antosyk reminds us:
The Department of Public Instruction (DPI) reports school performance grades annually. Reporting of grades began in 2013-14.
Academic achievement, including measures of student progress like test scores (ex. End-of-Grade, End-of-Course, and ACT test results), graduation rates, and measures of work readiness, makes up 80 percent of a school’s grade. School growth, measured by the extent to which students met or exceeded the state’s performance expectations for that school for that year, makes up the other 20 percent.
Currently, DPI reports grades on a 15-point scale.
The power of this map is that it gives YOU control. You get to choose the percentages based on your values to see how the grades change — statewide and for particular schools. You get to choose whether you want to use a 10-point or 15-point grading scale.
Here is a link to Antosyk’s map and lots of information about how to use the map. Take a look, and create a map that reflects your values. Then take a screenshot of the map and share it with us on Twitter @EducationNC.
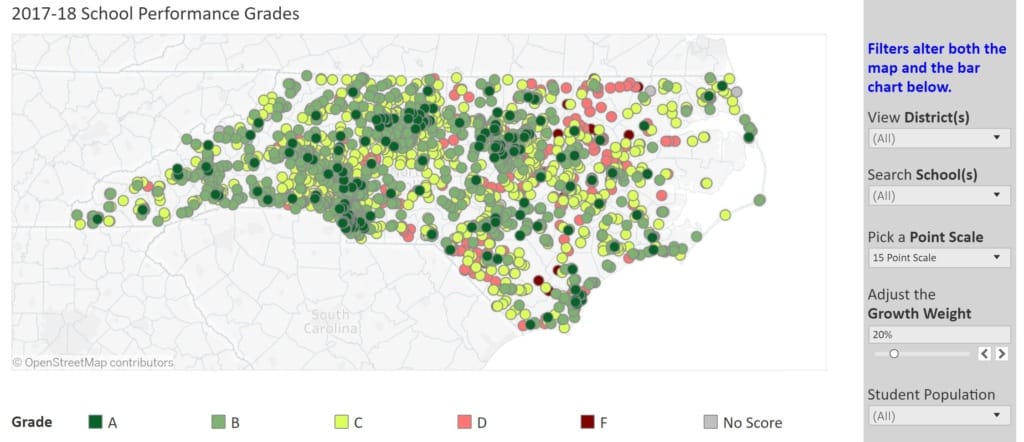
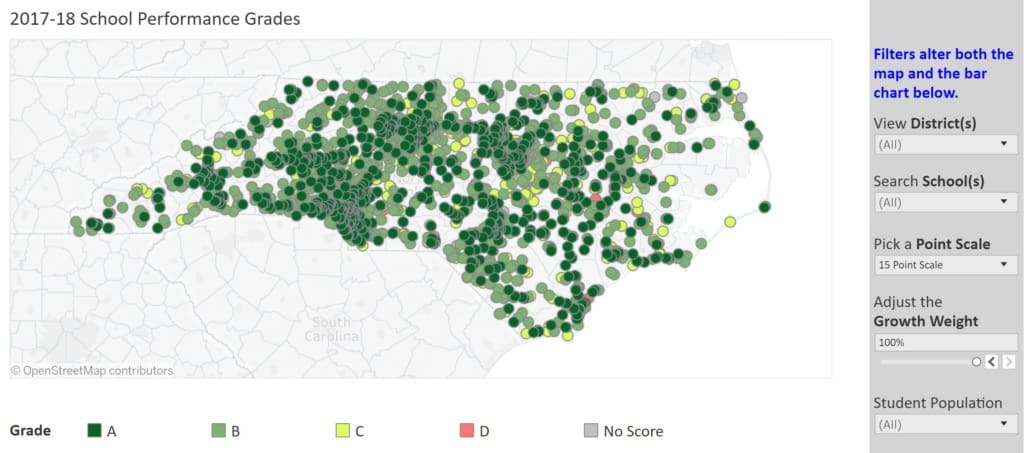
This is the map with 80 percent achievement/20 percent growth and the 15-point scale.
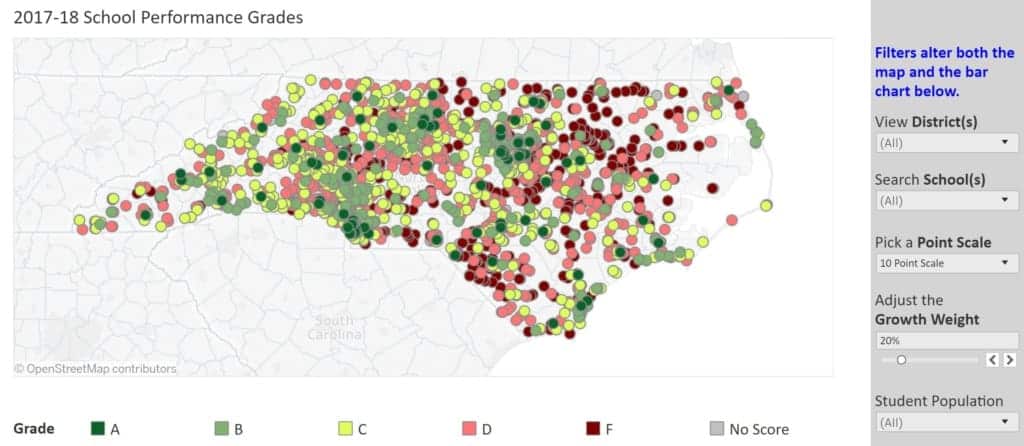
This is the same map with the 10-point scale.
You could choose to have grades based on 100 percent achievement, 100 percent growth, flip it so that it is 20 percent achievement and 80 percent growth, or try out 50/50. The following maps use the 15-point scale.
This is the map with 100 percent achievement.
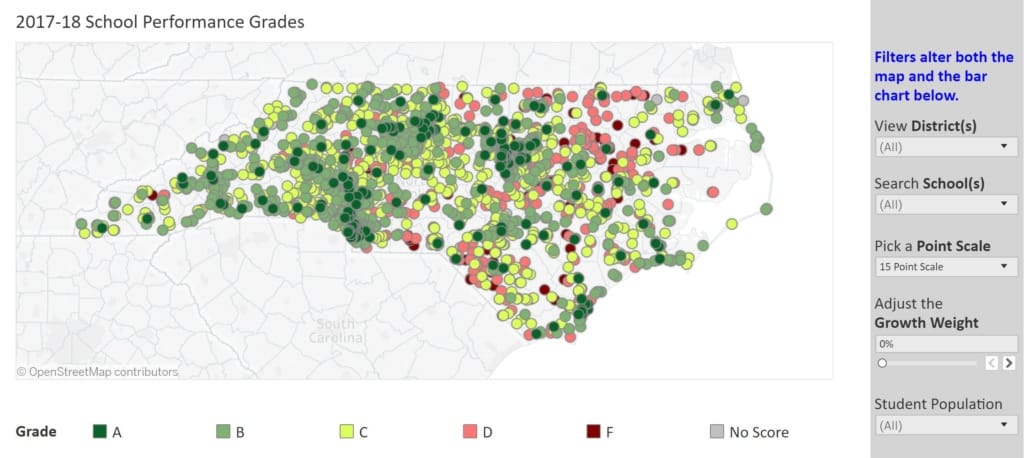
This is the map with 100 percent growth.
This is the map with 20 percent achievement and 80 percent growth.
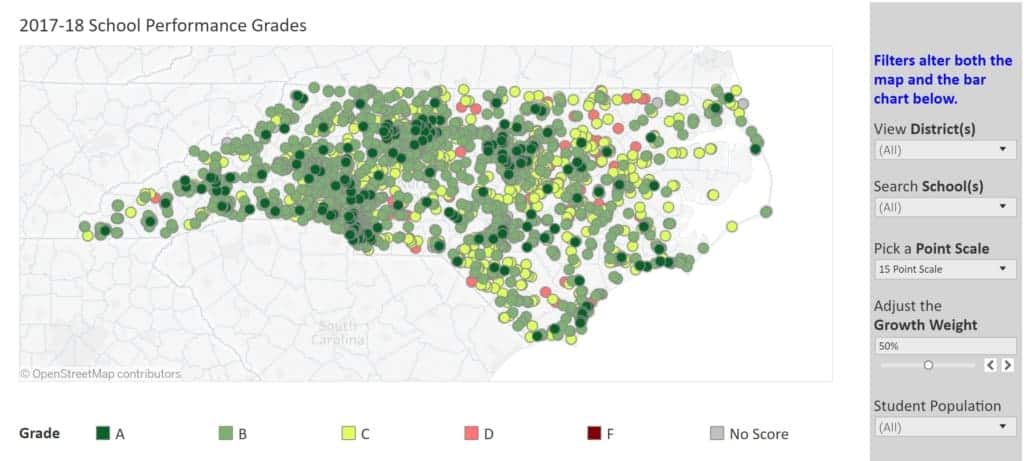
This is the map with 50 percent achievement and 50 percent growth.
EdNC had this tool created to empower you — all of you — to take a deeper look at how these public policy choices — to have school grades, to use the existing 80/20 split, and the 15-point scale — impact your perception of our schools.
We hope that parents, school administrators, and policymakers will continue to use Antosyk’s map to have a conversation about whether or how our current system of measuring school achievement should be changed.

Recommended reading