Share this story
Since January 2022, North Carolina’s Division of Child Development and Early Education (DCDEE) has operated an online dashboard where people can learn about the availability of child care across the state.
But for those looking for more nuance, there’s another resource that provides much greater detail — a nearly 1,000-page monthly report.
DCDEE’s Child Care Statistical Report is the most comprehensive publicly available information about the availability of child care at licensed home-based facilities and centers. EdNC is here to walk you through where to find it and how to use it.
How to access the report
On the main DCDEE website, hover over “County” on the menu bar that runs across the top of the page. From the dropdown menu, select “Child Care Statistical Reports.” Or you could just click here.
For the most recent report, simply scroll down to see the list of months from the current year. (You can also see past years’ data by clicking on the plus sign to the left of the year.)
The reports are released approximately 60 days after the end of each month. As of January 2023, the most recent available report is from December 2022. Select the desired month to open a lengthy (and somewhat intimidating) PDF document.
Don’t panic! EdNC is here to break down the report into manageable pieces that can help you learn more about licensed child care in your county.
How to use the report
The report is organized alphabetically by county, and each county has five sections of data:
- Child Care Analysis Detail: Homes
- Child Care Analysis Summary: Homes
- Child Care Analysis Detail: Centers
- Child Care Analysis Summary: Centers
- Child Care Analysis Summary: Combined Homes and Centers
To find the county you’re interested in, you can scroll down or use keyboard shortcuts to search for the county by name.
Child Care Analysis Detail: Homes
The first information you’ll see for any county is “Child Care Analysis Detail: Homes” — a list of every licensed family child care home in the county. According to DCDEE, a licensed family child care home is “a child care arrangement located in a residence where, at any one time, more than two children, but less than nine children, receive child care.” Those arrangements are more commonly referred to in the industry as home-based care.
We’ll use Pasquotank County to show you examples of what each section of a county report looks like. We’ve circled the title on each screenshot to help you navigate.
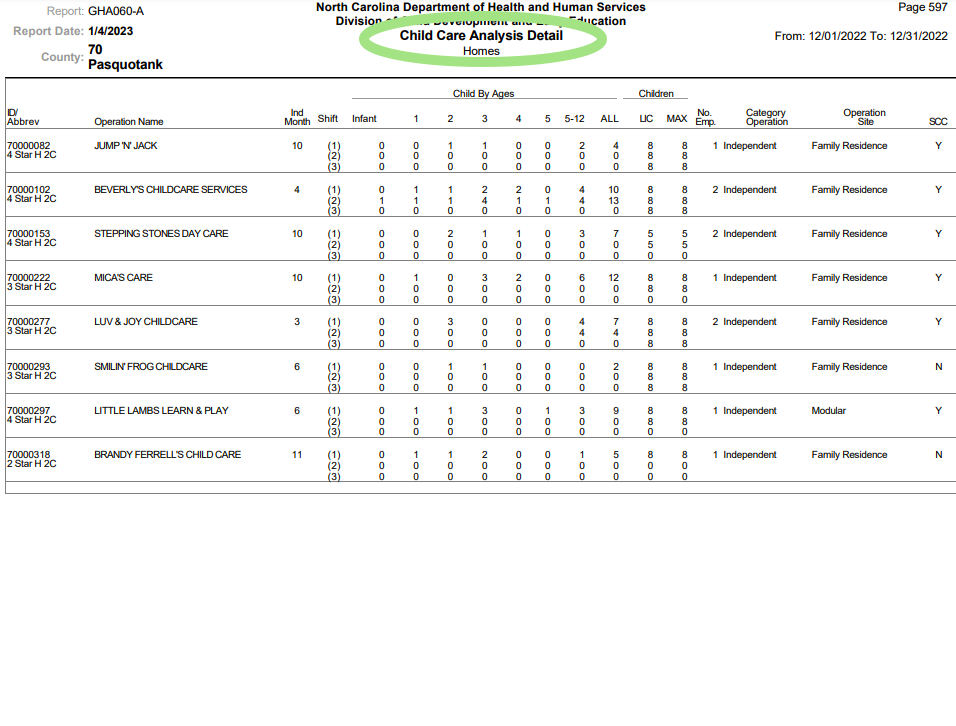
The far left column includes information about the provider’s license, including how many stars the provider has (out of five).
The second column is the name of the site.
The third column indicates the site’s fire inspection renewal month.
Starting in the fourth column, you can see how many children are enrolled at this location based on age and work shift.
The next two columns are labeled “LIC” and “MAX.” LIC refers to the maximum number of children the site is licensed to serve. MAX is the maximum number of children the site can currently serve based on the number of employees. These numbers are often the same, but if a site is short-staffed and cannot meet the necessary teacher-to-student ratios, MAX may be less than LIC.
The column labeled “No. Emp.” lists the total number of employees, with no distinction between full-time or part-time employees.
The last three columns contain information about the category of the operation, its physical site, and whether it accepts subsidized child care.
Child Care Analysis Summary: Homes
Following the list of home-based child care sites in the county, you’ll find a single page — the “Child Care Analysis Summary: Homes” — that summarizes the data for home-based care countywide.
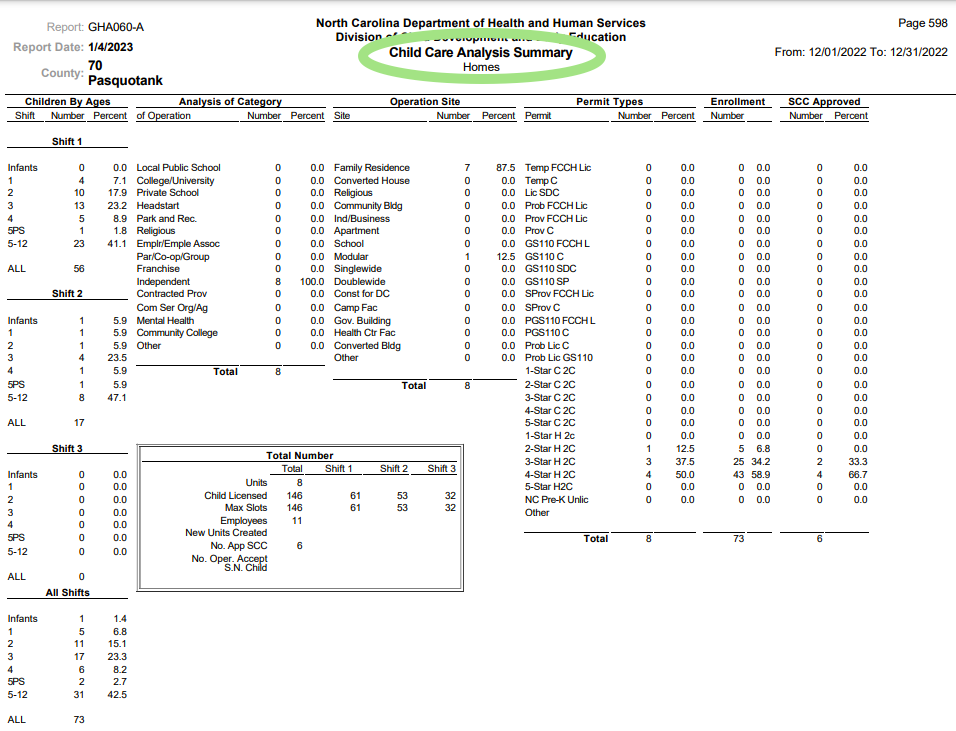
On the left is a breakdown of how many children of each age are served based on work shifts. In addition to the number of children, DCDEE also includes the percentage of total children served in each shift on the right edge of this column. The same information for all shifts combined can be found in the bottom left corner.
The second column is labeled “Analysis of Category” and includes the number and percentage of each type of provider, including public school, college/university, community college, Headstart, religious, independent, franchise, etc.
The third column does the same thing as the second, but for “Operation Site.”
The fourth column has information about permit types, followed by the number of students enrolled in each permit type and the number of students using subsidized child care in each permit type.
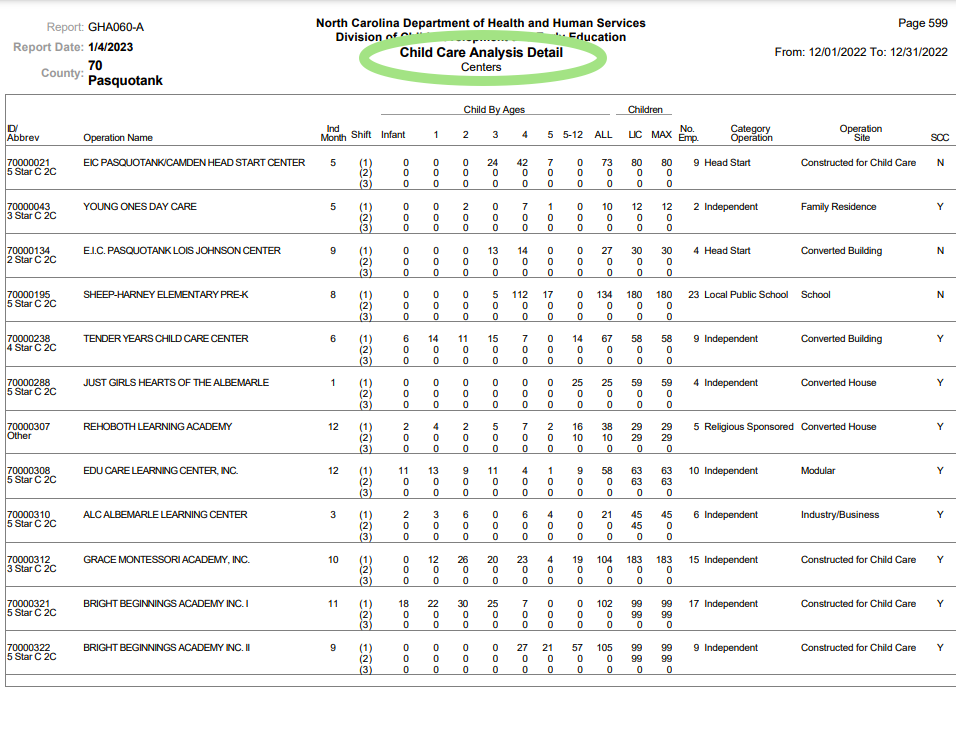
Child Care Analysis Detail: Centers
Next will be a list of every licensed child care center in the county. According to DCDEE, a licensed child care center is “a child care arrangement where, at any one time, there are three or more preschool-age children or nine or more school-age children receiving child care. This also includes a center located in a residence, where the program is in a residence and the licensed capacity is six through twelve children, or up to fifteen school-age children.”
This section is organized the same as the first section (“Child Care Analysis Detail: Homes”).
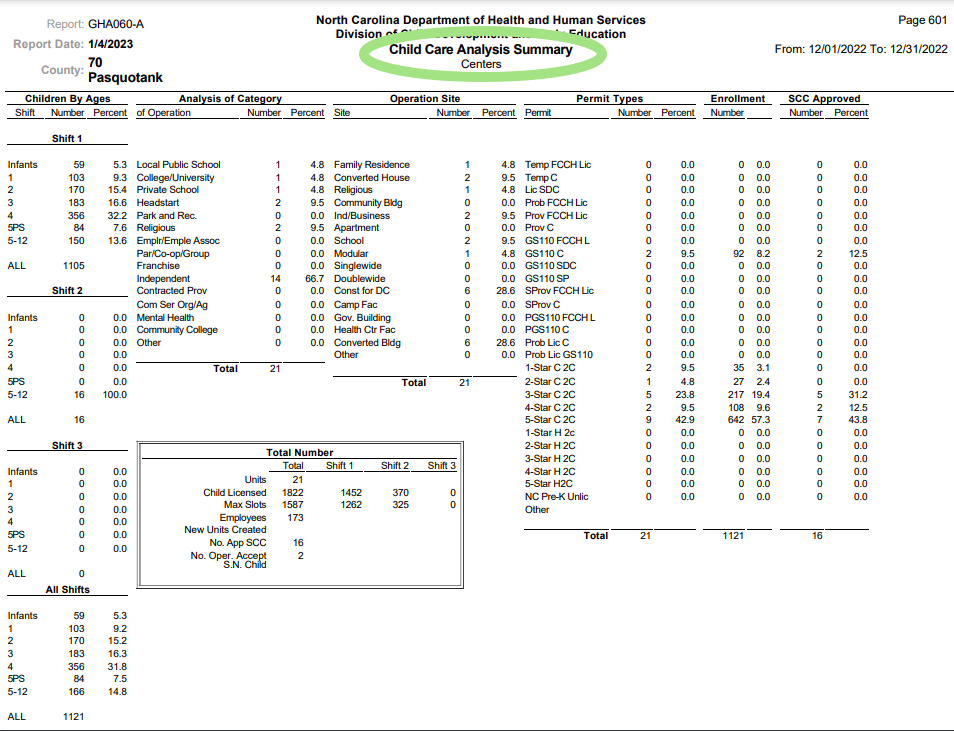
Child Care Analysis Summary: Centers
Following the list of child care centers in the county, you’ll find another single page — the “Child Care Analysis Summary: Centers” — that summarizes the data for child care centers countywide. It’s organized the same way as its home-based care counterpart.
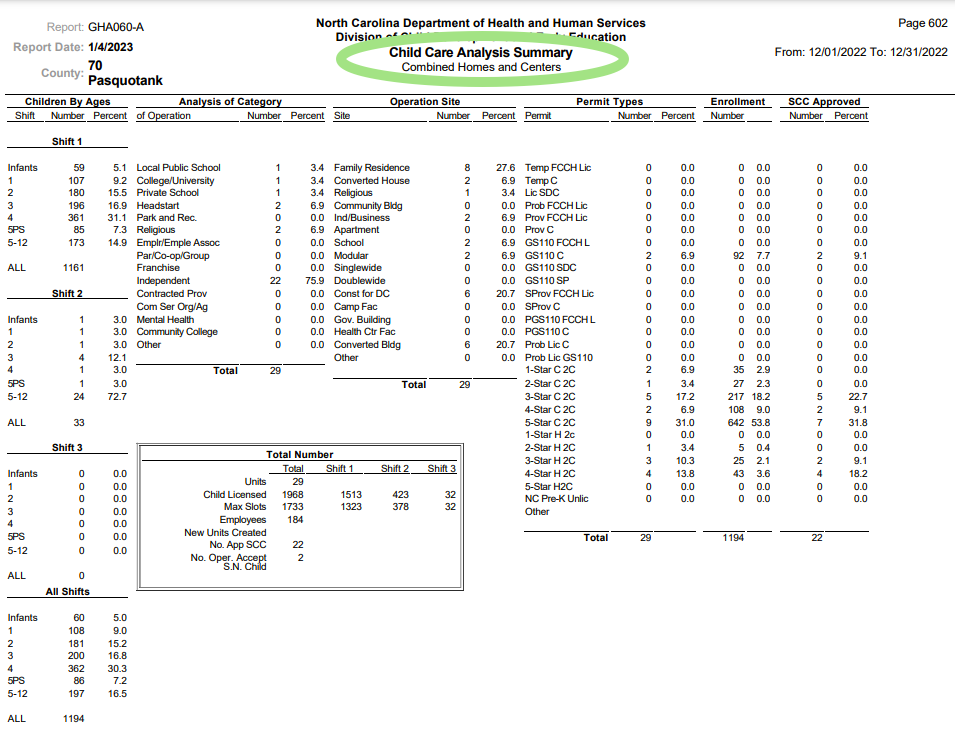
Child Care Analysis Summary: Combined Homes and Centers
The last section for each county is a single page that includes the combined countywide data for family child care homes and child care centers. This is the best resource if you’re looking for a relatively quick and comprehensive snapshot of the data for a particular county. It’s organized the same way as the other Summary pages.
![]() Sign up for Early Bird, our newsletter on all things early childhood.
Sign up for Early Bird, our newsletter on all things early childhood.
How to share your findings
EdNC would love to know what you find in the report. For example, in Pasquotank County’s December 2022 report, we noticed there are no 5-star licensed family child care homes. This raises questions about the types of barriers that home-based care providers may face during licensing.
Another interesting find is that neither Hyde County nor Polk County has a single child care site currently providing infant or toddler care. This suggests parents in these counties —and likely others — may have limited options for the early care and education of children under age 3.
What can you learn about child care in your county? Email your own findings to Katie Dukes via kdukes@ednc.org, or tweet them to us via @kneldukes and @EducationNC on Twitter.
Editor’s Note: This article has been updated with additional information since its original publication.

Recommended reading