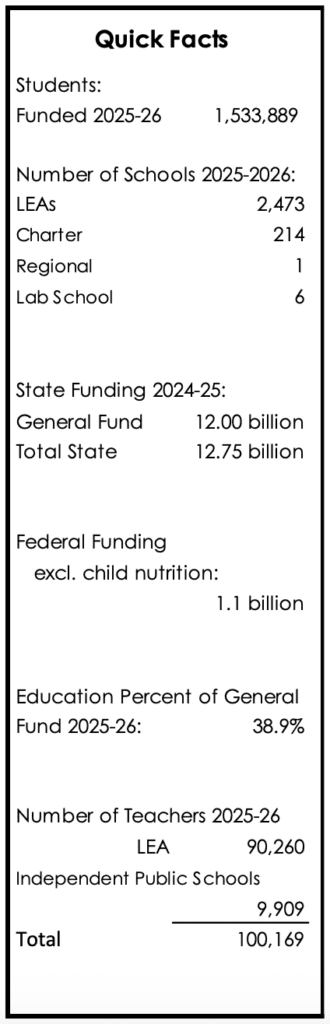
North Carolina public schools received $12.75 billion in state funding and $1.1 billion in federal funding during the 2025-26 school year — excluding child nutrition and the last of federal relief funds — according to the Department of Public Instruction’s (DPI) latest “Highlights of the North Carolina Public School Budget” report.
The annual report includes information on the number of students, teachers, and schools in North Carolina, along with things like class size ratios, how many districts are considered low wealth or small, and more.
“Funding public education in North Carolina is a complex and integrated process,” the report says. “This booklet presents charts and tables which describe how state and federal funds are distributed to North Carolina’s Public Schools. It also reviews the changes in average daily membership (ADM) and school personnel.”
There were 1,533,889 students funded and 100,169 teachers across North Carolina schools during the 2025-26 school year, according to the report, reflecting a slight decrease in enrollment, from 1,538,563 students and 100,072 teachers in 2024-25.
During the same time period, the amount of non-child nutrition federal funding remained the same. However, total state funding slightly increased, from $12.6 billion in 2024-25 to $12.75 billion.
According to the report, the state funds public schools in North Carolina through three types of allotments:
- Position allotments: “The State allots educator positions to a local school district for a specific purpose. The local school system pays the educator according to the State salary schedule without being restricted to a specific dollar amount. Each district’s average salary will reflect the average experience and education in their district.” Examples of these positions include teachers, instructional support personnel, school building administrators, and school health personnel, like psychologists and counselors.
- Dollar allotments: “School districts receive a dollar amount for non-certified employees and to purchase goods.” Examples of these types of allotments include teacher assistants, central office administration, textbooks and digital resources, and classroom materials, equipment, and supplies.
- Categorical allotments: “Funding to address differences in student and district characteristics. The funds are to supplement the base funding to provide additional resources, including teachers, for specific populations of students. Categorical allotments include supplemental funds for districts that are low wealth or have a small number of students.” Examples of these allotments include funding for at-risk student services, supplements for low-wealth counties, children with disabilities, and students with limited English proficiency.
The state can also award funds for school-level programs or grants, according to the report, which are “for restricted purposes or schools.” Examples of this type of funding include advanced teaching roles, mobile coding, and funds for Cooperative Innovative High Schools (CIHS).
In the subheadings below, you can find an overview of the 52-page report. As you look at the data, pay attention to the year of the data in the charts, which schools are included, and the sources of funding.
You can also find previous reports on DPI’s website, starting from 2004.
![]() Sign up for the EdDaily to start each weekday with the top education news.
Sign up for the EdDaily to start each weekday with the top education news.
First, education definitions to know
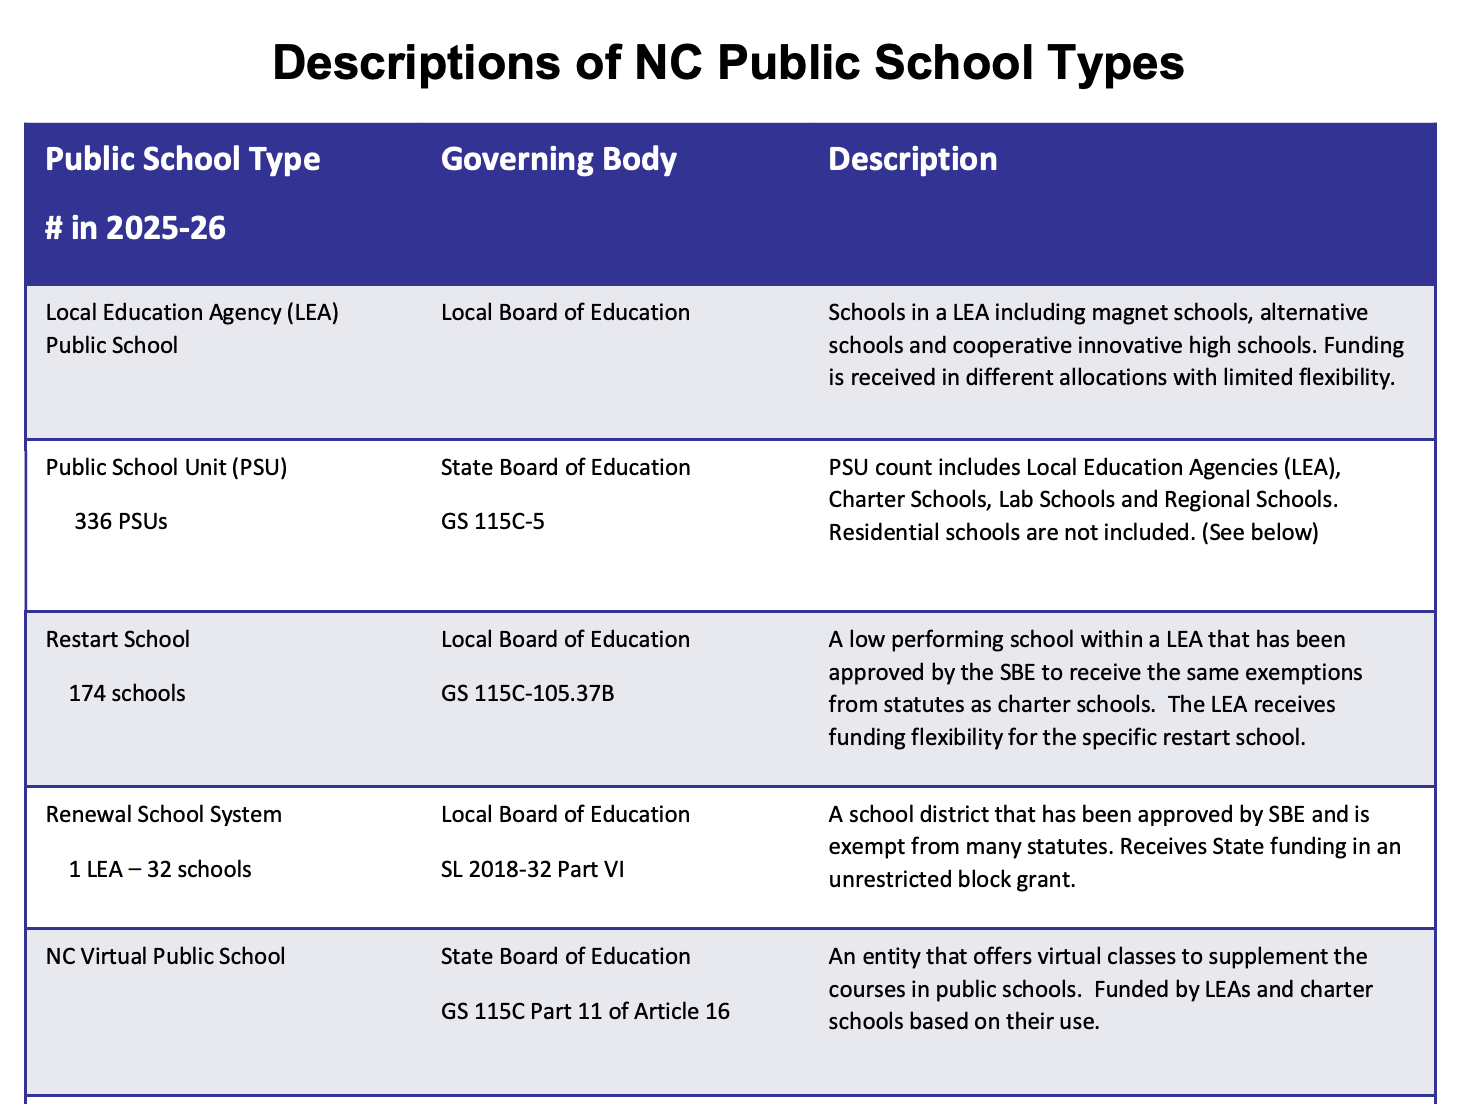
The report kicks off with handy definitions and common acronyms from across the state’s education system you’ll need to know.
Page 2 defines various independent public schools, like regional school, charter school, lab school, and residential school. These are “exempt from statutes applicable to LEAs, unless stated otherwise. The entities receive State funding in an unrestricted block grant.”
More on funding and expenditures
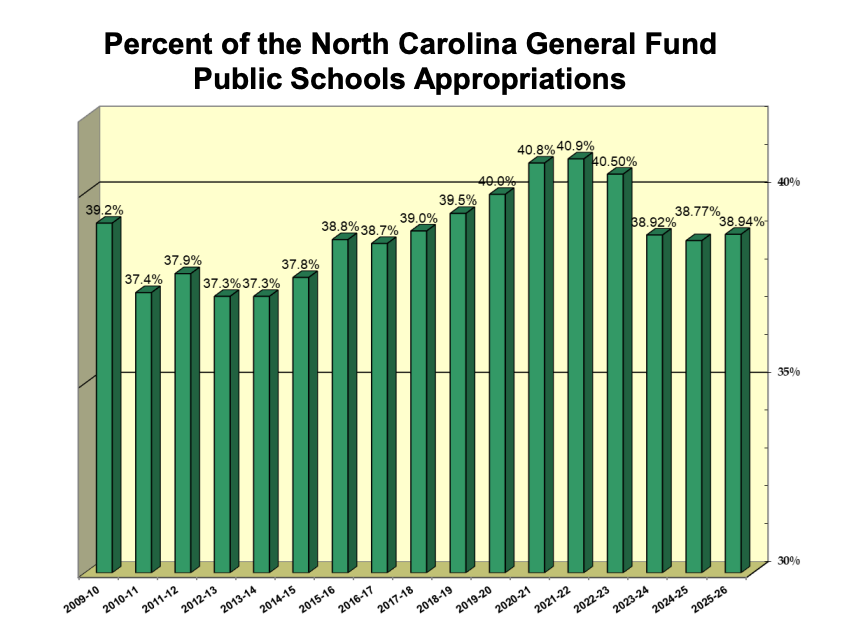
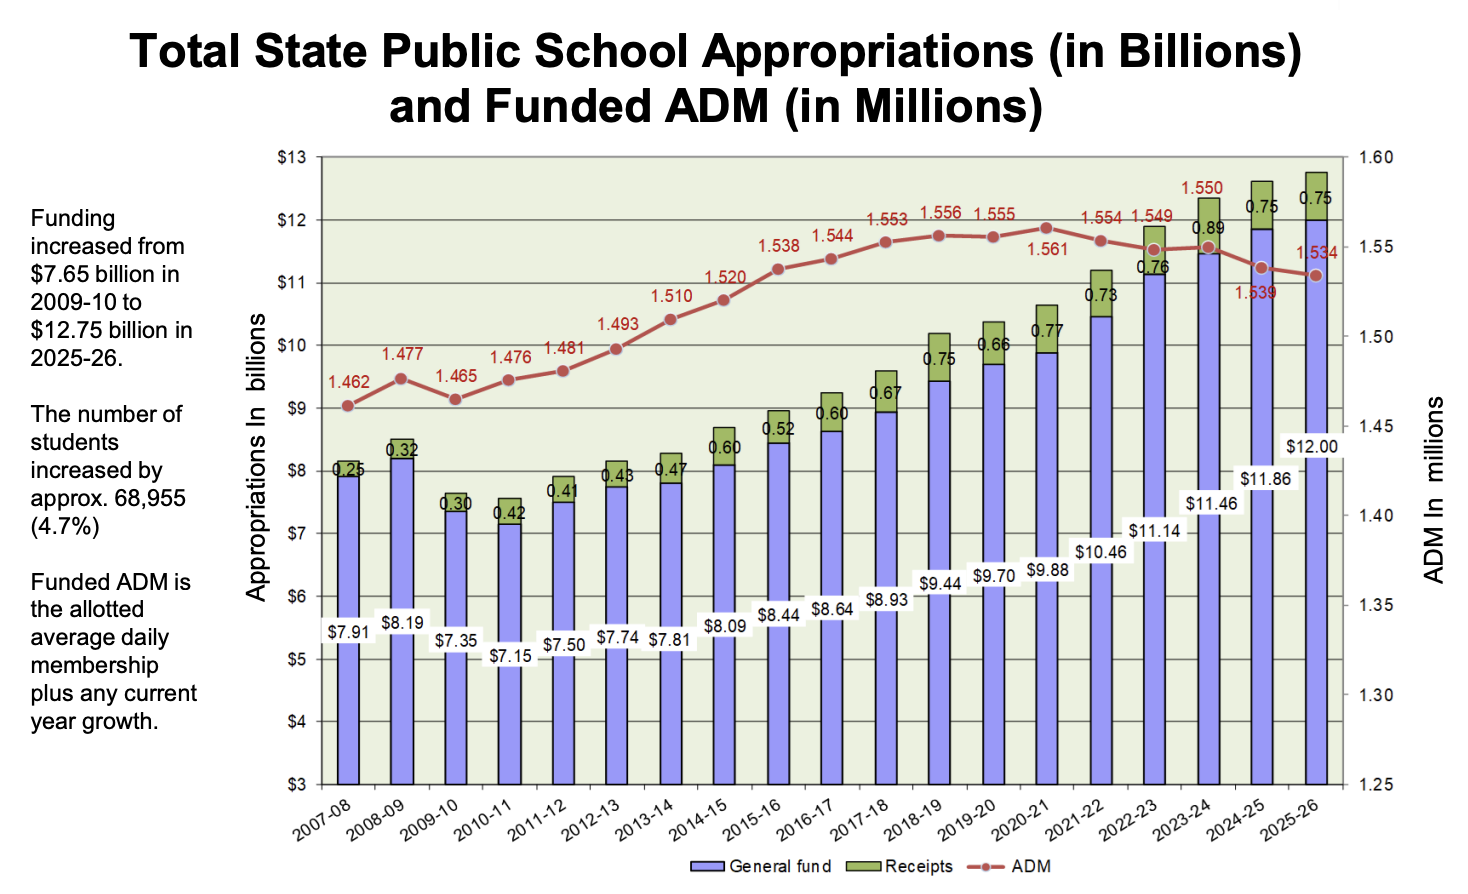
Page 3 features charts showing the percentage that appropriations for K-12 public schools make up in North Carolina’s general budget fund, along with a look at the total state public school appropriations compared to the allotted Average Daily Membership (ADM).
This year’s report shows that while total funding increased from $7.65 billion for public schools in 2009-10 to $12.75 billion in 2025-26, the percentage of public school appropriations in the general budget has slightly decreased over the same time period.
Since 2009-10, the number of students has increased by approximately 68,955 students, or by 4.7%.
Page 4 shows the percent of expenditures funded by federal, state, and local dollars with and without child nutrition included. This data is for 2024-25.
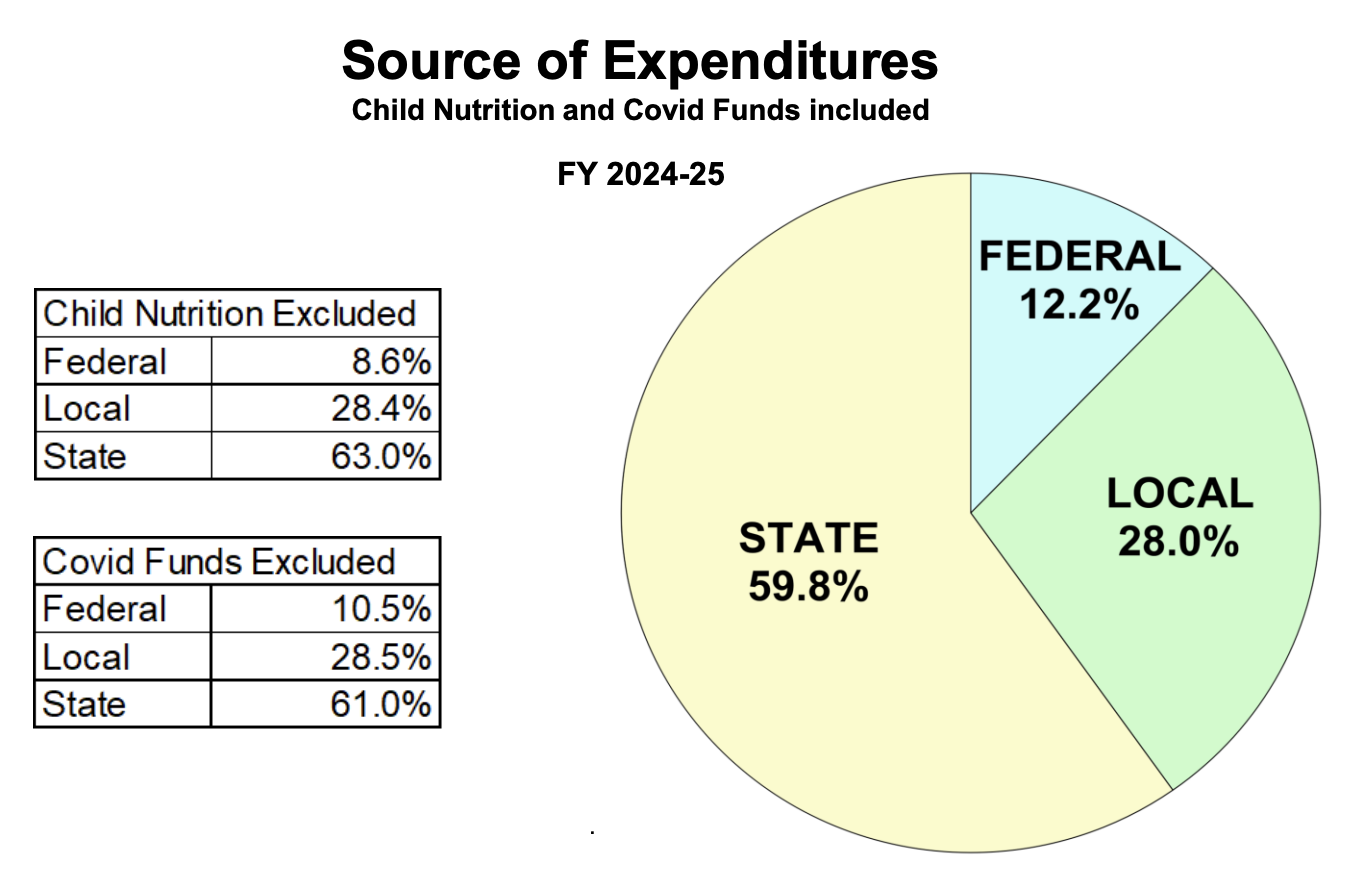
In last year’s report, the percentage of federal funding increased significantly — around 7 percentage points — when COVID relief-funds were included. This year, that percentage increased less than 2 percentage points when COVID funds are included.
During the height of the pandemic, the state received $3.6 billion in Elementary and Secondary Schools Emergency Relief (ESSER III) funds. But schools were required to spend those funds by the fall of 2024.
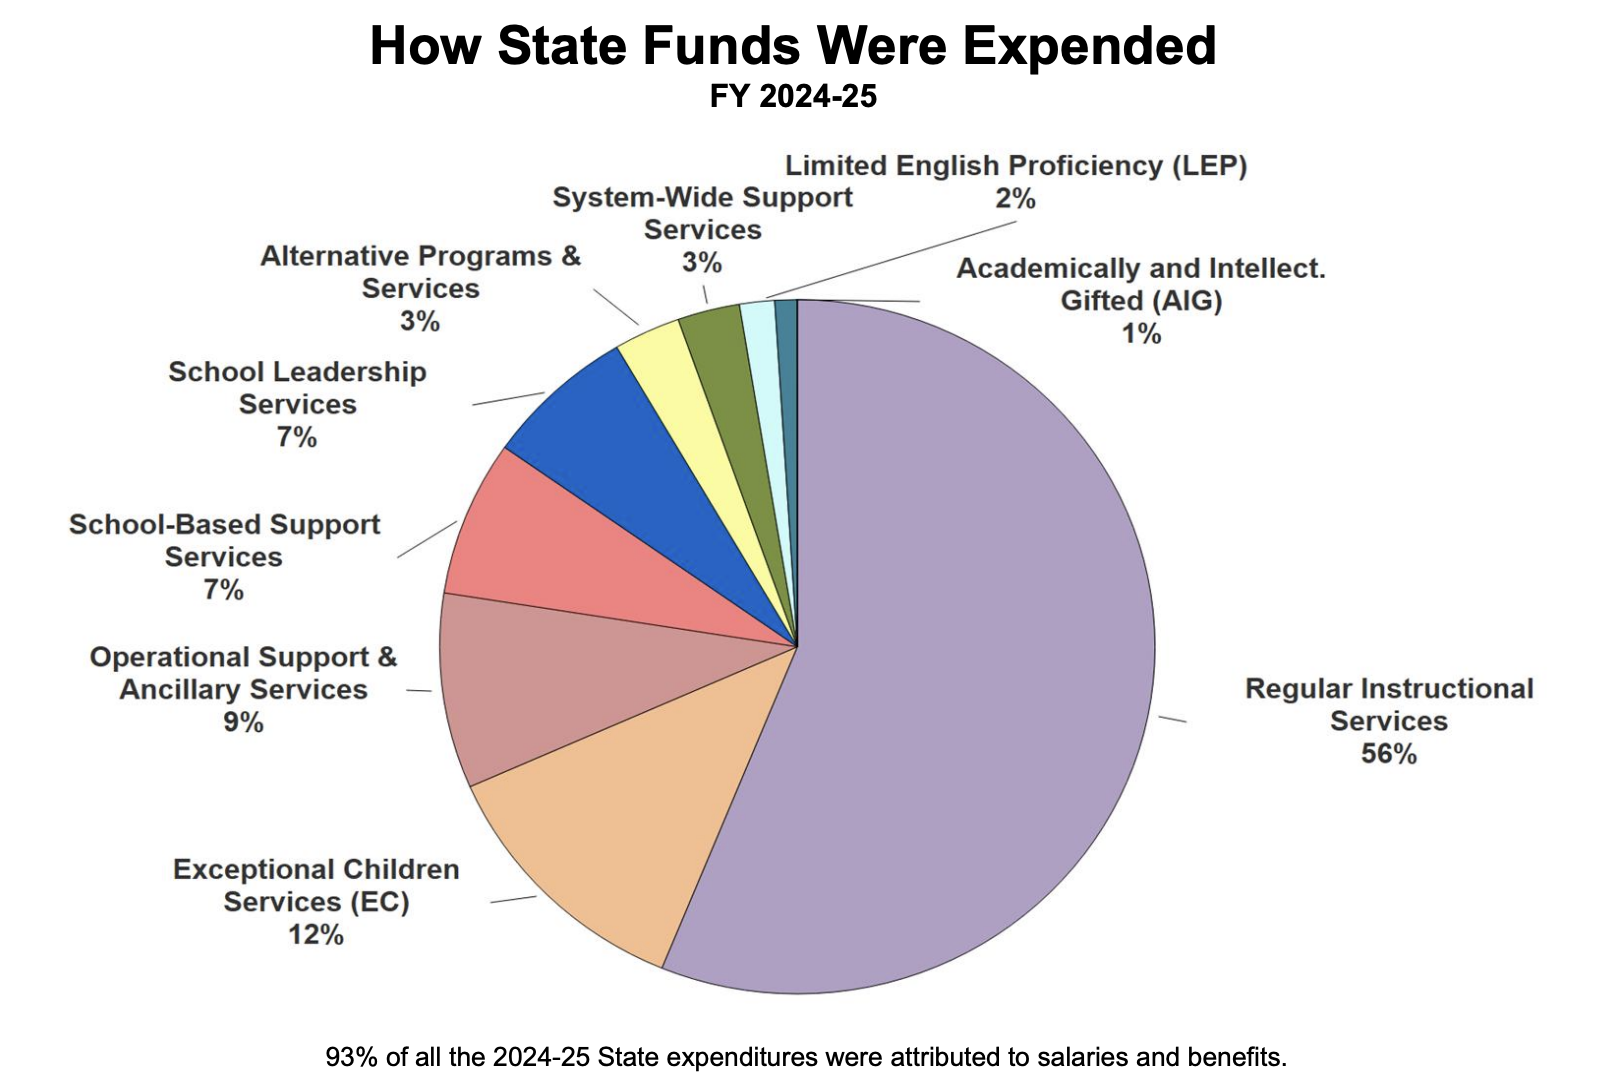
On the bottom of page 4, you can see a breakdown of how state funds were used in Fiscal Year (FY) 2024-25.
According to the report, 93% of all the 2024-25 state expenditures went toward salaries and benefits. Although salaries represent the largest share of public school budgets, the state has traditionally funded most operational expenses, including salaries, in North Carolina.
The following page shows the state-funded expenditures for local education agencies (LEAs), which doesn’t include charter, regional, or lab schools.
In 2025-26, LEAs spent nearly $11.1 billion in state funds.
$7.17 billion of those state funds went toward salaries, including $4.25 billion for teachers.
LEAs spent $3.16 billion in state funds on employee benefits.
The state also spent $450 million on purchased services — a jump of around $60 million compared to last year — and $317 million on supplies and materials, including textbooks and computer software.
These figures do not necessarily represent LEAs’ total spending in each category, as they account only for state expenditures. Districts likely used additional federal and local funding as well.
On page 8, you can see the state appropriations for 2025-26. Expenditures of these funds will be included in next year’s report.
ADM, weighted allotments, and more
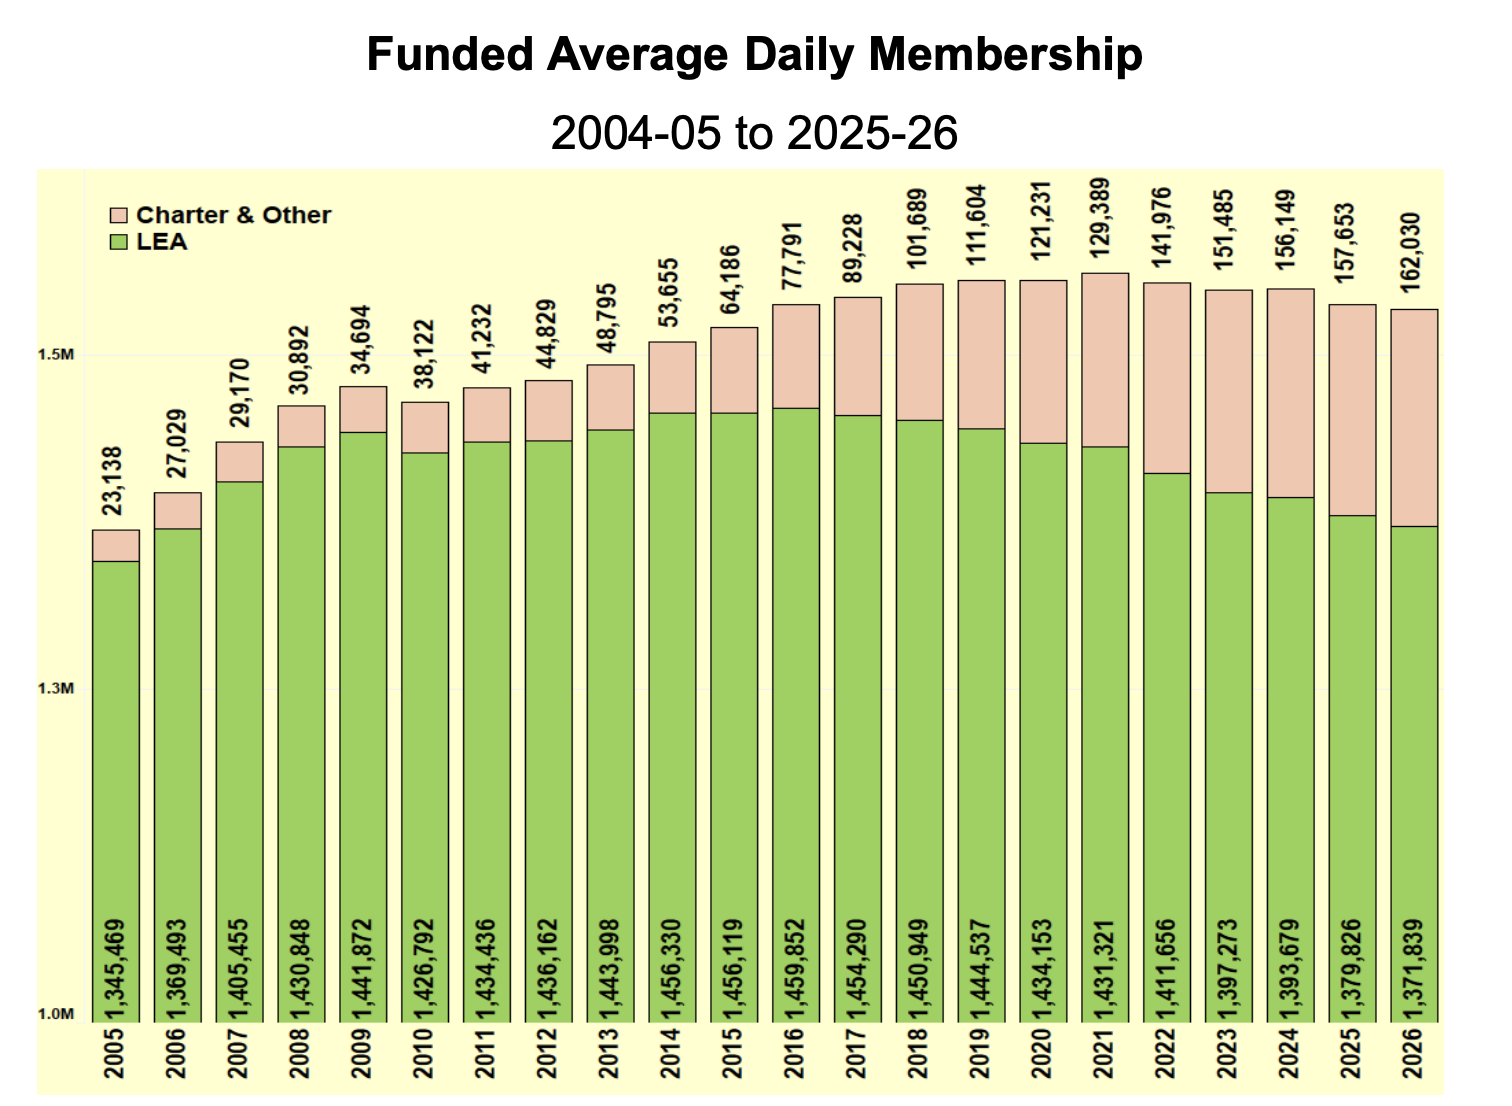
On page 6, you can see how ADM has changed over time, from 2004-05 to 2025-26.
According to DPI, ADM is defined as:
The total number of school days within a given term – that a student’s name is on the current roll of a class, regardless of his/her being present or absent, is the “number of days in membership” for that student. The sum of the “number of days in membership” for all students divided by the number of school days in the term yields ADM. The final average daily membership is the total days in membership for all students over the school year divided by the number of days school was in session. Average daily membership is a more accurate count of the number of students in school than enrollment.
As the graph below shows, the proportion of ADM from nontraditional public schools has increased over time, represented by the pink bar. (It also includes the innovative school district, which closed June 30, 2022.)
Before FY 2025, allotted ADM was the higher number between actual ADM from the prior year and projected ADM of the current year for LEAs. For charters, projected ADM was used.
After 2025, when public schools shifted to a funding in arrears model, all public schools calculate allotted ADM based on the higher of the prior year’s first or second month ADM.
“Additional funding (is) provided if actual ADM is higher than prior year ADM,” the report says. “(There is) no reduction in funding if actual ADM is lower than prior year ADM.”
On page 7, you can see funded ADM by district for 2025-26.
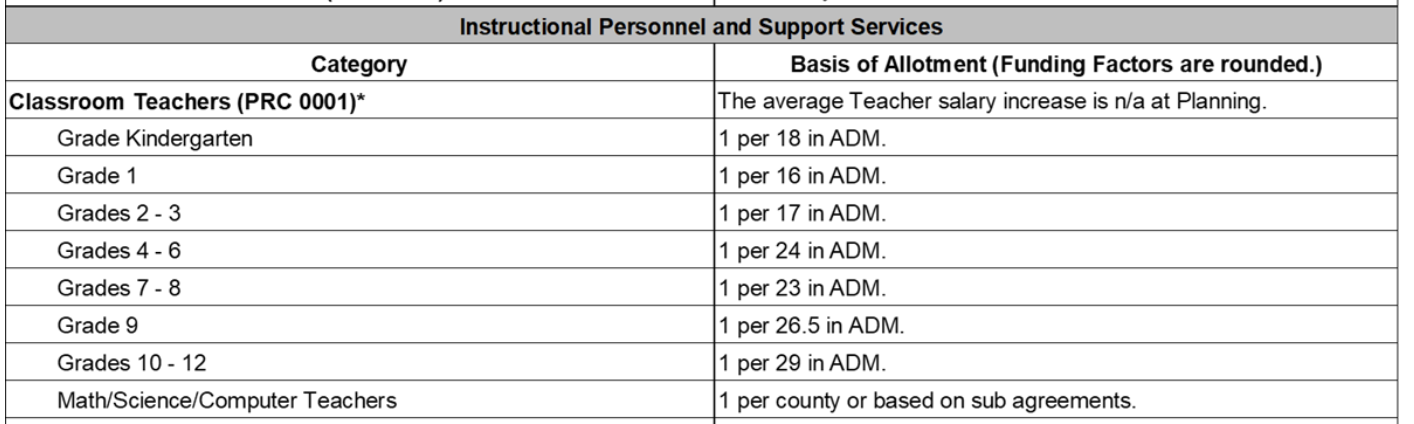
On page 9, you can see the allotment formulas for 2025-26, which also shows the teacher-student ratios for each grade level. You can find more on teacher ratios and class size maximums on page 14.
On page 13, there is an explanation of why it is difficult to compare dollars per ADM across the state’s districts:
- Huge variance in the size of LEAs. ADM ranges from systems with an ADM of 436 to an ADM of 161,321
- Certain fixed costs in LEAs such central office operations
- Less experienced teachers versus veteran teachers (experience levels)
- Fixed Salary Schedules
On page 10, you can find weighted categorical allotments. As a reminder, these funds “are to supplement the base funding to provide additional resources, including teachers, for specific populations of students,” per the report.
This includes categories like academically or intellectually gifted students, at-risk student services, children with disabilities, and more.
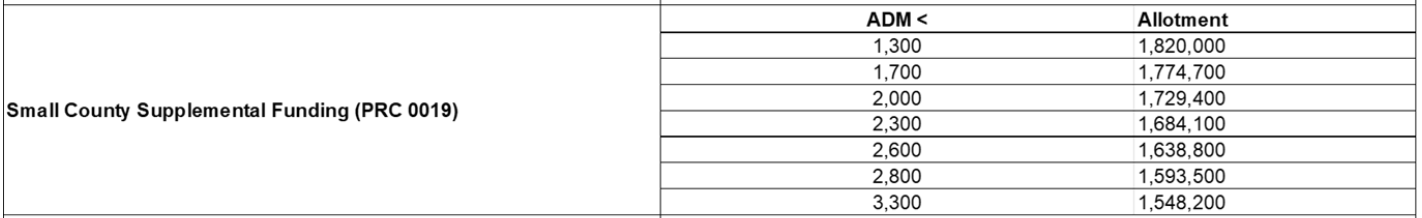
There’s also information on small county supplemental funding:
Page 10 also includes information on budget flexibility for districts when it comes to categorical allotments.
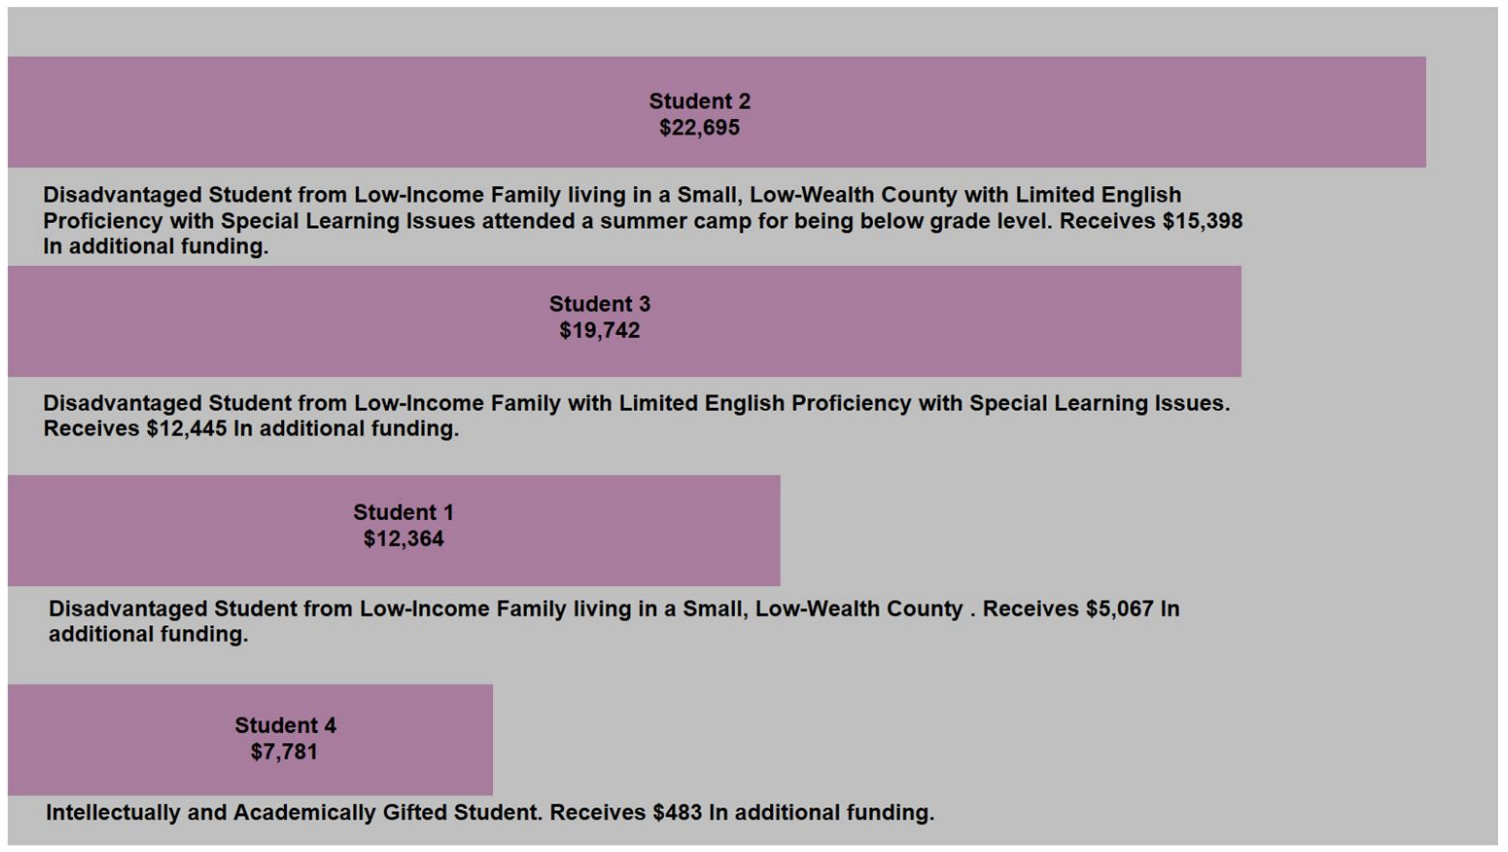
On pages 11-13, you can find information on weighted funding levels, included weighted state funds, weighted federal funds, and an illustration (pictured below) on how weighted funding addresses different student needs.
On pages 19-22, you can find more information on funding for counties that are low wealth. And on pages 23-25, you can find information on small county supplemental funding.
More on salaries
At the bottom of page 9, you can see average salaries for principals, assistant principals, teachers, school health personnel, and others. This figure does not include benefits, which are listed in a different area on the page.
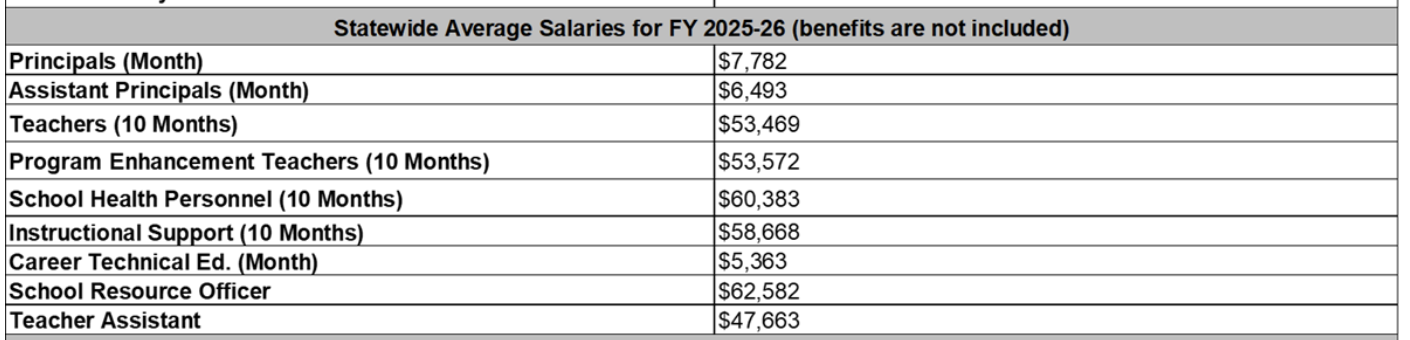
You can find more on state-funded salary positions on page 14, not including locally funded supplements or matching benefits.
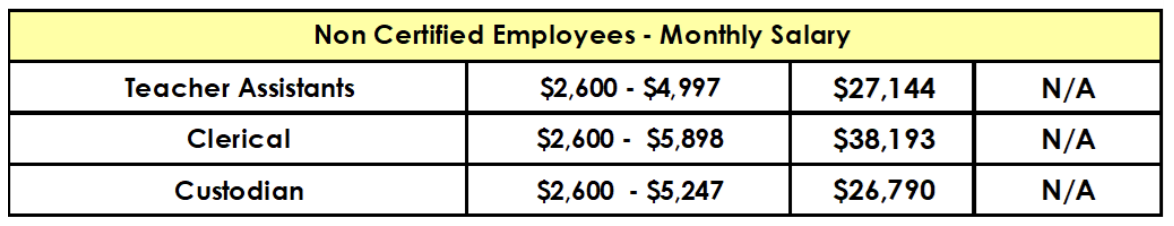
Here’s a look at the pay for noncertified employees:
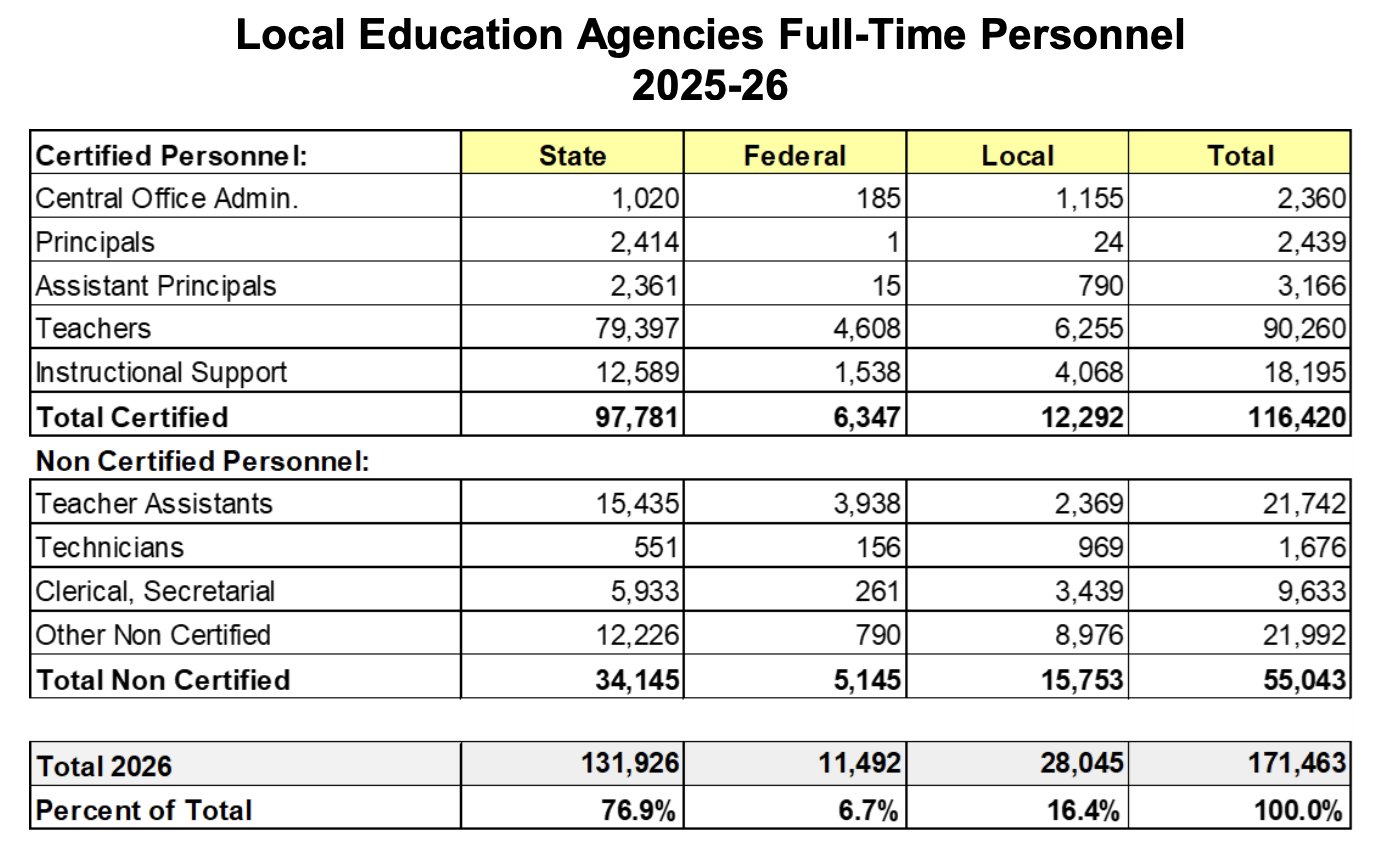
Page 15 shows how many principals, teachers, and other educators North Carolina has in 2025-26, and the chart below also shows you how many are paid out of state, federal, and local funds. There is also information on instructional support positions on the bottom of page 15.
“Teachers, Teacher Assistants, and Instructional Support Personnel make up 75.93% of all personnel,” the report says. “School Building Administrators (Principals & Assistant Principals) make up 3.27% of all personnel. Central Office Administrators make up 1.38% of all personnel. Other Nonprofessionals (Clerical, Technicians, Service Workers, etc.) make up the remaining 19.42% of personnel.”
You can find the history of compensation increases compared to other state employees on page 16, as well as the Consumer Price Index since 2001-02.
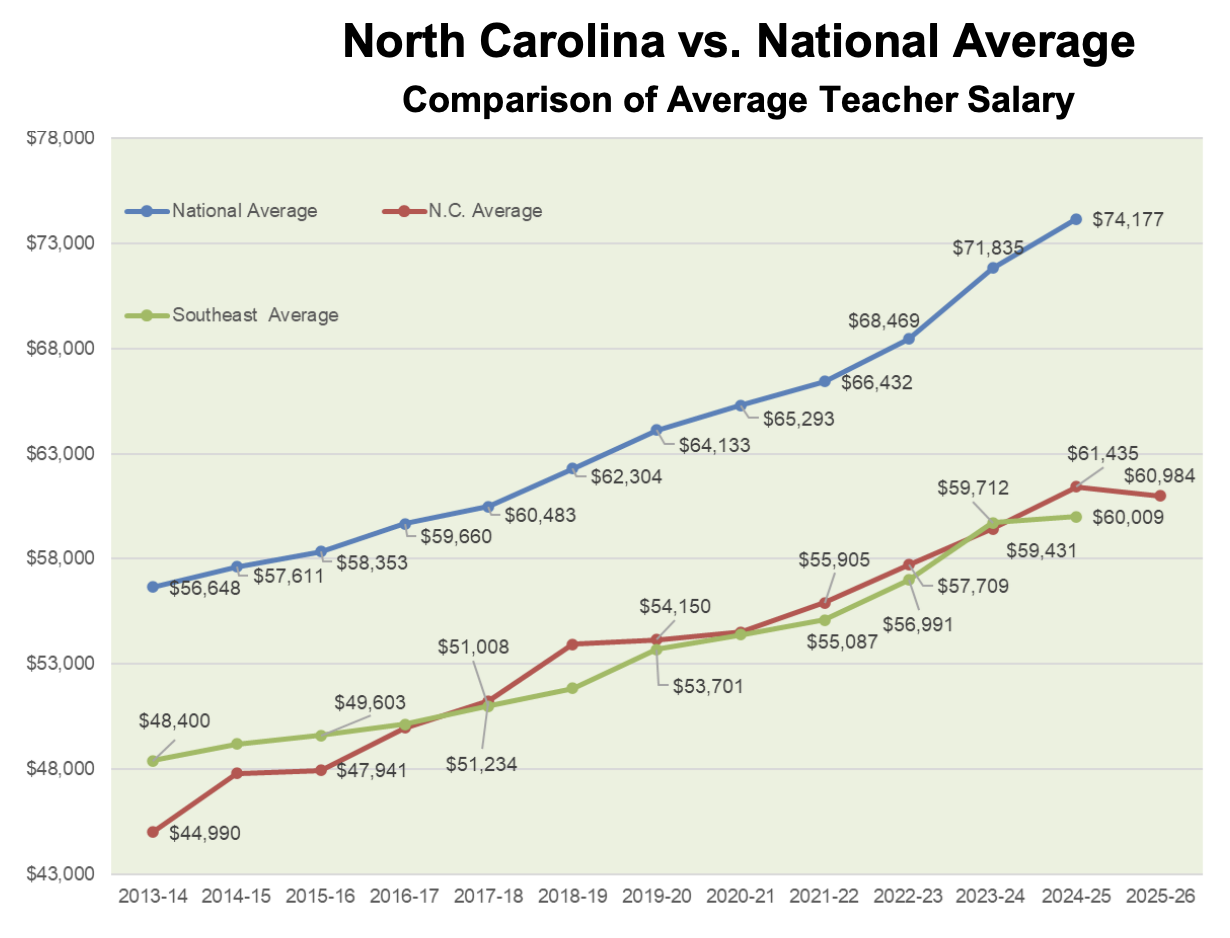
On page 17, there is a chart about average teacher compensation and a comparison of North Carolina teacher pay versus the national average, which uses the NEA Annual Rankings and Estimates.
“NEA defines NC average salary as base salary plus supplementary pay. This was $59,971 and $60,323 in 2026 and 2025, respectively,” the report says. “North Carolina ranks 6th in the Southeast in Average Teacher Compensation. Georgia average $71,524 is the highest, with the group average of $60,008 in 2025.”
The rankings and chart below include Virginia, West Virginia, Alabama, Arkansas, Florida, Georgia, Kentucky, Louisiana, Mississippi, South Carolina, Tennessee, and North Carolina.
More on charter and lab schools
On pages 26-34, there is information on independent public school units, which includes charter, lab, and regional schools.
On page 27, you can see how many charter schools have been approved, opened, and closed since 1996-97, along with the total in operation. The General Assembly passed legislation in 1996 to allow for the creation of charter schools in North Carolina.
“Charter Schools are designed to give significant autonomy to individual schools and in turn to hold these schools accountable for results,” the report says.
During the 2025-26 school year, 10 charter schools were approved, seven opened, and one closed. There were 214 charter schools in operation, according to the report.
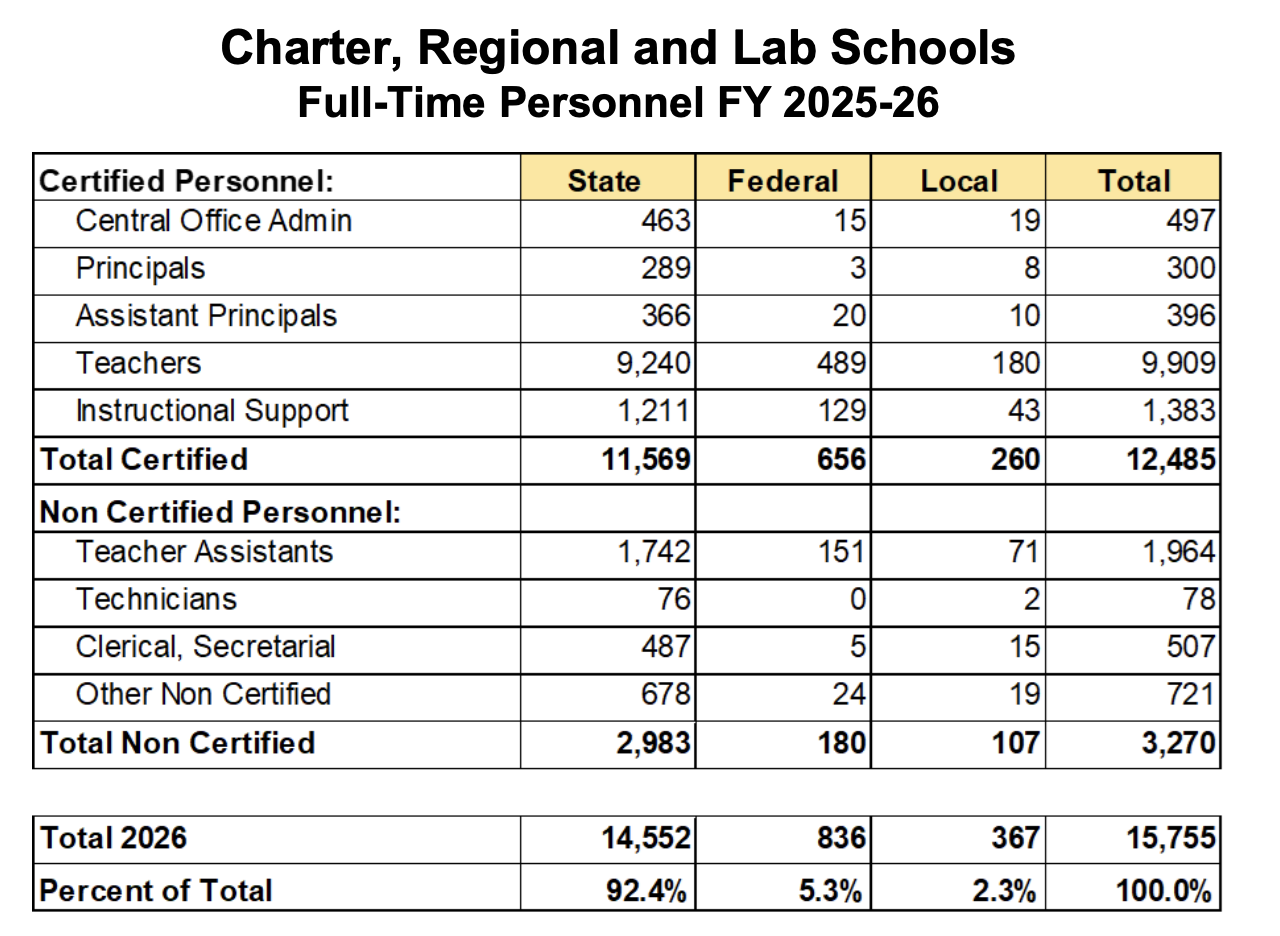
Page 28 includes more information on flexibility independent public schools are granted under the law, including financial and education guidelines. The same page also includes information on the number of full-time personnel at these schools.
Finally, on pages 30-34 you can see the number of charter schools in each county, along with the funded ADM and total state funding for each charter school.
Read more
Federal funds and lottery revenues
The last sections of the report include more information on federal funding and capital and lottery funds.
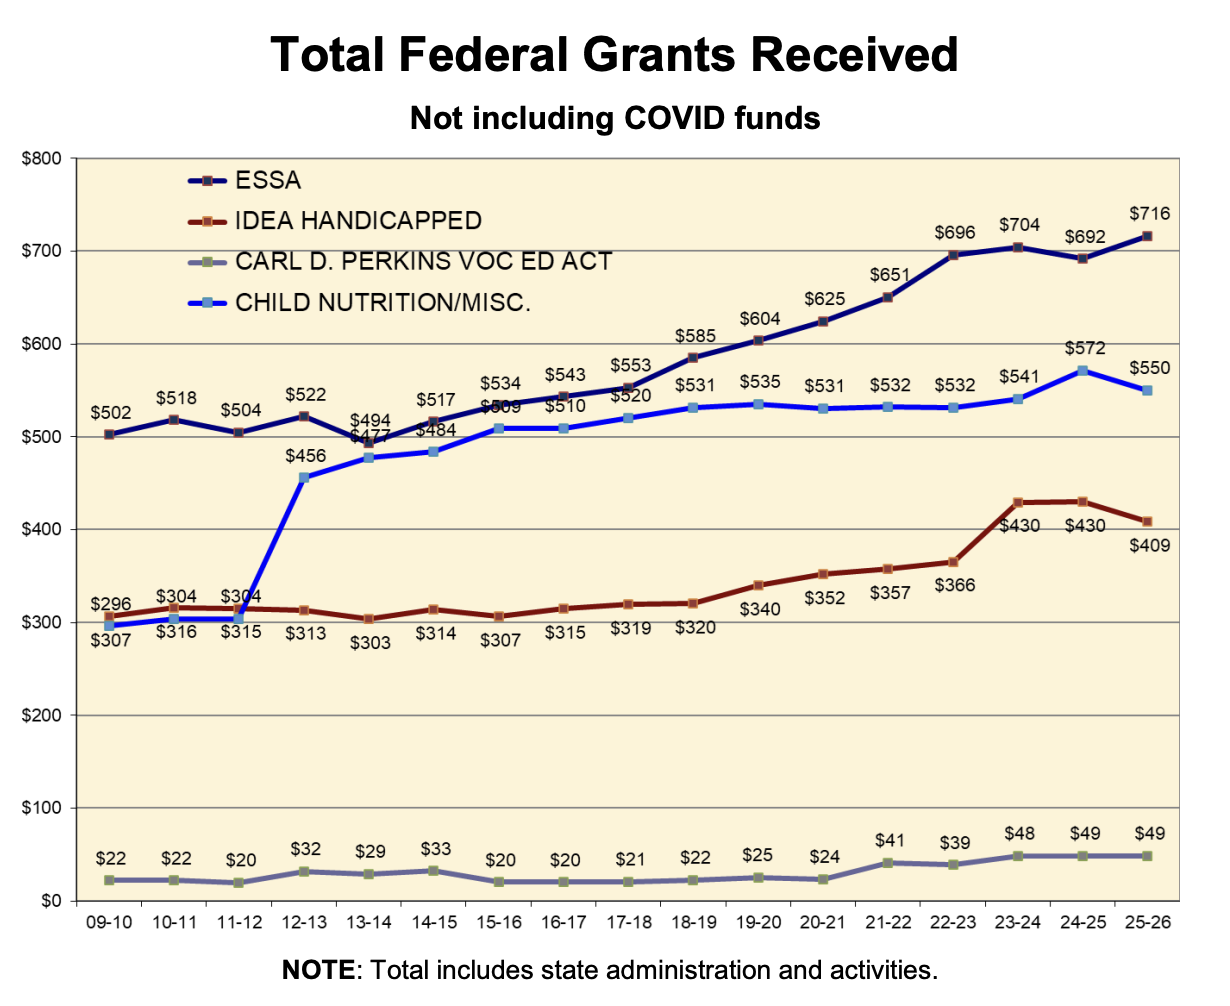
On pages 35-42, there is information about federal funding and expenditures.
According to the report, in 2025-26, the majority of federal funding for public schools went to Title I, child nutrition, and IDEA, which protects rights for students with disabilities.
“In 2024-25, 77.1% of Federal Funds were used for Salary and Benefits for staff,” the report says. “Teacher salaries accounted for 70.8% of the total salary and benefits. 22.8% of the total purchased services was spent on workshop expenses/allowable travel.”
Page 38 includes a list of federal grants received in 2025-26, as of Jan. 31, 2026. Below is a look at the buckets of federal grants received over time, in millions.
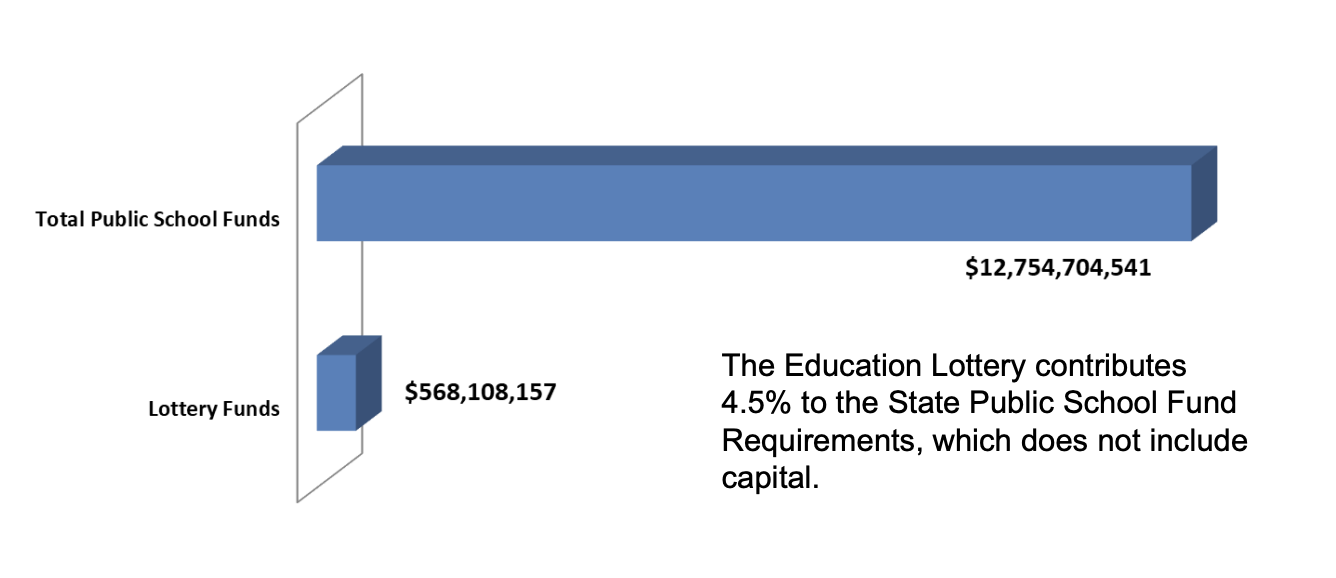
The last section of the report details information on capital and lottery funding. Lottery sales for the Education Lottery began in March of 2006, per the report.
Capital Funding from the Lottery:
— Highlights report
- The Public School Building Capital Fund is $100 million and distributed to all counties at a dollars per average daily membership (ADM).
- The Public School Repair and Renovation Fund is $50 million and is distributed to each county at an equal amount of $500 thousand.
- The Needs-Based Public School Capital Fund is $392.4 million and is distributed based on grants, prioritized per legislation.
On page 46, you can see the Needs-Based Public School Construction Grants in 2021-22, 2022-23, 2023-24, 2024-25, and 2025-26.
Finally, on page 48, there is information about the North Carolina School Connectivity Initiative, which is led by DPI and “ensures reliable internet access for every classroom statewide.”
You can read the full report on DPI’s website.
Read more

More resources
In-depth, exportable data can be found in the North Carolina Public Schools Statistical Profile.
And here is the Office of State Budget and Management’s (OSBM) certified budget for education for 2025-27.


Recommended reading