
Over the past seven months, the Reach NC Voices team engaged with communities across the state on a range of issues including summer meals for our students, the state of the teaching profession, the state budget, and even their preferences for barbecue.
Typically, data collected in these circumstances would be tucked away in reports and spreadsheets, waiting for the right group to tap its value and tell a story. The Reach team aimed to change that.
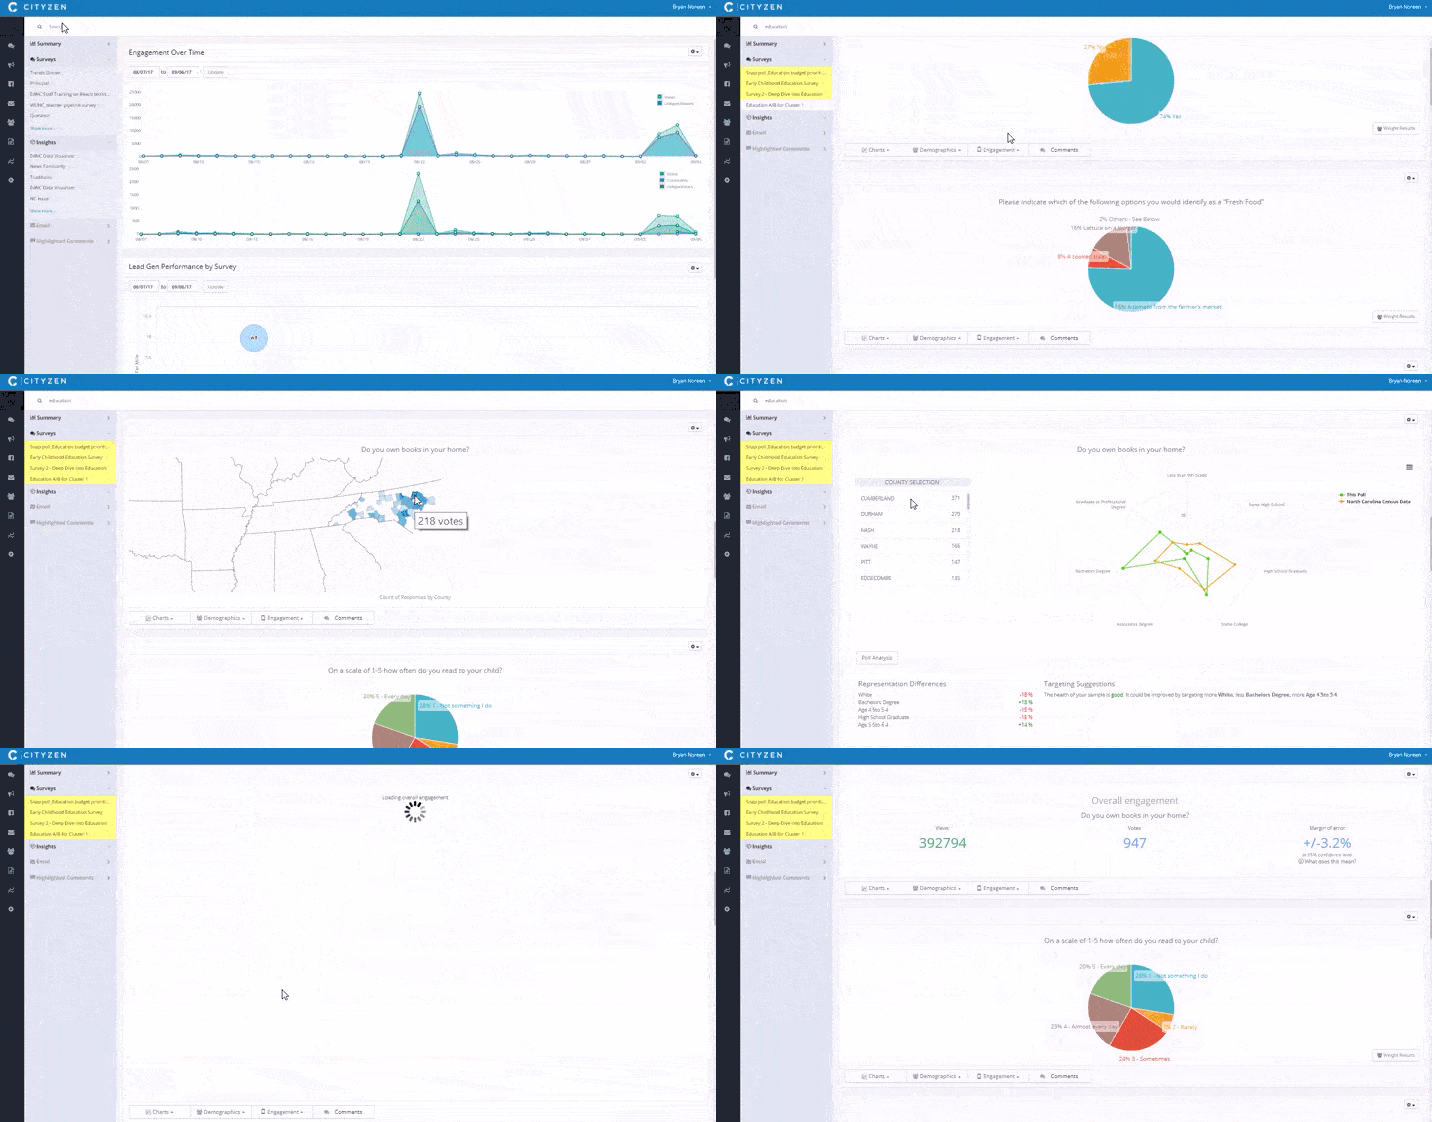
Working with our partners at Public Input, Reach NC built the first iteration of the Reach Data Dashboard, making it possible for members of our team to find and share insights from the data collected through text messaging, embedded news surveys, EdNC.org, and chatbots. It also makes it easier for our reporters and researchers to access the data and stories.
The dashboard is designed to bring together the data collected through Reach along with related public datasets. The results are highly visual insights that can be shared on social media or embedded on the web.
The Dashboard as a Data Hub:


The dashboard is designed for our team and our partners to quickly explore and understand the data we collect as part of statewide conversations and outreach. To the user, it operates like a searchable data feed.
To show a few highlights, we assembled some examples from a question we posed to citizens across North Carolina.
Case Study: Books at Home
As part of an education survey this summer, we asked questions regarding children’s reading habits, motivation for learning, and how parents influence their children’s learning.
We asked several questions including one aimed at parents:
Do you own books in your home?
We pushed this question out by embedding it in news articles on local news websites using Public Input, and by asking our strategic partners and community to distribute it.
The data dashboard allowed us to monitor the success of the questions and adjust our strategy for distribution throughout. After all, it is not much of a conversation if few people participate.
We always pose a similar set of questions to ourselves: What are the results? Is every demographic and location participating? What is our margin of error?
Let’s dig in to what we found.
Not Bad, but Work to be Done
Overall, we saw that most North Carolinians who responded stated that they had books in their home.
More likely in some places than others
We found that of the respondents, residents of New Hanover had the highest rate of homes without books of any county. In general, we see respondents in more rural counties were more likely to say that they did not have books in their home, while residents in the urban centers were fairly likely to say that they did have books in the home.
Side-by-Side Comparison
A comparison card option also gives our team the opportunity to compare data sets. The comparison card below contrasts how often parents read to their child and how important they feel it is to their child’s development.
Does having books in a home matter? Those that we spoke with certainly think so. Sixty-seven percent of respondents think parental involvement in reading and learning is the most important aspect of child development. Yet we found 28 percent of the parents who participated in our conversation did not say that they read to their children.
The geography of opinion
To understand public opinion, place and demography must be considered. One advantage of using the Public Input distribution tool is that they place questions with media outlets with broad audiences, such as WRAL. Using the mapping tool, we can see that in just a few days we were able to achieve respondents from nearly half of the state’s counties:
Understand demography, visually
Using the dashboard’s demographics visualizer, one sees that respondents mirrored overall NC demographics fairly closely. An embedded excerpt below shows the marital status of our participants contrasted with the marital status according to the census tract:
Other visualization options include age, race, education, and gender.
Deepening understanding with crosstabs
Cross-tabulation of questions helps us research and understand some of the underlying trends in our questions as well. These underlying trends and correlations help dig below the top line data as we try to understand what is really going on in communities.
From the data, it appears that not having books at home makes someone twice as likely to never read to their child.
This snapshot begins to show us the effects of not having books in the home on a child’s likelihood of being exposed to books.
Bringing data to light
The Reach’s dashboard tools brings the stories behind the data to light. It is the job of our reporters, researchers, and even you, our readers, to dig deep within the data to find the stories that matter.
Our ability to give more North Carolinians voices relies on more than simply reaching more individuals. We must bring those voices to the forefront by coalescing them into clear, understandable insights for everyone.
We believe part of our role is to serve as futurists. Tools like the data dashboard allow us to dig deep within the results of all of our conversations to see what is on the minds of our fellow citizens. We hope to better understand what is keeping them up at night, what inspires them, what motivates them, and ultimately where they think our state ought to go.
Ultimately, connecting people to policy and policy to people in our 21st century town hall will make a difference for all of our children.


