
Data cards show child well-being geographic disparities


NC Child’s 2019 data cards provide snapshots on the state of health, education, and community well-being for North Carolina and for each of its 100 counties — centered around the child’s experience. That experience is quite different depending on where the child grows up. Population-level indicators “that promote children’s healthy growth and development” are split into five categories: a healthy start, family economic security, nurturing homes and communities, high-quality education, and health and wellness.
North Carolina saw some small positive changes in the years NC Child reports annually. The percent of children living in poor or low-income families decreased from 48.2% in 2016 to 46.7% in 2017. The median family income increased from $48,256 from 2012-2016 to $50,320 in 2013-2017. The percent of children in households experiencing food insecurity dropped from 22.6% in 2015 to 20.9% in 2016.
When it comes to education indicators, the high school graduate rate (86.3% for 2018) and percent of residents with at least bachelor’s degrees (29.9% in 2017) remained basically stagnant from previous reported years. Third-grade reading proficiency, an indicator for success later in school, decreased from 57.8% in 2016-17 to 55.9% in the 2017-18 school year. The state’s literacy initiative focused around that very measure, Read to Achieve, was found to be ineffective by an external evaluation from the Friday Institute last fall. A Senate proposal, backed by the State Board of Education and the Department of Public Instruction, is proposing changes to the plan this legislative session in hopes to move the needle on third-grade reading.
According to the Center for Disease Control and Prevention, North Carolina’s infant mortality rate for 2017 — 7.1 deaths per 1,000 births — is among the 10 highest in the country. The national average is 5.8%. The same is true for the state’s 9.4% low birthweight. The national average is 8.3%. 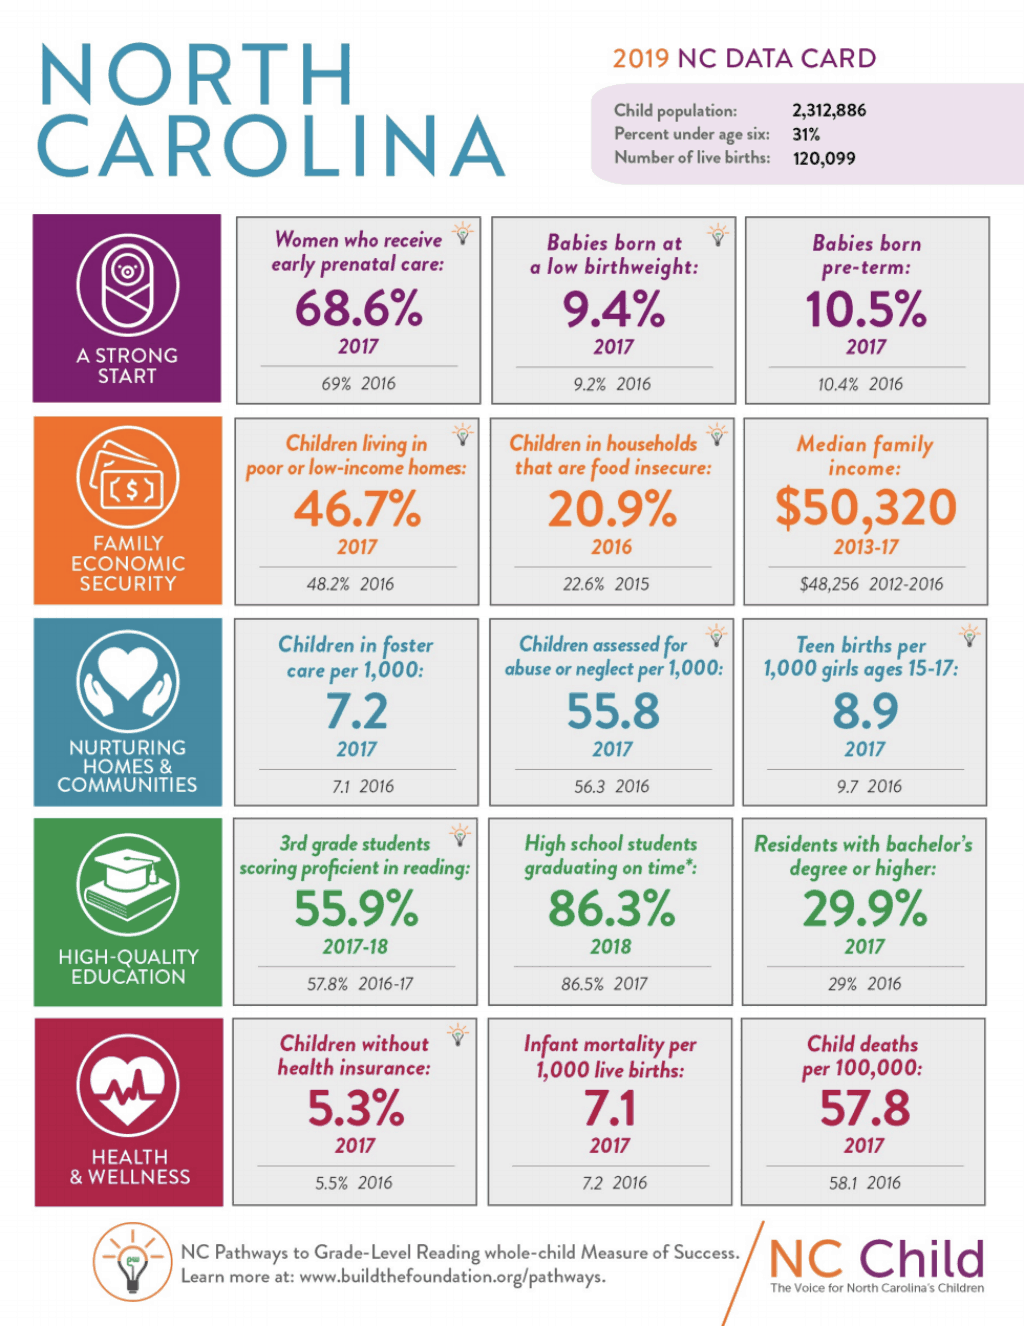
For rural eastern North Carolina counties where EducationNC has spent time delving into young children’s experiences over the last year — Edgecombe, Halifax, and Nash — data cards show contrasts in indicators compared to those about an hour drive away in Wake County. Click on any of the cards below to have a closer look.
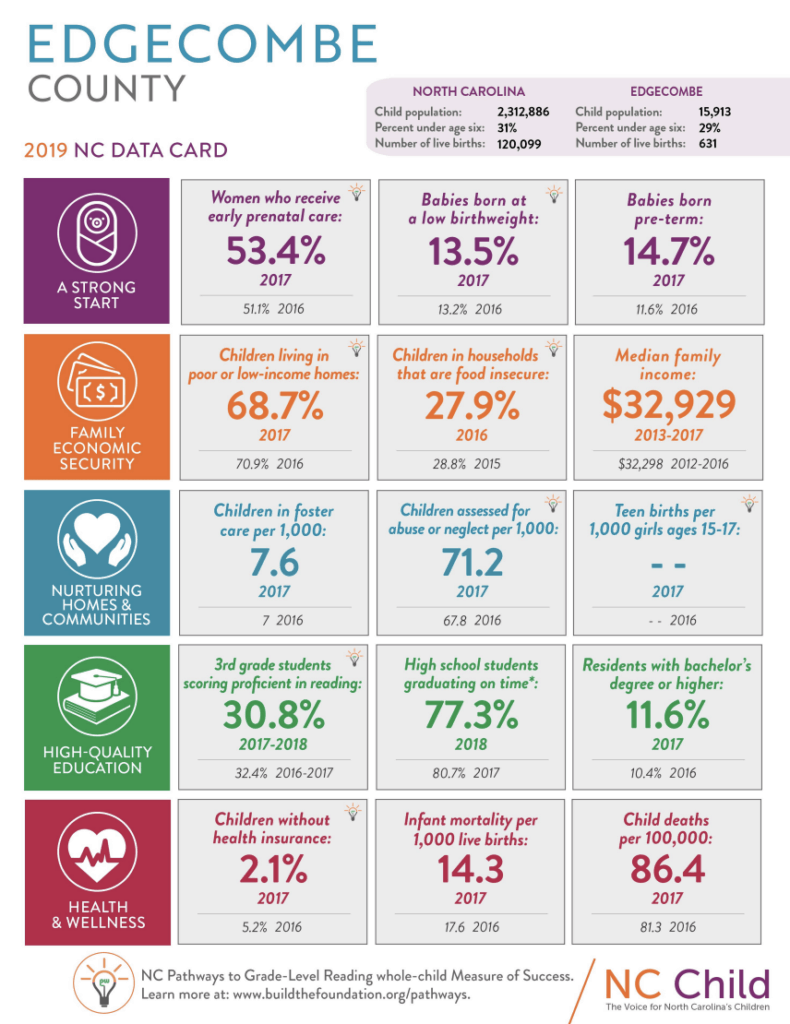
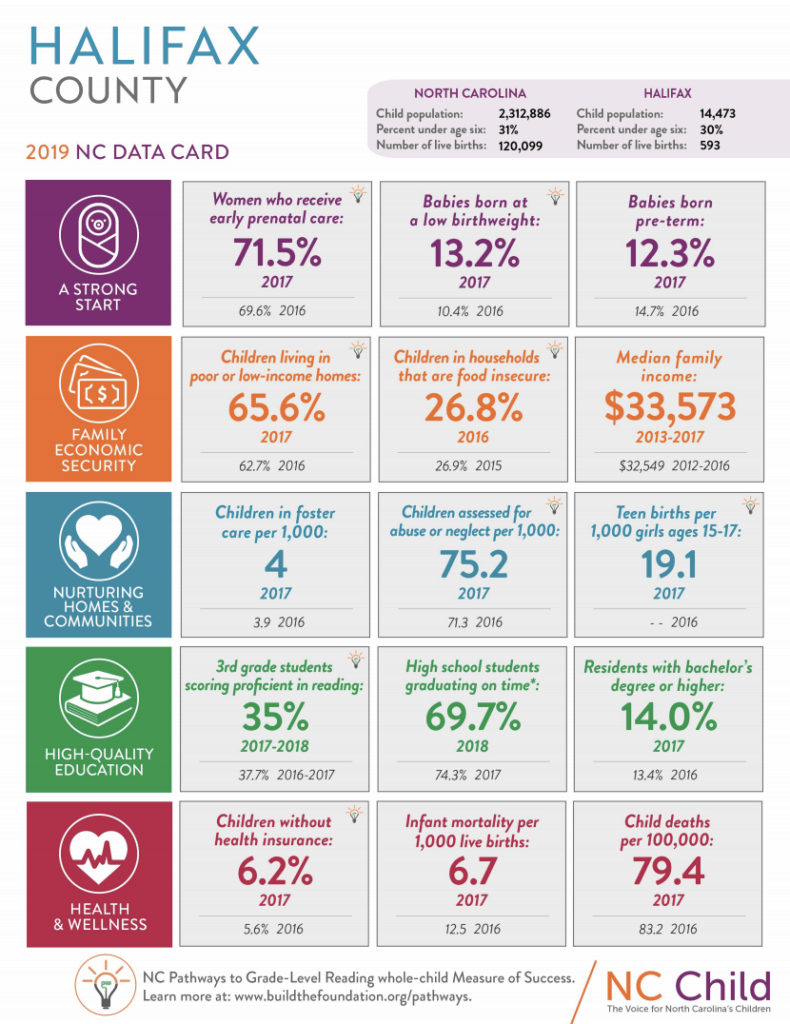
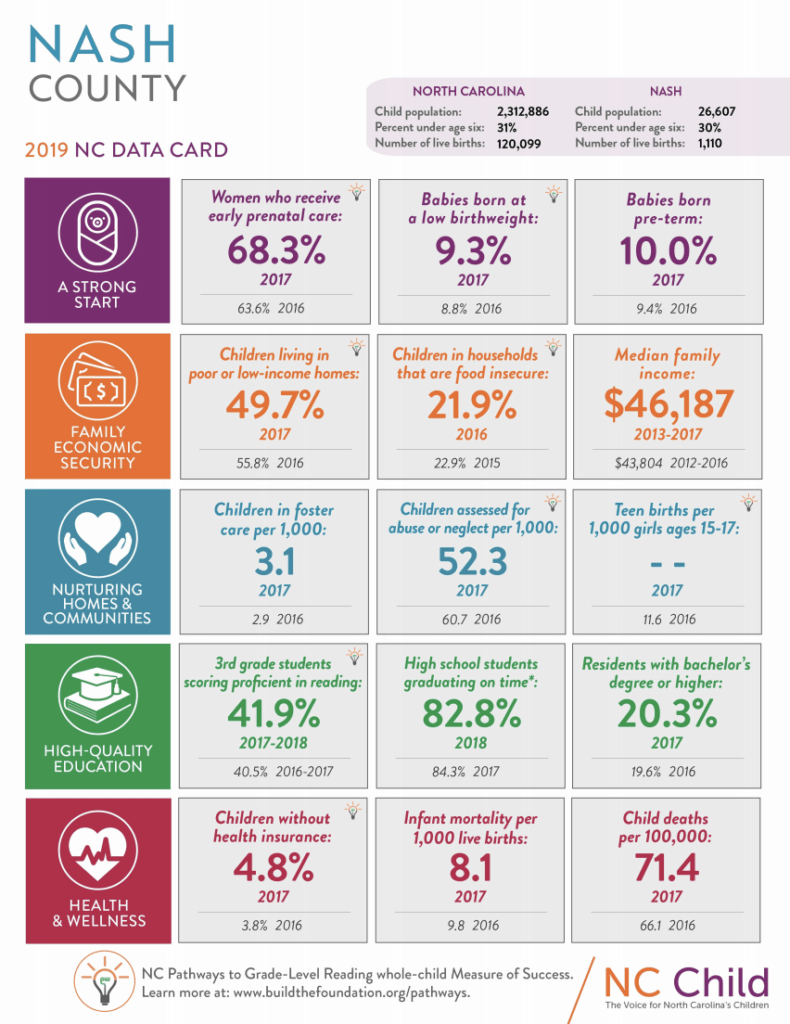
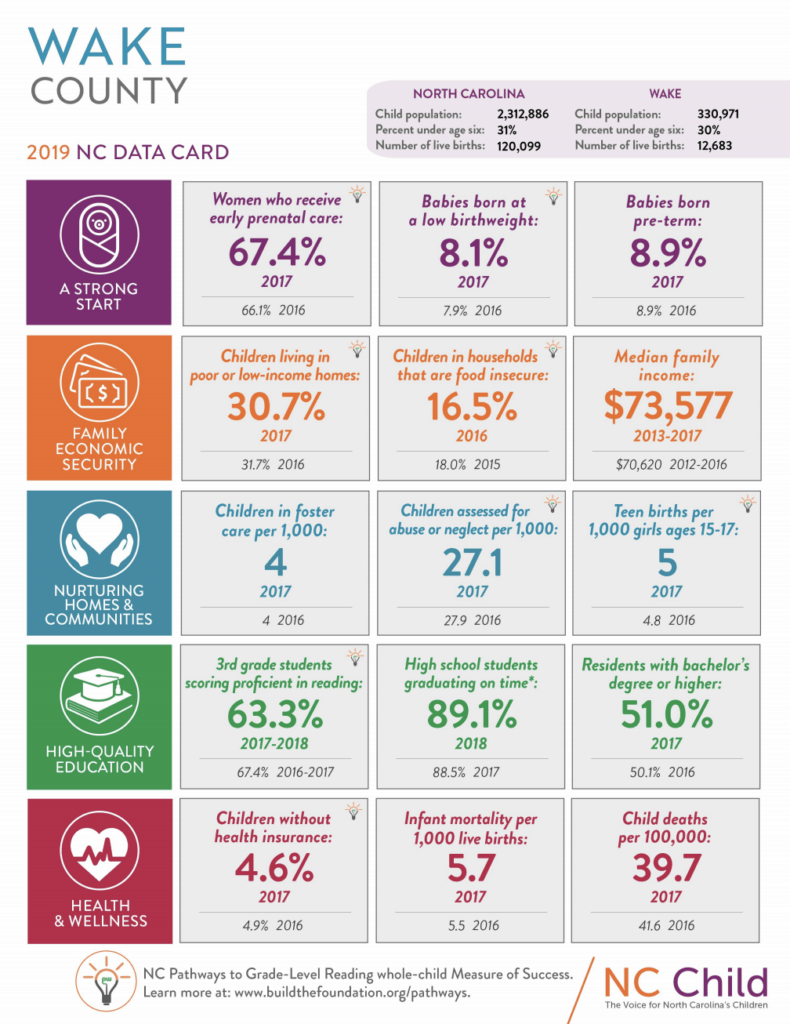
When it comes to economic security, 68.7% of young children in Edgecombe and 65.6% of young children in Halifax, live in poor or low-income families. Median household incomes are $32,929 for Edgecombe and $33,573 for Halifax. Nash County fares slightly better than its neighboring communities economically: 49.7% of young children are living in poor households and the median income is $46,187. Compare these numbers to Wake County, an hour drive to the West: 30.7% of children live in poor families, and the median income is $73,577. As mentioned above, statewide, 46.7% of children live in poor families and the median income is $50,320.
Halifax’s 2018 on-time graduation rate, 69.7%, is almost a full 20 percentage points below Wake County’s 89.1% and 16 percentage points below the state’s 86.3%. Edgecombe is at 77.3% and Nash is at 82.8%. Third graders in Edgecombe were reading proficiently in 2017-18 at less than half the rate of those in Wake County — that’s 30.8% and 63.3%, respectively, compared to the state’s 55.9%. Third grade reading proficiency in Halifax was 35% and Nash’s was 41.9%. Similar trends hold true looking at the 2017 percentage of residents with a bachelor’s degree or more: Wake was at 51%, Nash was at 20.3%, Halifax 14% and Edgecombe 11.6%. Statewide, 29.9% of North Carolina residents had at least a bachelor’s degree.
In 2017, health indicators in the counties are interesting. Wake County had over double the percentage of children without health insurance (4.6%) than Edgecombe County’s 2.1%. Halifax’s percentage of children without health insurance was even higher, at 6.2%, and Nash’s was at 4.8%. Statewide, 5.3% of children do not have health insurance. Many early childhood advocates are pushing for Medicaid expansion this legislative session with the idea that improving the health of parents improves the health of children. With the 2019 data cards, NC Child also released profiles of parents in each county that do not have health insurance because of earning too much to currently qualify for Medicaid but not enough to pay for private insurance. NC Child’s website reads: “Having parents with health insurance means that children are more likely to have health coverage, as well as better health and financial outcomes.”
Edgecombe County’s 2017 infant mortality rate, at 14.3 deaths per 1,000 live births, was not only over double the rate in Wake County (5.7), but it was also over double the rate in neighboring Halifax (6.7). Nash County’s rate was 8.1. The statewide average was 7.1.
Check out last year’s summary below.
How are North Carolina’s children doing? It depends where they live.