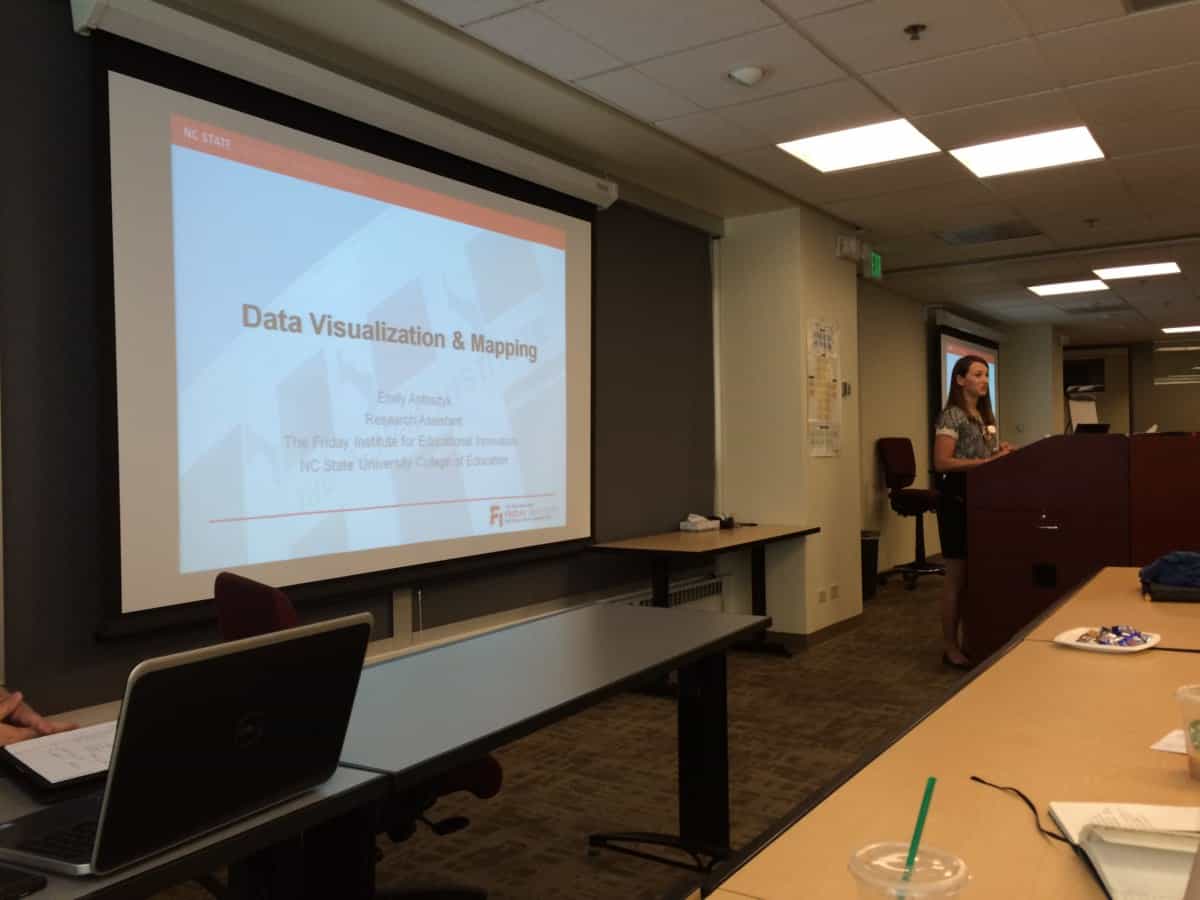
Last week when we were in Denver, CO, for the 2015 Governmental Research Association conference, there was a collective gasp when Emily Antosyk of the Friday Institute for Educational Innovation presented her latest map on school grades. School grades in North Carolina were released for the first time this year, and the grades reflect 80 percent achievement and 20 percent growth.
Antosyk’s map allows you to see how the school grades change if the state were using a 10-point grading scale instead of the 15-point scale currently in place. And that difference is what drew the reaction from the policy analysts in Denver.
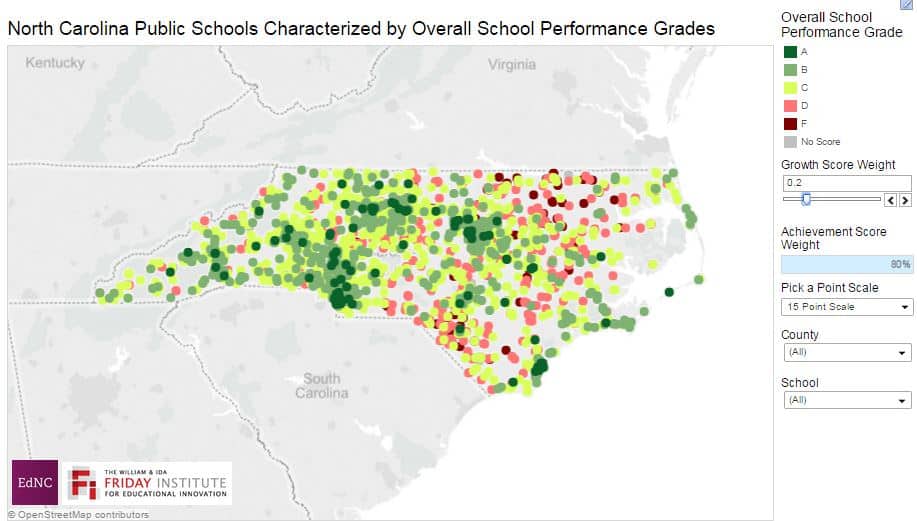
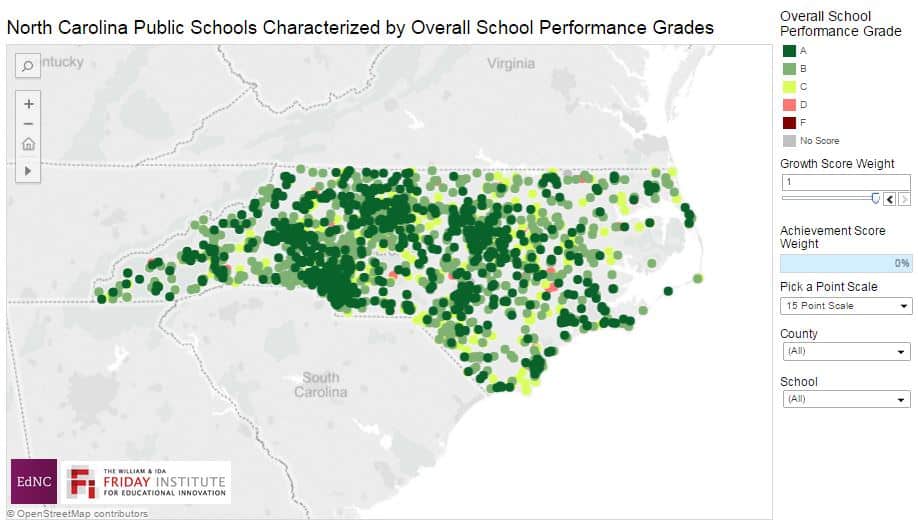
This is the map with 80 percent achievement/20 percent growth and the 15-point scale.
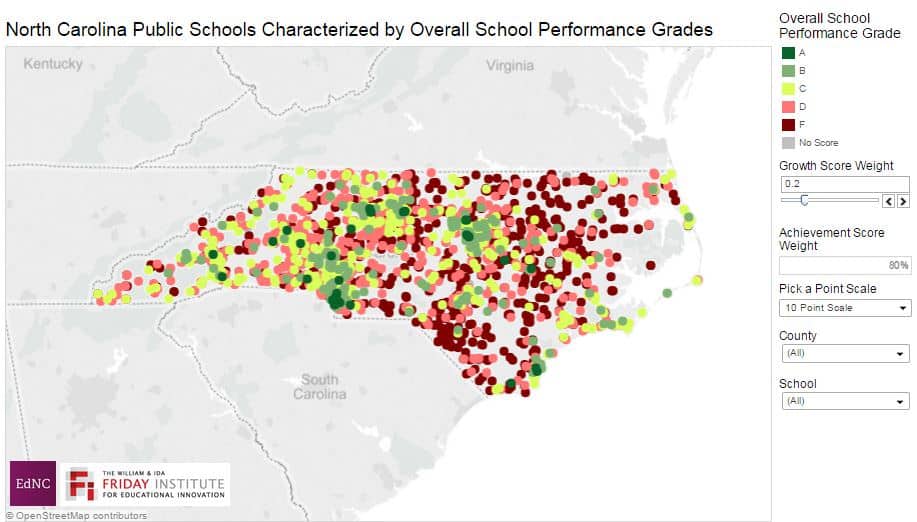
This is the same map with the 10-point scale.
Antosyk’s map also allows YOU to choose the percentages based on your values to see how the grades change — statewide and for particular schools.
You could choose to have grades based on 100 percent achievement, 100 percent growth, flip it so that it is 20 percent achievement and 80 percent growth, or try out 50/50.
This is the map with 100 percent achievement.

This is the map with 100 percent growth.
This is the map with 20 percent achievement and 80 percent growth.

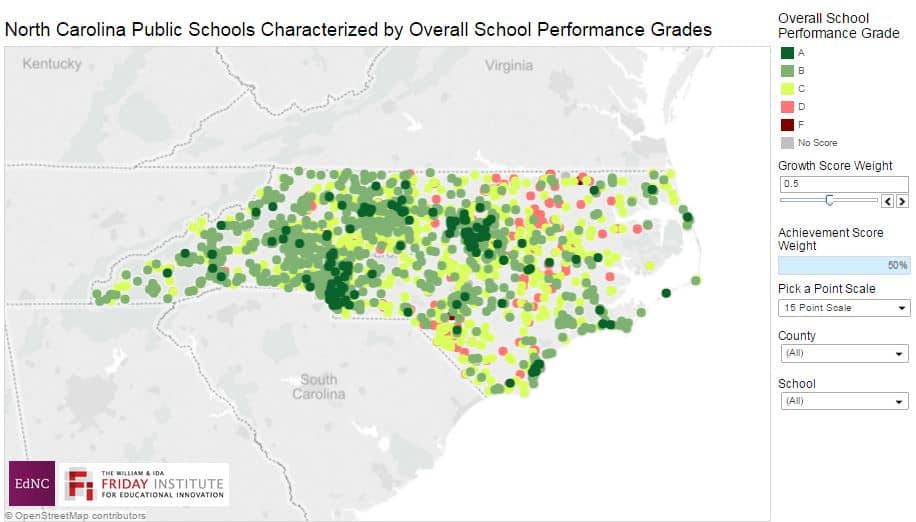
This is the map with 50 percent achievement and 50 percent growth.
EdNC had this tool created to empower you — all of you — to take a deeper look at how these public policy choices — to have school grades, to use the existing 80/20 split, and the 15-point scale — impact your perception of our schools.
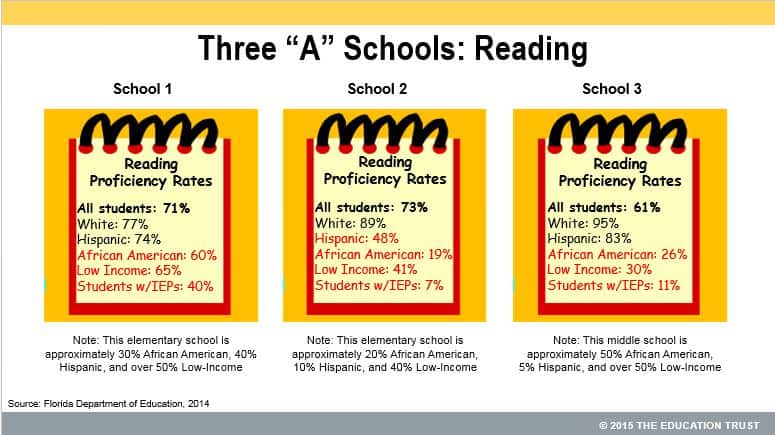
We learned something else in Denver. Natasha Ushomirsky of The Education Trust gave a presentation about recent trends in school accountability, and she talked about the letter grades for schools. She noted that school grades don’t tell us much about how schools are performing for individual groups of students. Ushomirsky said this is important for two reasons. First, she said, “we cannot close achievement gaps on the backs of low-performing schools alone.” Second, she said, it is a matter of transparency. Grades, she said, “aren’t telling all parents the same thing – an “A” school for one child may be a “C” for another.”
Ushomirsky gave this example from an A school in Florida. Look at the differences in reading proficiency rates for different groups of students.
We hope that parents, school administrators, and policymakers will use Antosyk’s map to have a conversation about whether or how our current system of measuring school achievement should be changed.

Recommended reading