A new analysis forecasts the number of students enrolled in North Carolina public schools could drop over the next five years.
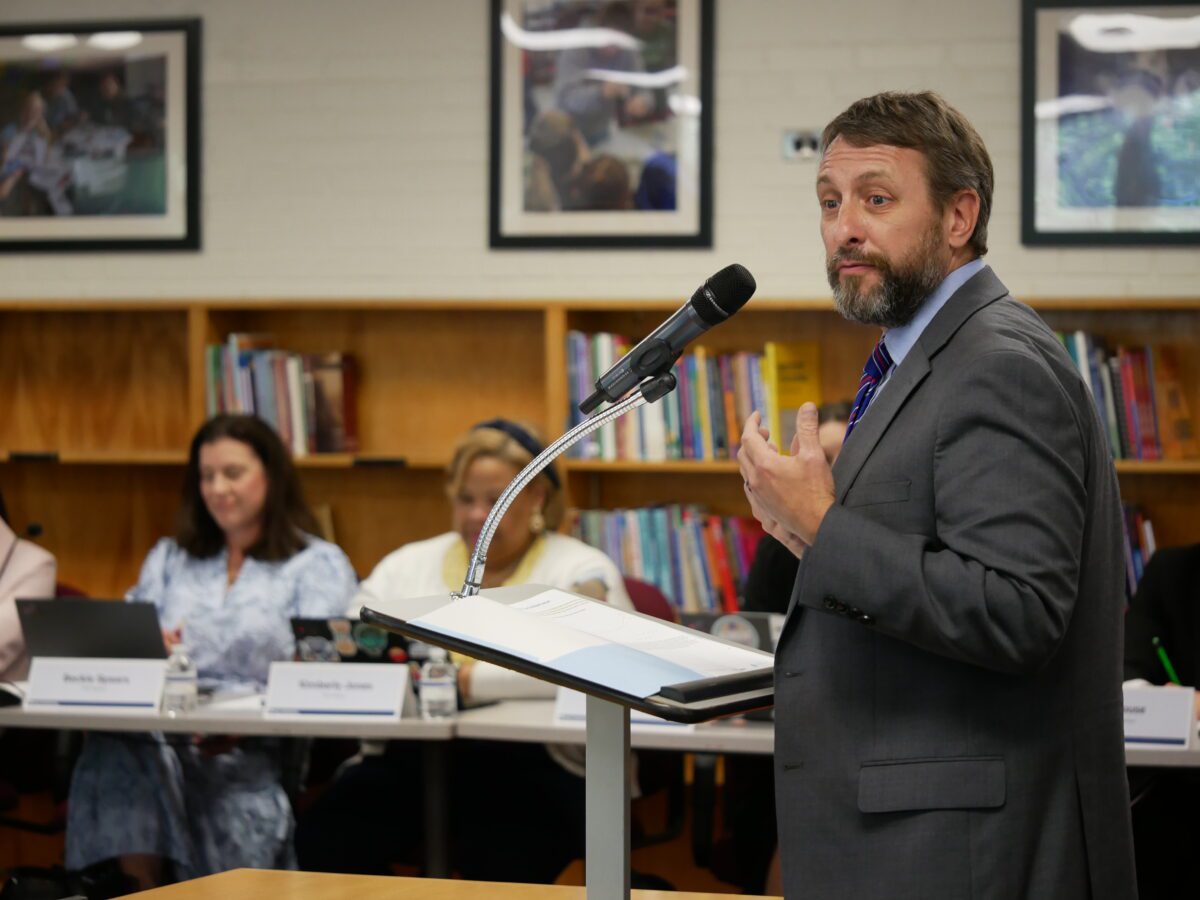
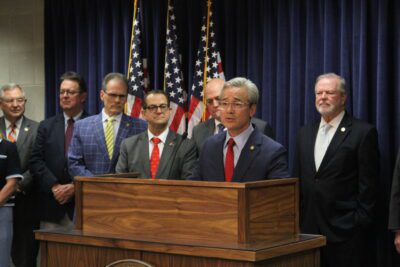
The analysis comes from Carolina Demography, a nonpartisan team out of the University of North Carolina at Chapel Hill. Nathan Dollar, the director of Carolina Demography, presented this year’s report at the State Board of Education’s meeting on April 29.
“It’s a pleasure to be here,” Dollar said, noting he is a product of public schools and has family that works in the public school system. “So it’s an honor and a pleasure to be here before you today and to do this work for the Department of Public Instruction.”
![]() Sign up for the EdDaily to start each weekday with the top education news.
Sign up for the EdDaily to start each weekday with the top education news.
Enrollment predictions are important for bodies like the Board or the state legislature, which can use them to inform policy decisions and to visualize how already enacted policies might play out. At a district level, local education agencies can also use enrollment predictions to gauge future ADM (average daily membership) numbers and adjust their budgets if needed.
Below, see a summary of Dollar’s presentation. All graphs and maps are taken from the full report. You can view the slides here, and the full report here.
Methodology
The Carolina Demography team pulled data from the following state agencies:
- Traditional public school and public charter school enrollment numbers from the Department of Public Instruction (DPI),
- Homeschool and private school enrollment from the Department of Administration,
- Opportunity Scholarship numbers from the North Carolina State Education Assistance Authority and an Office of State Budget and Management (OSBM) impact analysis, and
- Birth data from the NC State Center for Health Statistics.
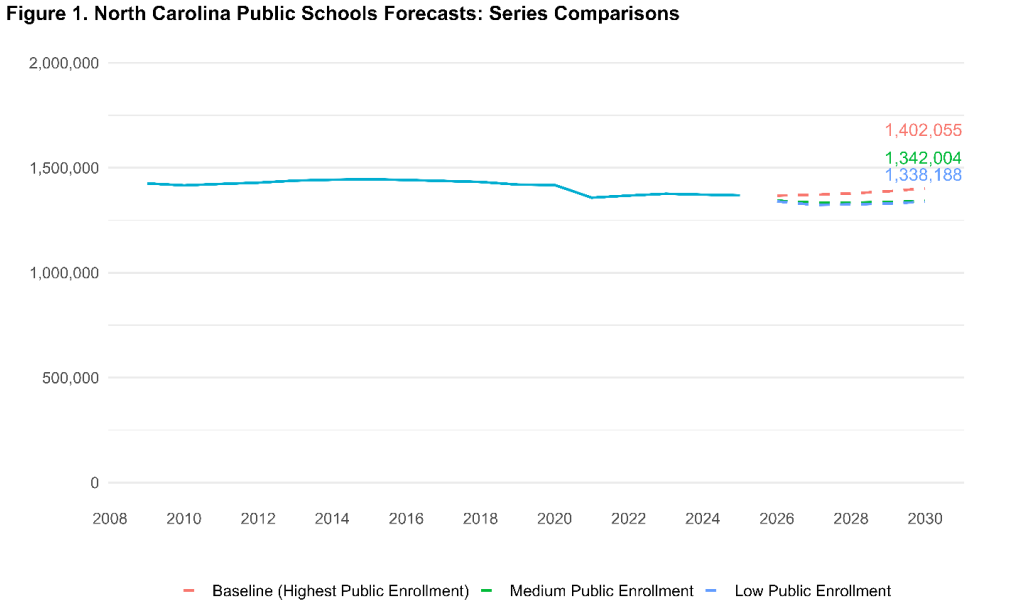
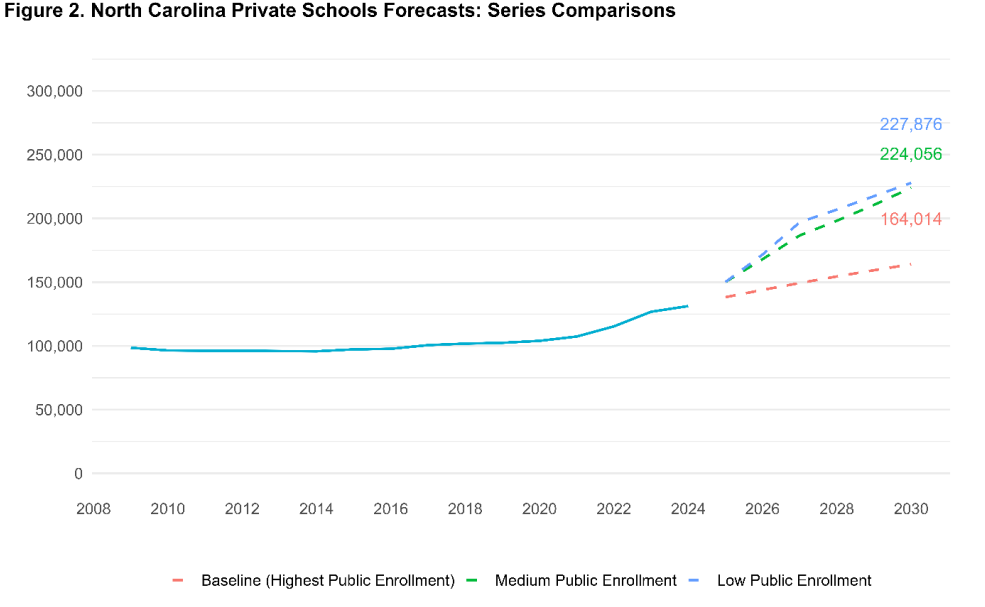
The team forecasted three different scenarios. The baseline scenario assumes historical trends in public, private, and charter school growth will continue.
The medium public enrollment scenario takes into account data on Opportunity Scholarships — also known as vouchers — including how many students are predicted to move from public schools to private schools due to the expansion of the program.
The final scenario, the low public enrollment scenario, is similar to the medium one, but assumes a slightly lower percentage of students are leaving public schools for private schools, and an increased number of Opportunity Scholarships in line with the additional applications seen in 2024-25.
Opportunity Scholarship recap
The Opportunity Scholarship Grant Program, which provides public money for students to attend private schools, has been expanded in recent years. The number of vouchers increased this school year after eligibility was expanded and money was allocated to clear the waitlist.
However, so far, applications for the coming school year are down.
Opponents to private school vouchers say, among many things, that vouchers will remove students from the public school system — and the funding tied to them — leaving public schools worse equipped to serve the students that remain.
Republican leaders have said schools should not receive funds for students they are not educating. But, as EdNC previously reported, in other states where significant policy changes are implemented that could impact ADM, stabilization funds have been proposed for districts.
The Senate budget currently moving through the legislature would keep the recently expanded Opportunity Scholarship funding on course in the coming years.
Read more

More on the results
Carolina Demography’s baseline scenario shows public school enrollment slightly increasing over the next five years, whereas both scenarios taking into account Opportunity Scholarship data show it decreasing during the same time period.
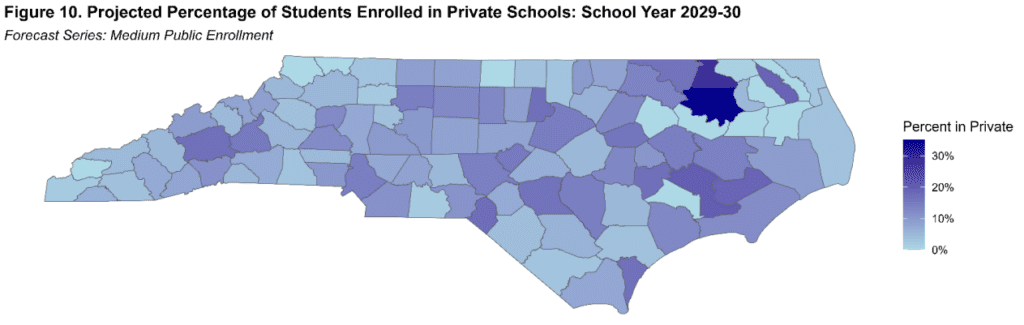
In all scenarios, private school enrollment is predicted to grow.
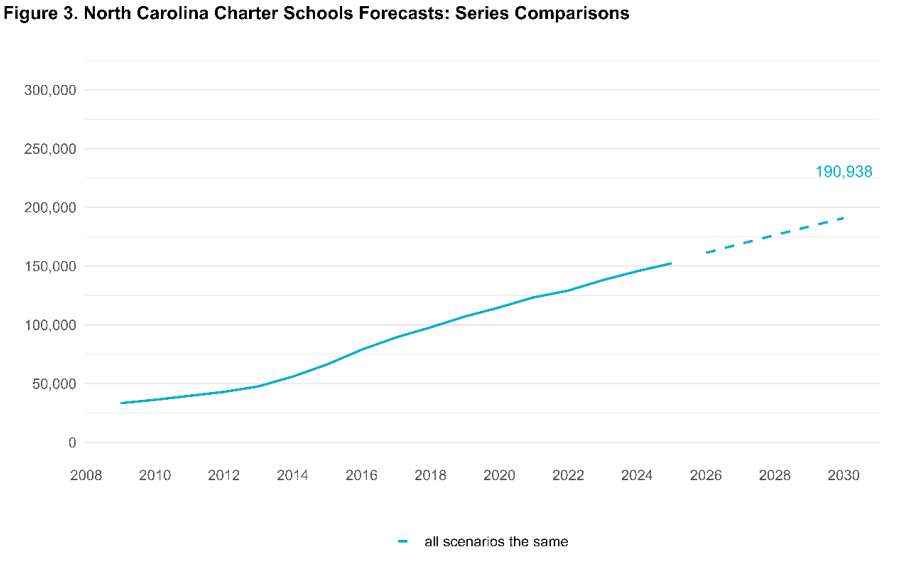
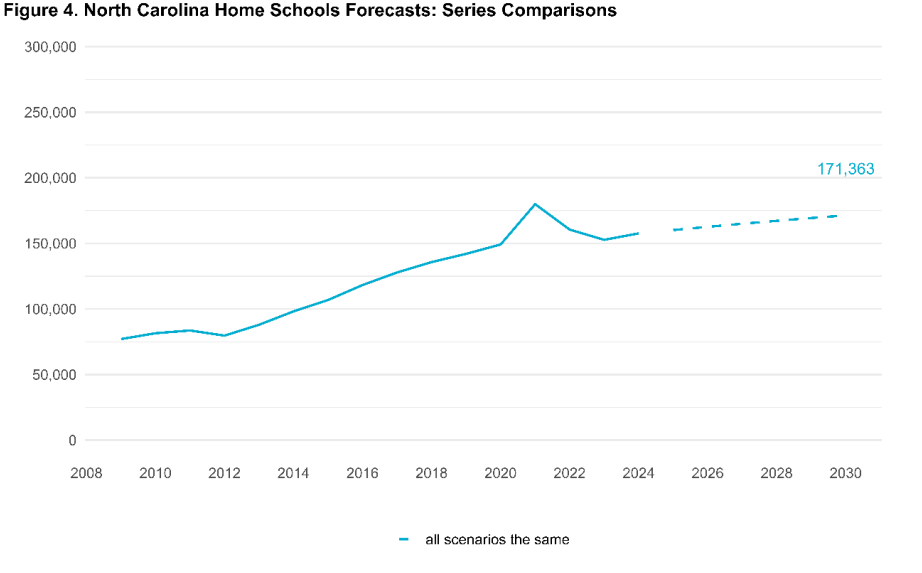
The scenarios the team posed didn’t alter predictions for charter school or homeschool enrollment, so they only have a single line on their graphs. Both charter school and homeschool enrollment are forecasted to rise.
Just because overall state public school enrollment might decrease doesn’t mean some districts won’t see growth. The district forecasted to see the most growth in the next five years is Charlotte-Mecklenburg Schools, according to the report, which would gain 9,529 students.
By percentage growth, though, Currituck County Schools’ projected growth of 5,173 students would be the largest, coming in at a 14.5% increase.
You can see charts of the top growing schools in the full report.
Market share changes
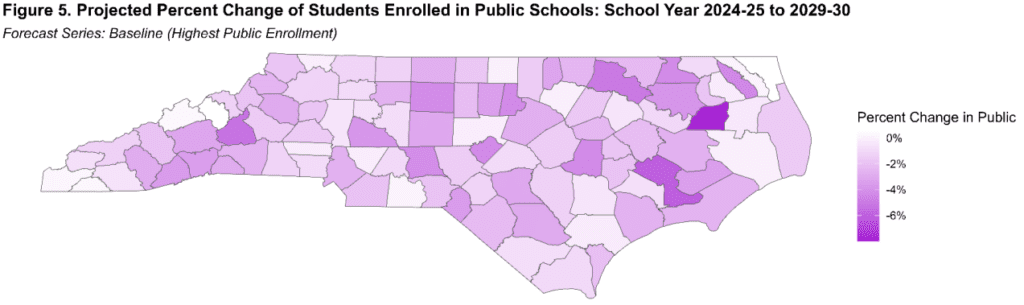
Though the baseline scenario would see a slight overall increase in public school enrollment, under this scenario most counties are still projected to see a market share decrease, with the share of students attending public schools in some counties decreasing by over six percent.
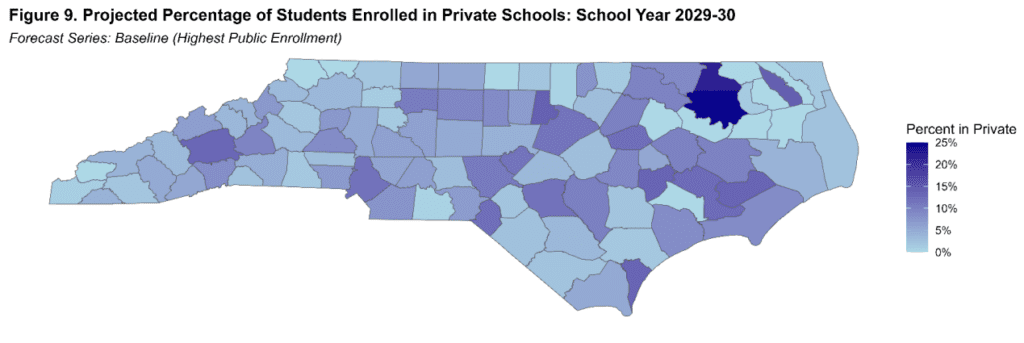
Meanwhile, private schools in the baseline scenario would see roughly the same share of student enrollment over the next five years.
During the April 29 Board meeting, members discussed how to market public schools amid growing funding for private school vouchers. Chair Eric Davis said public schools will remain the best choice for most families and students.
“We are in a competitive environment,” Davis said. “…We are gonna win.”
Note: The maps below show the projected percent change in public school enrollment over the next five years, but the projected percentage of students enrolled in private schools in school year 2029-30.
But under the scenarios taking the expansion of Opportunity Scholarships into account, nearly all North Carolina counties would see a decreased share in public school enrollment.

Notes
The Carolina Demography analysis notes some considerations about its data and methods. For example, historical anomalies like the COVID-19 pandemic and Hurricane Helene could introduce more uncertainty.
“All we can really know about the future is what we know about the past. COVID-19 affected the historical time series of enrollment trends, it complicates our understanding of how future trends will occur,” Dollar said.
The report also notes that if a student goes to a private or charter school, they could be attending school in a different district than the one they live in, which can’t be accounted for with the current data available.
Unlike the data for the other educational sectors, the data on homeschools is an estimate. According to the Division of Non-Public Education, “The numbers of students are estimates based on information submitted by actual open schools during each school year.”
A longstanding challenge when looking at market share is what denominator to use. Many researchers just add up the number of students across the sectors and use that for the denominator. Other researchers look to projections of how many students should be in each county.
Dollar says, “We did look at estimates of the population 5-17 (not 0-18) and compared against the estimated number of students enrolled in all sectors. As you will see in the report, in some counties, less than 100% of the estimated 5-17 year-olds were enrolled, and in others, over 100% were enrolled. It’s complicated because not all students who are counted in a county for charters, privates, and homes, necessarily reside in that county, and there is also the issue of the potential undercounts. We suspect that kids attending in counties where they don’t reside is the biggest explanatory factor here, but we of course, can’t say with certainty until we have better data on both were students reside and where they attend school.”
For more information, read the full report here.

Recommended reading