Share this story
- @ncpublicschools has collected data on school meal debt in districts across North Carolina. Go here to see the debt broken down by district and charter school. #nced
- When a student doesn't have money for lunch, sometimes they charge it to an empty account, accruing meal debt. Find out which districts have the highest and lowest amounts of school meal debt.
While there were many negatives associated with the COVID-19 pandemic, one of the few positives was the expansion of free school meals for all children across the country. But as of the beginning of the 2022-23 school year, the free lunches were over.
Students were able to eat breakfast and lunch at school for free for two and a half years during the pandemic, regardless of what their household income looked like. At the beginning of this school year, federally subsidized free school meals for all came to an end. Those who qualify for reduced-price meals can still eat for free for this school year, however, thanks to legislation passed by the North Carolina General Assembly last summer.
The State Board of Education and the state Department of Public Instruction (DPI), among others, are asking for recurring funding in this year’s budget to eliminate the co-pay for students who only qualify for reduced-price meals.
When a child doesn’t have the money for a meal, they may charge it to their accounts — which may have no money in it, thus accruing debt — or depending on the policies of the district or charter school, they might even be denied a meal.
DPI compiles data on school meal debt that it receives via survey, and that debt is going up quick — it’s now up to over $3 million.
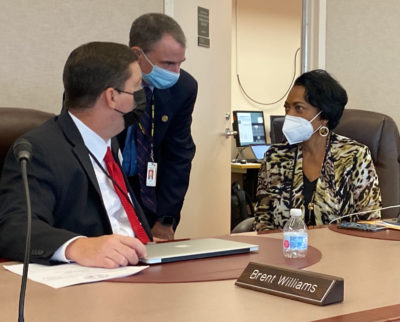
Lynn Harvey, the senior director in the Office of School Nutrition at DPI, spoke on the issue at a recent N.C. Child Hunger Leaders Conference.
“One of the most telling statistics that I bring you today to show you the impact of this economic distress is the most recent result of the survey on school meal debt, unpaid school meal debt,” she said at the conference. “You may recall that in November, we recorded that level of unpaid school meal debt at $1.3 million. Well at the end of December, that figure escalated to a little over $3.1 million.”
It is a relatively new phenomenon for DPI to be keeping this data, making it hard to ascertain the significance of the school meal debt. DPI hasn’t historically keep information on school meal debt, though beginning this year, it is submitting information on the issue quarterly to the General Assembly.
The following spreadsheet displays the results of the most recent survey, which shows debt accrued since the beginning of this school year through December. DPI will be sending out another survey in a few days to find out debt accrued through the beginning of March.
In the spreadsheet below, you can see school meal debt for each of the 79 districts that responded to the survey. By clicking a tab at the bottom, you can also see school meal debt by charter school for the charter schools that participated in the survey.
We also created a second column that shows per capita school meal debt and sorts it from highest to lowest. The per capita data was calculated by taking the total lunch debt of a district or charter school and dividing it by the most recent student enrollment data.
Here is the spreadsheet.
We’ve broken out the data into a few different charts to show local education agencies (LEAs) with highest and lowest meal debt or meal debt per capita.
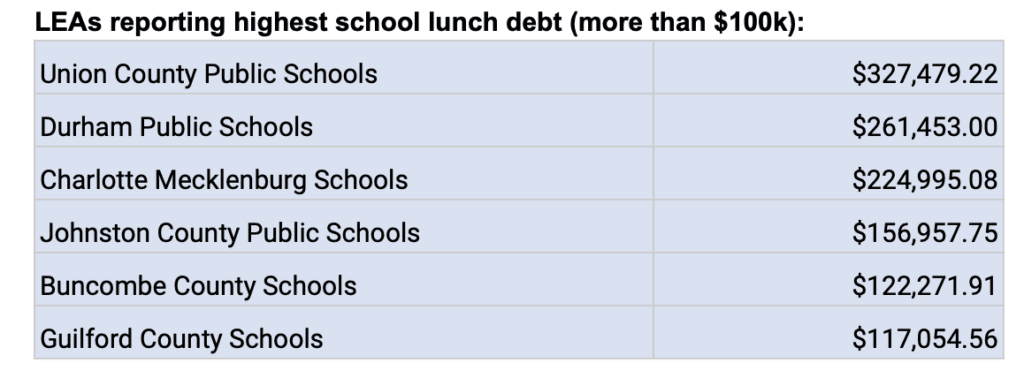
The LEAs (districts and charters) reporting the highest school lunch debt are below.
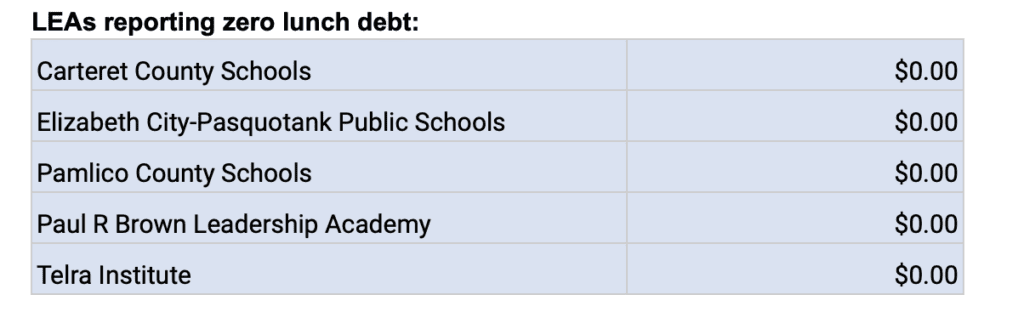
And here are the five LEAs (districts and charters) that had no lunch debt.
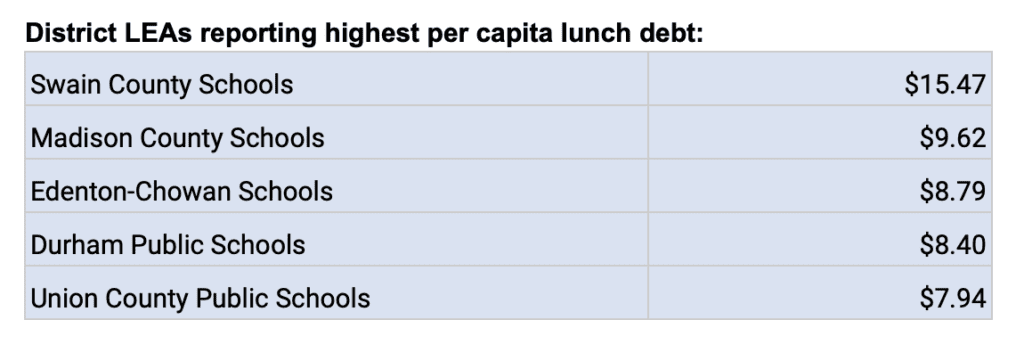
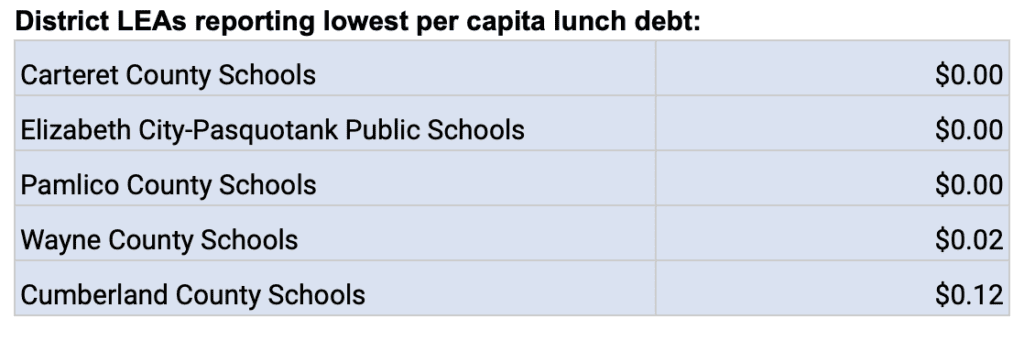
When it comes to per capita lunch debt, we split out the LEAs into the two groups for comparison — district and charter.
The districts with the highest per capita lunch debt are below.
And here are the districts with the lowest.
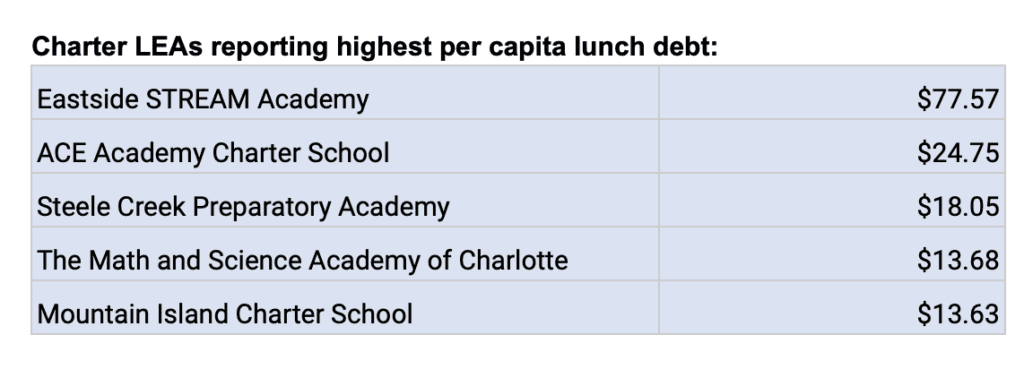
Here are the charters with the highest per capita lunch debt.
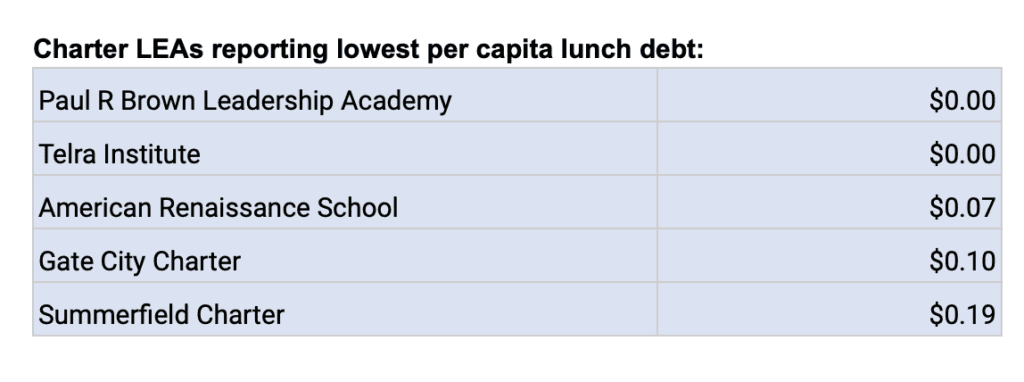
And here are the ones with the lowest.
“Let’s not forget that we continue to be that state that vacillates between the eighth, ninth, and tenth largest for child food insecurity,” Harvey said at the conference last month, adding later that she was most concerned about “households whose children do not qualify for free- or reduced-priced meals, yet their incomes are just too low to afford the cost of school meals.”
Behind the Story
EdNC’s Katie Dukes conducted the data analysis for this story.
The analysis contained in this post is based on the 79 public school districts and 42 charter schools in the DPI survey data.
We combined the data from the school meal debt survey with the most recent average daily membership enrollment data (January 2023) to calculate per capita lunch debt for each reporting LEA.
The following 12 entries were eliminated because 1) they’re double entries and it was unclear which entry was the correct one, 2) they’re not listed in ADM data, or 3) they’re federally administered schools:
- Caswell County and Caswell County Schools
- Mallard Creek and Mallard Creek STEM Academy
- Southwest Charlotte STEM and Southwest Charlotte STEM Academy
- Tarheel Challenge Academy and Tarheel Challenge Academy Salemburg
- Communities in Schools Academy
- Peak Charter
- Camp Lejeune Community Schools
- Fort Bragg Schools

Recommended reading