
Number of students in traditional public schools still trails pre-pandemic total

The impact of the COVID-19 pandemic still lingers in the number of students at traditional public schools in North Carolina.
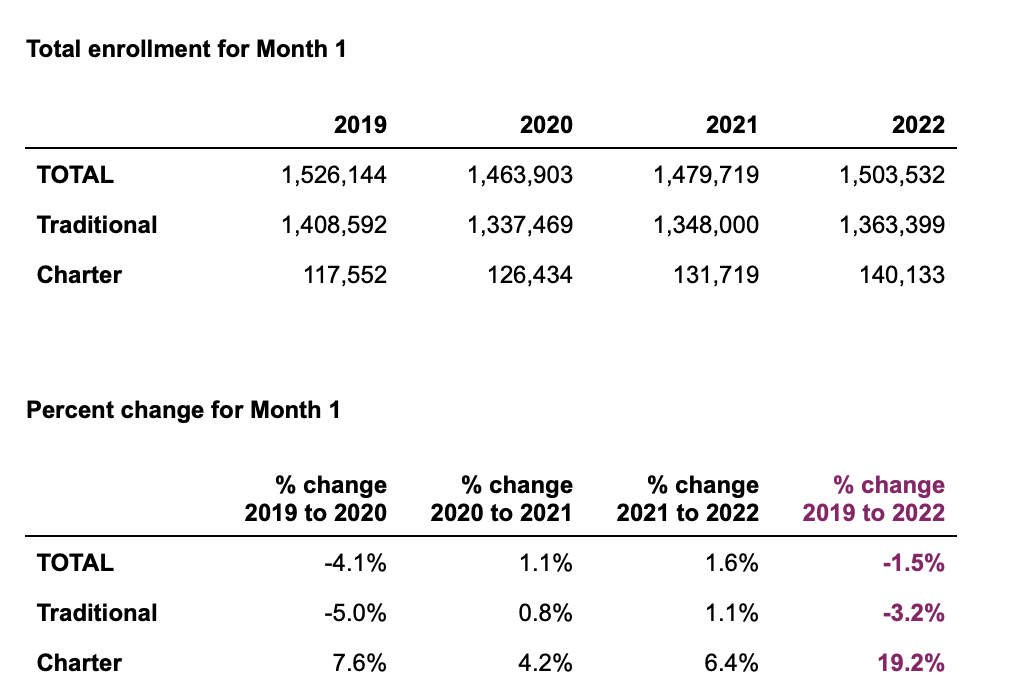
While average daily membership (ADM) at traditional schools is up from last year, it is still below where it was before COVID-19. On the other hand, charter school ADM is now almost 20% higher than before the pandemic. But the bulk of the state’s students are taught in traditional public school settings, with charters making up less than 10% of total ADM.
Last week the state Department of Public Instruction released its first look at how many students are in the state’s public schools.
In the chart below, you can see the ADM numbers for traditional and charter school students in 2019 (pre-pandemic), 2020 (in the peak of the pandemic), 2021 (last year) and now. Traditional schools gained 1.1% from last year to this year but are still down 3.2% overall from before COVID-19. Charter schools gained 6.4% over last year and are up 19.2% from before the pandemic.
DPI defines ADM and its calculation this way:
The total number of school days within a given term — usually a school month or school year — that a student’s name is on the current roll of a class, regardless of his/her being present or absent, is the “number of days in membership” for that student. ADM for each school month is based on the sum of the number of days in membership for all non-violating students in individual LEAs/Charters, divided by the number of days in the school month. The final ADM is the total days in membership for all students over the school year divided by the number of days school was in session. ADM is a more accurate count of the number of students in school than enrollment.
For more on what ADM is and how if affects school funding, watch Watauga County Schools Superintendent Scott Elliott explain it in this video.
Methodology
To analyze the Month 1 ADM data from this year, we compared it with Month 1 ADM data from the previous three school years. You can find all the original data from DPI here under “Average Daily Membership and Membership Last Day by School (ADM & MLD).” The data for this year are the numbers as of November 4, 2022, and are preliminary.
Districts sometimes see an increase in ADM in Month 2. Month 2 data for this year aren’t available, so we used only the Month 1 data in our analysis.
We looked at the 115 public school districts in the state, which includes the 100 county districts and 15 city districts.
ADM analysis
In last year’s analysis, we found that the single largest year-to-year decrease was 9.13% and the largest increase was 12.47%.
Districts are, on the whole, seeing smaller decreases this year. The single largest decrease from 2021 to 2022 was 4.67%, in the Weldon City School System. The largest increase was 7.62%, for the Cherokee County School System.
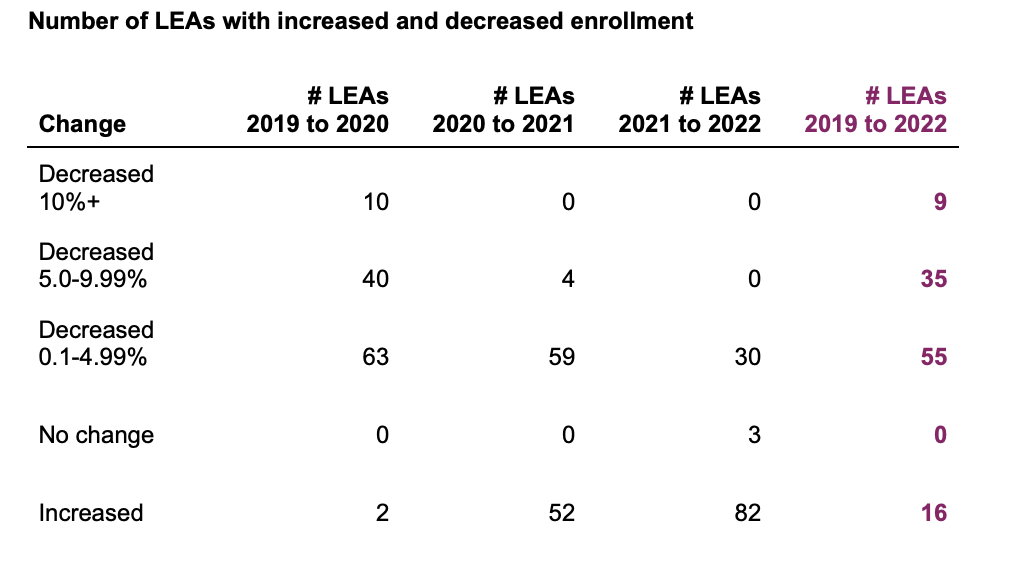
Thirty districts dropped anywhere from 0.1% to 4.99% between 2021 and 2022. No districts dropped further. Three districts had no change, and 82 saw an increase.
The numbers are starker when it comes to the changes between 2019 and 2022. The single largest decrease was 22.22%, for Tyrrell County Schools. However, Pender County Schools increased its ADM by 10.94% in that time period. It had the largest increase.
During that period, nine school districts had drops in ADM of 10% or more. Thirty-five dropped anywhere from 5% to 9.99%. Fifty-five dropped from 0.1% to 4.99%. Only 16 districts saw any increases in ADM from 2019-2022.
Reactions
Alexis Schauss, chief financial officer of DPI, said the department usually doesn’t draw conclusions from Month 1 ADM data since it is usually lower than Month 2.
“We usually wait until Month 2 ADM to assess LEAs (Local Education Agencies),” she said in an email. “Having said that, there were many LEAs that were declining in ADM prior to COVID, so that would need to be taken into consideration.”
Lauren Fox, senior director of policy and research for the Public School Forum of North Carolina, said in an email that the increasing enrollment over last year supports the assertion from local education leaders that students are returning post COVID-19. She also said the growth of charter schools is important to monitor for its impact on traditional public schools.
 Sign up for the EdDaily to start each weekday with the top education news.
“Enrollment in charter schools and the number of charter schools overall in the state have been growing since the cap was removed in 2011, and it is more important than ever to keep a focus on how this growth impacts equity and opportunity for all students,” she said. “For instance: what is the impact of charter schools on traditional public school budgets and school segregation? To what extent are charter schools serving all students equitably, and how are we ensuring that they are accountable to students and families?”
Brian Jodice, executive vice president of Parents for Educational Freedom in North Carolina, said that growth in charter, private, and home school enrollment has been going up for the past decade, but that COVID-19 did help bolster those numbers.
“I do think the pandemic caused an additional uptick because those non-traditional options had the flexibility to physically open their doors faster than the traditional public school system, and there were many parents and families in our state who wanted their children physically back in school as soon as possible for a myriad of reasons,” he said. “If you couple the impacts of the pandemic on school enrollment with the growing movement in our state around a belief that all students should have access to the school of their choice regardless of income or zip code, then it should come as no surprise that we continue to see a rise in options like charters and private school choice programs like North Carolina’s Opportunity Scholarship Program.”
Here is a spreadsheet of the data.
In the map below, you can hover over any district to see its Month 1 ADM data for this year or the previous three. You can also see the percent change in Month 1 ADM from 2021 to 2022 and from 2019 to 2022. Dots represent city school districts.