Update on 12/01/21: The North Carolina Department of Instruction has released Month 2 ADM data for the 2020-21 school year. We compared the preliminary Month 1 ADM data with the preliminary Month 2 data, and found the following:
- Month two total enrollment for all schools is 1,499,778. Traditional schools market share is 1,367,691 and charter schools is 132,087.
- The total ADM across all 116 school districts (the usual 115 plus the Innovative School District) increased by 1.5% from Month 1 to Month 2.
- Most districts’ Month 2 was better than Month 1, with all but six of the 116 districts seeing an increase.
- Fifty-four districts saw an increase less than 1%, and 37 saw an increase between 1% and 2%. Ten districts had an increase between 2% and 3%, eight between 3% and 4%, and one — Bertie County — had a greater than 4% increase (4.5%). But that increase only represents 75 students.
- Five districts saw a decrease, but the decrease was less than 1%. Those districts are: Madison County Schools (-0.8%), Graham County Schools (-0.4%), Polk County Schools (-0.4%), Clay County Schools (-0.3%), and McDowell County Schools (-0.1%). One district, Yancey County Schools, had no change.
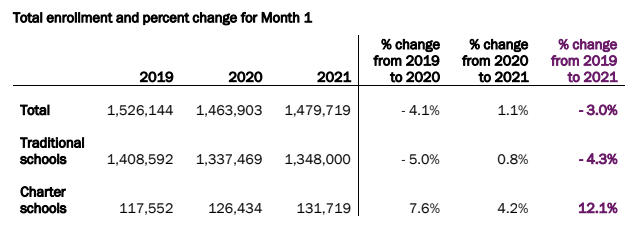
Last week, the state Department of Public Instruction, DPI, released its first look at how many students returned this year to the state’s public schools — charter and traditional. Anyone hoping that traditional public schools were going to rebound to pre-pandemic levels were disappointed to find out that while they have increased some from last year, they are still below where they were before COVID-19. Meanwhile, charter schools continue to gain students, though at a slower pace than last year.
In the chart below, you can see the numbers of traditional and charter school students in 2019 (pre-pandemic), 2020 (in the peak of the pandemic), and now. Traditional schools gained a slight 0.8% from last year to this year but are still down 4.3% overall. Charter schools gained 4.2% over last year and are up 12.1% from before the pandemic.
This data is the first month average daily membership (ADM) for this school year. ADM is used to determine funding for schools. Districts receive initial funding based on their projected ADM, but if their actual ADM comes in lower, their budgets could be cut. DPI takes the best of month 1 or month 2 ADM when determining actual ADM. Last year, the General Assembly held districts harmless for decreases in ADM, meaning a lower-than-projected student population didn’t mean a loss in funding. The General Assembly has not done so this year, though a budget compromise is still being negotiated and it could be included in there.
![]() Sign up for the EdDaily to start each weekday with the top education news.
Sign up for the EdDaily to start each weekday with the top education news.
Kris Nordstrom, senior policy analyst in the North Carolina Justice Center’s Education & Law project, wrote in NC Policy Watch this week that school districts could lose up to about $132 million due to budget adjustments if not held harmless by lawmakers.
DPI defines ADM and its calculation like this:
The total number of school days within a given term – usually a school month or school year – that a student’s name is on the current roll of a class, regardless of his/her being present or absent, is the “number of days in membership” for that student. ADM for each school month is based on the sum of the number of days in membership for all non-violating (NVIO) students in individual LEAs/Charters, divided by the number of days in the school month (ADM = Member Days (NVIO) / # of days in the school month rounded to nearest whole number). The final ADM is the total days in membership (NVIO) for all students over the school year divided by the number of days school was in session. ADM is a more accurate count of the number of students in school than enrollment.
For more on what ADM is, watch Watauga County Schools Superintendent Scott Elliott explaining it in this video.
Methodology
In order to analyze the month 1 ADM data from this year, we compared it to month 1 ADM data from the previous two school years. You can find all the original data from DPI here under “Average Daily Membership and Membership Last Day by School (ADM & MLD).”
Districts can sometimes see an increase in ADM in month 2. Month 2 data for this year isn’t available, so we only compared month 1 ADM data from this year to month 1 ADM data from the previous two years.
We looked at 116 public school districts in the state, which includes the 100 county districts, 15 city districts, and the Innovative School District.
ADM changes
Prior to the pandemic, ADM went down only 0.20% statewide from 2018-19 to 2019-20, which puts the dramatic decreases of last year and the minor rebound this year in a starker light.
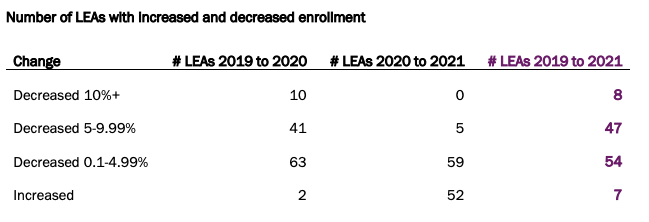
The good news is that, in contrast to last year, no districts decreased by more than 10 percentage points this year. Last year, 10 districts did.
The single largest percent increase was in Guilford County, which saw a 12.47% increase from their 2020 month 1 ADM. However, last year Guilford County’s month 1 ADM was significantly lower than their month 2 ADM (16%), and this analysis only looks at month 1 ADM. Overall, Guilford County is down 6% from 2019 to this year.
The single largest decrease this year was in Bertie County, where the district saw a 9.13% drop from the previous year. The largest drop since before the pandemic was also in Bertie (-14.50%), with Tyrell County in a close second with -14.41%.
Five districts had ADM decreases between 5% and 9.99% this year, and 59 had a decrease between 0.1% and 4.99% this year. See the chart below for more comparisons.
Here is our comparison of the data.
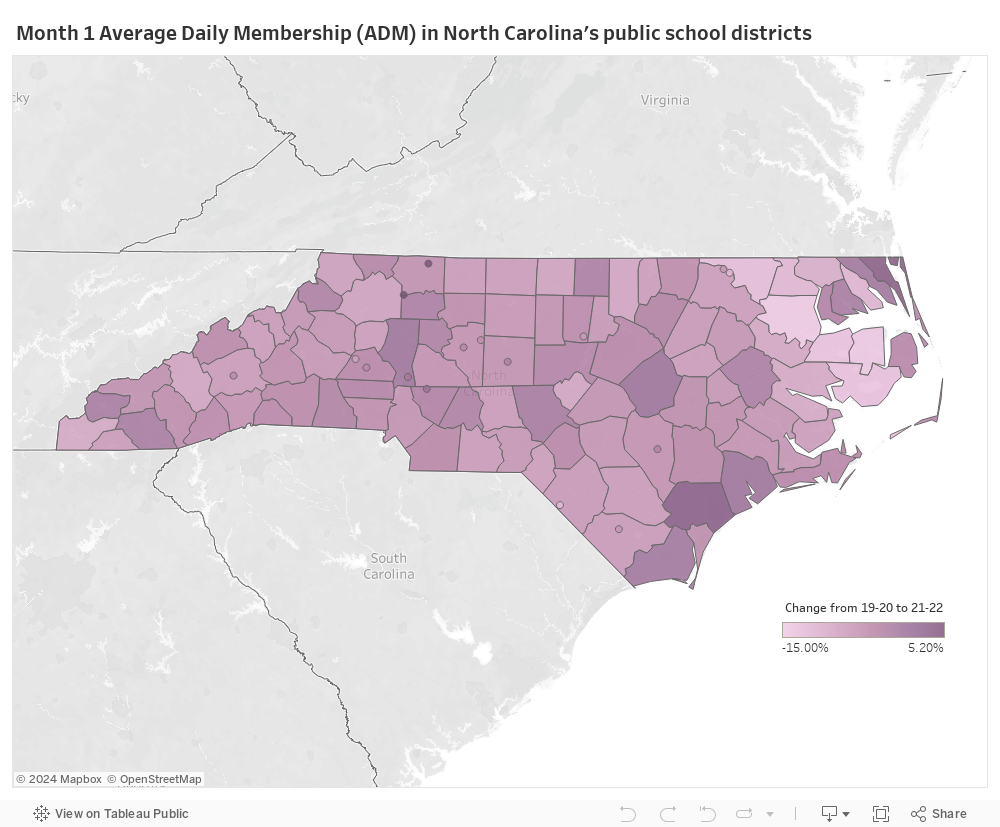
In the map below, you can hover over any district to see its month 1 ADM data for the last three years. You can also see the percent change in month 1 ADM from 2020 to 2021 and from 2019 to 2021. Dots represent city school districts.
Implications
Katherine Joyce, the executive director of the North Carolina Association of School Administrators, said that the ADM numbers for traditional public schools, coupled with the expansion of alternative options such as charter schools and opportunity scholarships (also known as private school vouchers) is a big problem for school districts.
“Since the majority of the state’s K-12 funding is based on student head counts, enrollment losses ultimately undercut a district’s ability to hire enough teachers and other staff,” she said.
She pointed out that losing, for example, 25 students in a K-5 elementary school can be complicated for finances, as those students will be scattered enough amongst the grades that while the school may get a drop in funding, it won’t also be able to drop a teaching position to compensate.
“Our students do not arrive or leave in tidy packages that make this funding process easy to navigate, and in many counties, it requires the school district to seek more support from county commissioners to cover operating costs like personnel that typically is covered by the state,” she said.
Mary Ann Wolf, the executive director of the Public School Forum of North Carolina, said the ADM data is a reminder that the state is still trying to find its way through a pandemic.
“The good news is that this year, we do see a bit of a rebound in terms of public school student enrollments. But the truth is, all schools are still struggling to meet the needs of their students and educators,” she said. “We do not have sufficient resources in place to serve the academic, social and emotional needs of our students and classrooms today, and we absolutely have to do more to ensure that every child has access to a sound basic education.”
She went on to say that it is “imperative” that lawmakers continue to hold districts harmless for reductions in ADM so that district budgets aren’t negatively impacted by the effects of the pandemic.
Wolf also said that strong investments in public education were necessary before COVID-19 and are needed now, calling out the comprehensive plan in the Leandro school finance case as being “a roadmap” for how to make such investments.
“We also have billions of state revenue surplus dollars to make those investments happen — our state is in an excellent financial position to invest in our public schools. All we are waiting for is our state’s leaders to take action,” she said.
Behind the Story
Katie Dukes did the data analysis, Alex Granados did the reporting and wrote the story, and Anna Pogarcic created the map.


Recommended reading