
Skip to content
EdNC. Essential education news. Important stories. Your voice.

Search ednc.org

What is the COVID-19 transmission rate for your school district?

Share this story

Our republishing policy

EdNC is a nonprofit, online, daily, independent newspaper. All of EdNC’s content is open source and free to republish. Please use the following guidelines when republishing our content.
  • Our content must be republished in full. If your organization uses a paywall, the content must be provided in full for free.
  • Credit our team by including both the author name and EdNC.org in the byline. Example: Alex Granados, EdNC.org.
  • If republishing the story online, please provide a link to EdNC.org or a link to the original article in either the byline or credit line.
  • The original headline of the article must be used. Allowable edits to the content of the piece include changes to meet your publication’s style guide and references to dates (i.e. this week changed to last week). Other edits must be approved by emailing Hannah Vinueza McClellan at [email protected].
  • Photos and other multimedia elements (audio, video, etc.) may not be republished without prior permission. Please email Hannah Vinueza McClellan at [email protected] if you are interested in sharing a multimedia element.
  • If you republish a story, please let us know by emailing Hannah Vinueza McClellan at [email protected].

Please email Hannah Vinueza McClellan at [email protected] if you have any questions. This work is licensed under a Creative Commons Attribution-NoDerivatives 4.0 International License.

Canonical tag

Please include the following canonical tag in the <head> of the republished story.

<link rel="canonical" href="https://www.ednc.org/09-13-21-what-is-the-covid-19-transmission-rate-for-your-school-district/">

HTML content

This includes the title, byline, content, and tracking pixel required for republishing this story.

This story is tagged:

A team of researchers at the Carolina Population Center are mapping COVID-19 case rates for all of the state’s school districts.

The map’s highest level is 2 per 1,000 people, and it shows data for the previous week-long period — it’s not a cumulative measure.

Sign up for the EdWeekly, a Friday roundup of the most important education news of the week.

This field is for validation purposes and should be left unchanged.

But, it can still provide context for educators and parents. Based off these metrics, the map shows that only five districts aren’t in the darkest shade of red: Chapel Hill-Carrboro City Schools, Fort Bragg Schools, Hyde County Schools, Warren County Schools, and Chatham County Schools.

The website says the map may be a useful measure of someone’s risk of coming in contact with an infected person.
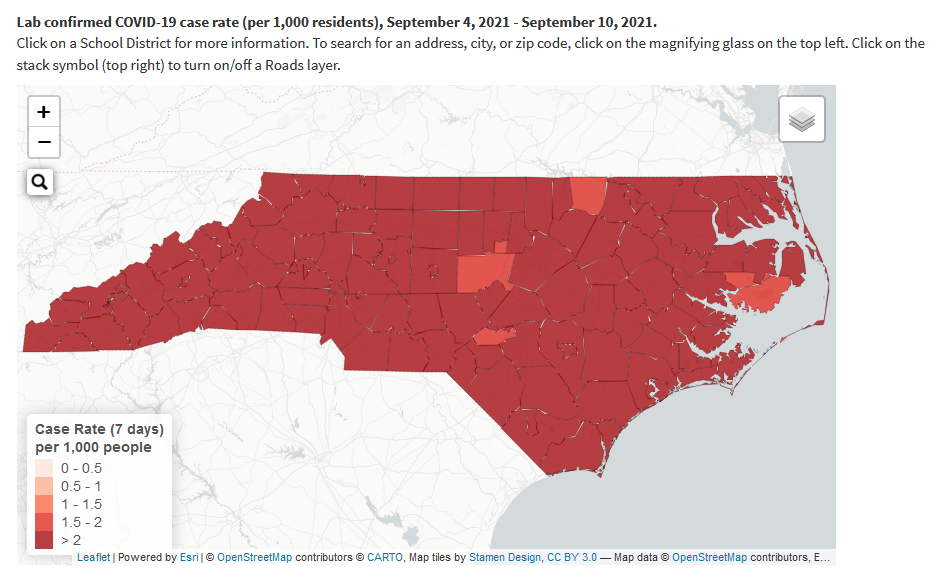
A screenshot of the case rate map as of Sept. 10.

You can hover over your district on the map here to see specific information.

The researchers are also using this information to map what each district’s transmission level is based on CDC guidelines.

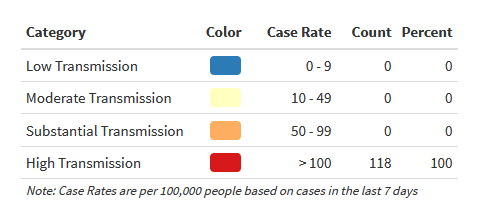
“Currently, the 7-day case rate for North Carolina is 401 cases per 100,000 people,” the website says, “meaning the state as a whole falls in the High Transmission category.”
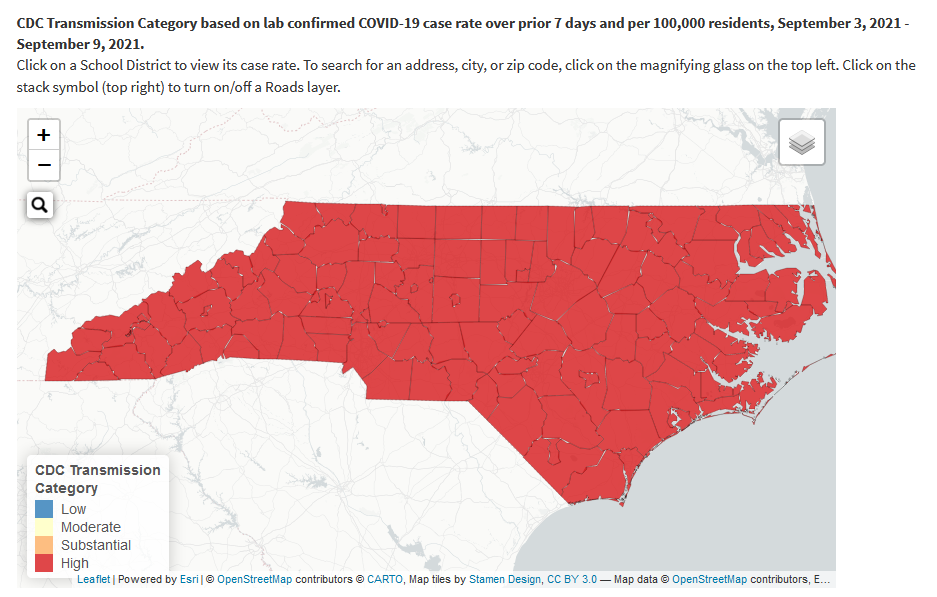
A screenshot of the transmission map as of Sept. 10.
The number and percent of North Carolina school districts in each transmission category.

At a Thursday press conference, Gov. Roy Cooper urged school districts to keep their mask mandates.

“We know that keeping kids learning in the classroom is the most important thing for our students right now,” he said. “Getting vaccinated, wearing a mask in public indoor settings, and following the science is what we need to do.”

As of Thursday, 109 school districts have mask mandates, covering more than 95% of the state’s public school students. A bill signed into law last week requires school boards to take monthly votes on mask mandates.

By Aug. 16, about a third of teenagers in the state were fully vaccinated. The researchers are tracking that data, too.