
Student grades, test scores, attendance records, social-emotional data, behavioral records, and more — a wide array of education data allows teachers to better support student learning, from making changes to instruction to determining what each student needs in order to excel.
Teachers may use education data to communicate with parents about their student’s progress, collaborate with other teachers to support student learning, and keep students on track for success. But teachers also face obstacles to effective data use, like limited time to access and use data during the school day or a lack of professional development on how to access and leverage data. There’s also the topic of standardized test scores — while some teachers find them useful, others find them of limited value due to issues like the scores not being timely, the data not being detailed enough, or the tests not accurately measuring student learning.
EdNC wanted to better understand how North Carolina teachers use education data, so we asked. Below, you’ll find the full results from the survey. Here are a few of the highlights:
- Roughly 75% of respondents agreed that data is an important part of being an effective teacher.
- Roughly 80% of respondents somewhat agreed or strongly agreed that they are adequately prepared to use data.
- More than half of respondents (54%) said that a lack of time to use data effectively is the biggest obstacle they face in using data to inform teaching practices or support student learning.
- Roughly 87% of respondents said their colleagues are very open or somewhat open to using data to inform their teaching practices.
- More than half of respondents (59%) said that End-of-Grade and End-of-Course tests are not valuable to them because state standardized test scores don’t accurately assess student learning.
Now, let’s dive into the full results. The charts below display the results from every quantitative question in the survey. Comments from participants, sourced from a final open-ended question, are scattered throughout the results when applicable.
The following data and results are from a Reach NC Voices survey. The survey was designed in partnership with the Data Quality Campaign and is based off of a similar survey they use in other states.
The survey ran from March 8 to March 26, 2019. During that time, 929 individuals responded to the survey, which was offered on EdNC.org and intended for K-12 teachers in North Carolina. Of those 929 participants, 37 were not K-12 teachers in North Carolina. That left the project with 892 K-12 teachers. Of those 892, 70 did not answer any questions beyond the first question asking if they were a teacher, leaving the survey with 822 actual participants. These results offer a brief, informal snapshot on education data and include only unverified, self-reported data.
A note on sample size: According to the latest data from the North Carolina Department of Public Instruction, there were 100,336 K-12 teachers at public schools in North Carolina in the 2018-19 school year. With an estimated teacher population of 100,336, a sample size of 383 people is valid at a 95 percent confidence level with a 5% margin of error. Even with drop off throughout the survey, each question in the survey has a sample size larger than 383.
Value and use of data
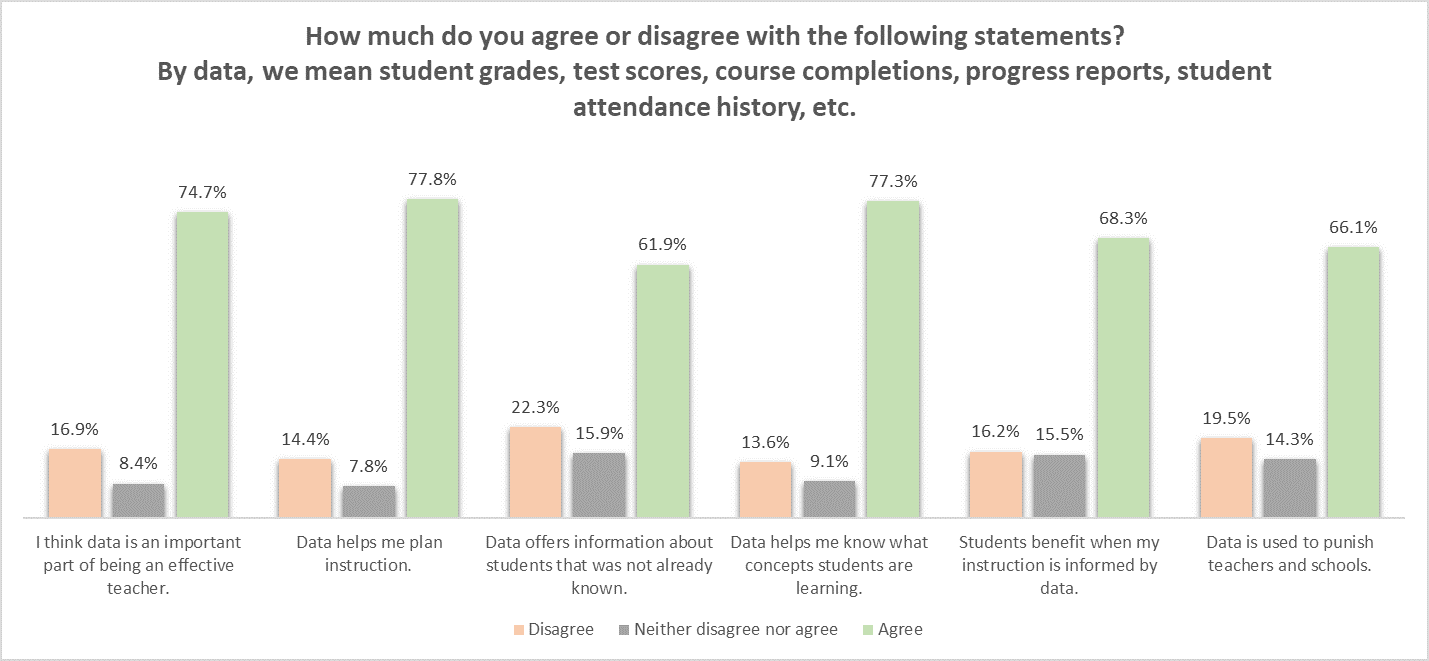
In the six statements in Figure 1, teachers were asked their opinion on the value and use of data. Roughly three in four respondents agreed that data is an important part of being an effective teacher, that data helps them plan instruction, and that data helps them know what concepts students are learning.
Respondents were slightly more divided on whether data offers information about students that was not already known, with 22% disagreeing and roughly 16% remaining undecided.
In the final statement of this set, 66% of respondents agreed that data is used to punish teachers and schools. Here’s what one teacher had to say about this.
“Data shouldn’t be used to punish educational professionals. Do we as a society punish medical professionals for having sick patients? … Data is simply data. It’s truthful, but it is not the only indicator to success in a classroom, a school, or a school district.” — Teacher in Franklin County
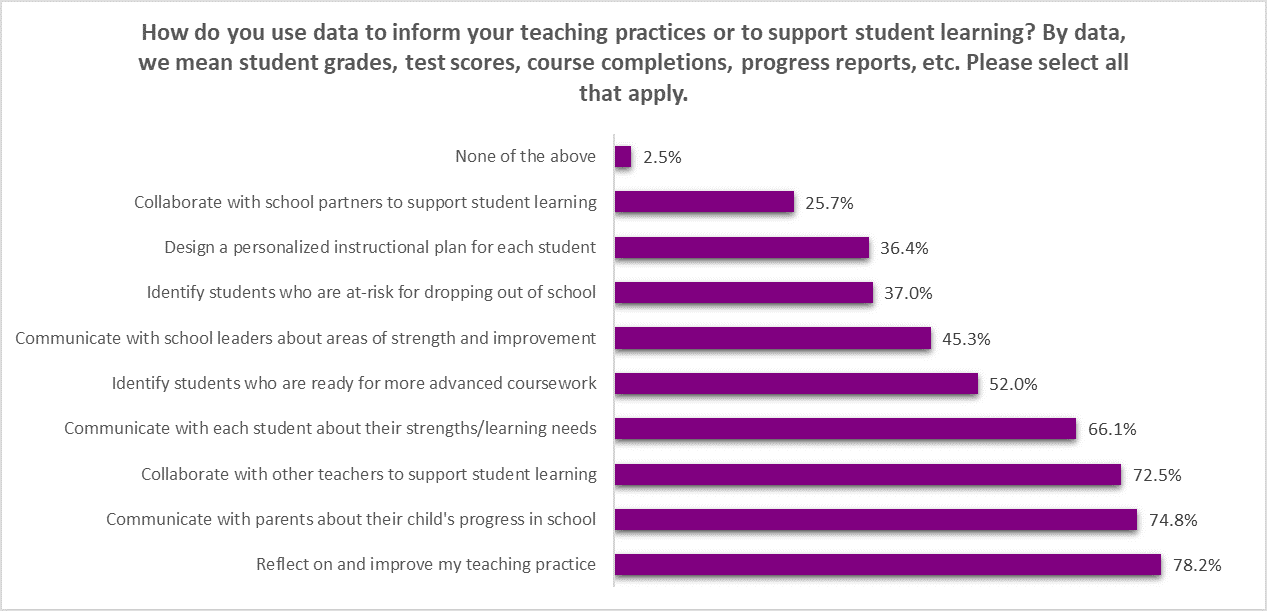
In Figure 2, teachers were asked to select all the ways they use data to inform their teaching practices and support student learning. Roughly three in four respondents said that they use data to reflect on and improve their teaching practice (78%), communicate with parents about their child’s progress in school (75%), and collaborate with other teachers to support student learning (73%).
Teachers were less likely to say they use data to collaborate with school partners (26%), design personalized instruction plans (36%), and identify students who are at-risk for dropping out of school (37%).
“I believe that classroom data is a valuable tool for classroom teachers to use when making lessons for small groups. This is where that data is extremely useful because I can pull students that share the same struggle on a specific standard. I can also use data to see if it’s the time of day that may reflect better results. … I use data as a tool to continue to move my students forward.” — Teacher in Cumberland County
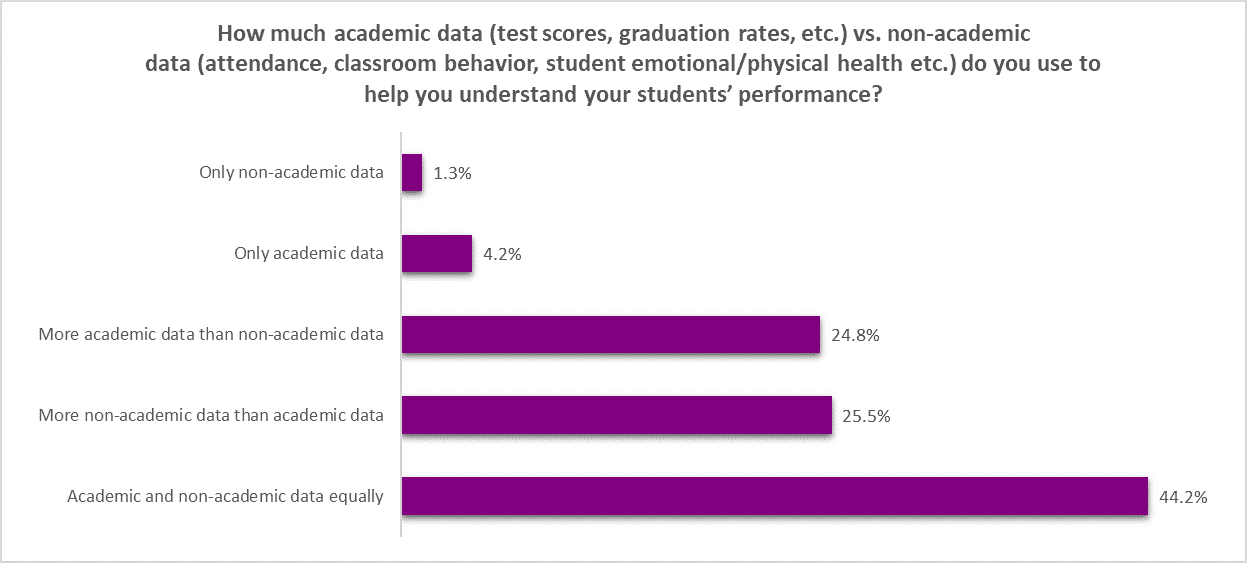
The question in Figure 3 asked teachers to identify what types of data they use to understand students’ performance. Academic data includes things like test scores and graduation rates, while non-academic data includes things like classroom behavior and attendance. Only 5.5% of respondents said they only use one type of data or the other — indicating that the large majority of respondents use some combination of both academic and non-academic data.
The most common answer was using academic and non-academic data equally (44%). Roughly the same amount of teachers said they use more non-academic data (25.5%) as those that said they use more academic data (24.8%).
“I feel that evaluating data is important as long as the focus is not primarily on summative assessments such as End-of-Course or End-of-Grade standardized tests. Data that comes from formative assessments throughout the course as well as attendance, behavioral, and teacher observations provide a better understanding of an individual student and their unique needs.” — Teacher in Wake County
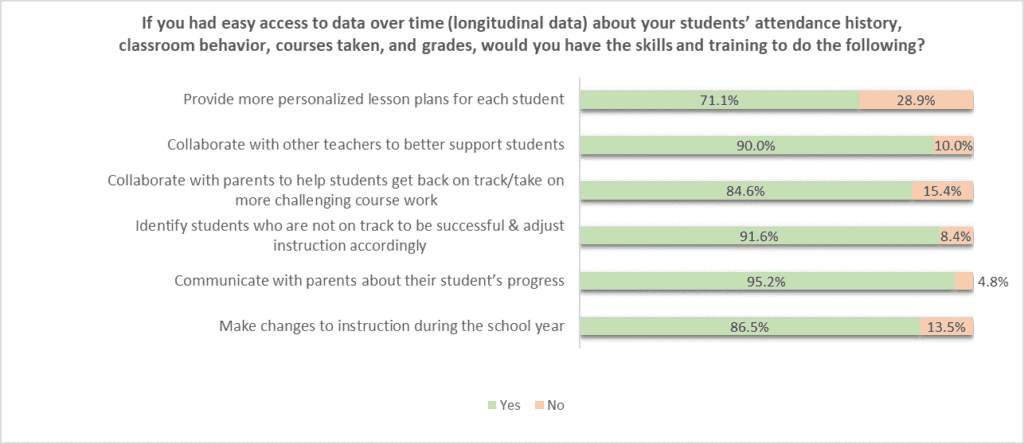
The question in Figure 4 is hypothetical: If teachers had easy access to data over time — also called longitudinal data — about students’ attendance history, classroom behavior, courses taken, and grades, would they have the skills and training necessary to use that data in a variety of ways?
This hits on a theme that many teachers brought up in their comments: Student data is often siloed across multiple platforms and grade levels, making it difficult for teachers to get a full understanding of their students’ historical data. The state is working on a comprehensive longitudinal data system that could eventually change that, giving teachers access to seamless data about their students over time.
In general, respondents were confident in their abilities to use longitudinal data if given access to it, with more than 70% of respondents answering “yes” to all statements in this section. Respondents were least confident in their ability to provide more personalized lesson plans using longitudinal data, and most confident in their ability to communicate with parents about their students progress using longitudinal data.
“The problem with data is that there are many pieces of data collected that are not available to me as a classroom teacher. I only know it exists if I ask for it. Each year, I ask for my new students’ data from previous years so I have a place to start and can pre-plan. It is not given as a matter of course. Throughout the year, the data I use is self-created. There are no mechanisms in place (due to lack of funding I suppose) to gather quick, up-to-date information on students.” — Teacher in Wake County
“We need help gathering all the data together on a student in the long-term. It’s all stored in separate silos. We need help looking at students’ progress over time.” — Teacher in Watauga County
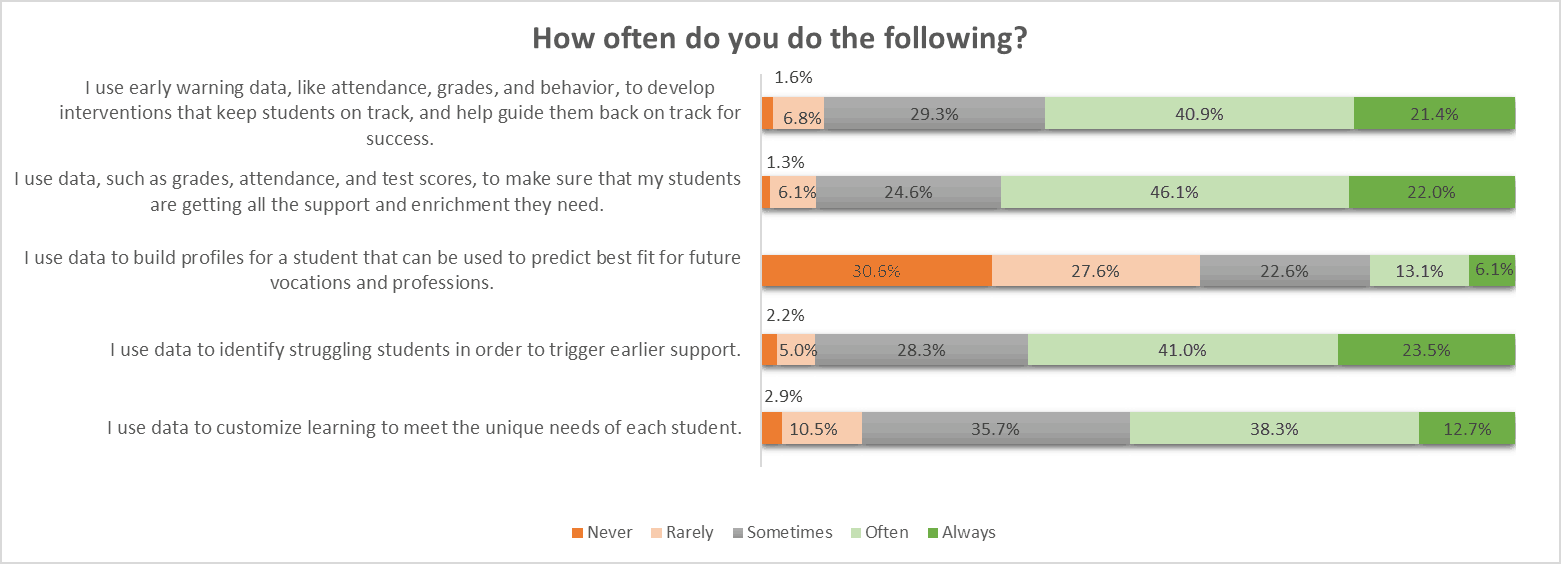
Student data can be used in a variety of ways to respond to students’ needs on an individual basis. The questions in Figure 5 asked teachers how often they do a variety of things related to meeting students’ individual needs. More than half of respondents said they often or always use data to customize learning to meet the unique needs of each student, use data to identify struggling students in order to trigger earlier support, use data to make sure students are getting the support and enrichment they need, and use early warning data to develop interventions that keep students on track for success.
However, only 19% of respondents said they often or always use data to build profiles for students that can be used to predict best fit for future professions, with more than half of respondents saying they never or rarely do this.
“I teach first grade and mClass is a valuable state wide assessment to help me see trends in students’ reading abilities. Combining data from mClass as well as teacher created formative assessment data I am able to intervene and enrich students based on their needs.” — Teacher in Alamance County
Professional development and support
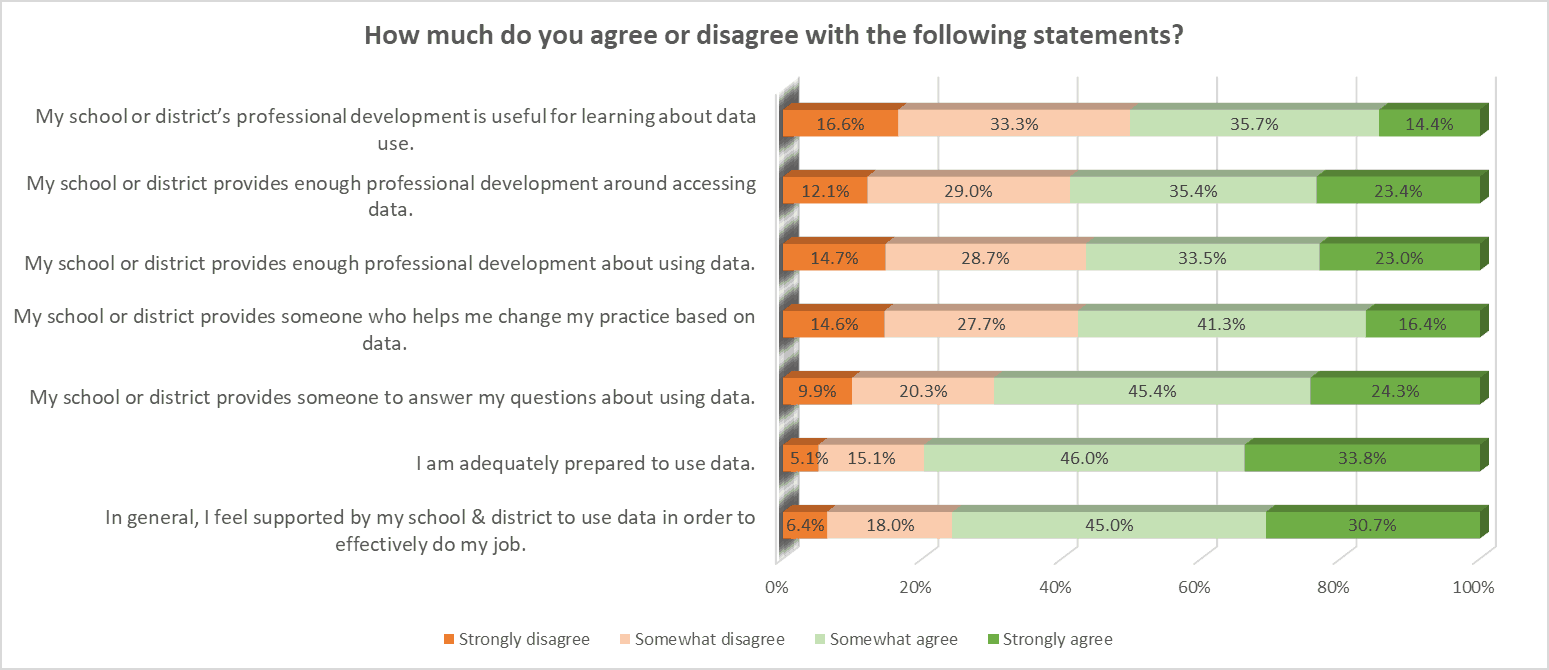
The statements in Figure 6 asked teachers to weigh in on how supported and prepared they feel to access and use data. Roughly three out of four respondents agreed that they are adequately prepared to use data (79.8%) and that they feel supported by their school and district to use data (75.7%). Roughly 70% of respondents agreed that their school or district provides someone to answer their questions about using data.
Respondents were more divided on professional development opportunities. Roughly half of respondents agreed that their school or district provides enough professional development about using data (56%) and accessing data (58.8%). Similarly, roughly half of respondents agreed that professional development is useful for learning about data (50.1%).
“I enjoy using data to assess student learning and reflect upon my teaching practices. I wish my district offered more professional development about data that would help me to become even more efficient in using data.” — Teacher in Stanly County
“I believe data is awesome. I have found that there are not enough PDs on data. … We need PDs where we can be open and honest about our personal data, where we can understand how to use and apply it to our teaching, and finally where we can learn to use data daily to help our students succeed.” — Teacher in Cumberland County
“I do not need PD to know how to read or analyze data. I am good at that. But I think we spend so much on the collection and analyzing that the actual classroom practice of addressing the results falls to the side. There is little time spent talking among ourselves about methods and content and how certain practices bring about results for student learning. We need more professional development on content to improve student results.” — Teacher in Wake County
Obstacles in using data
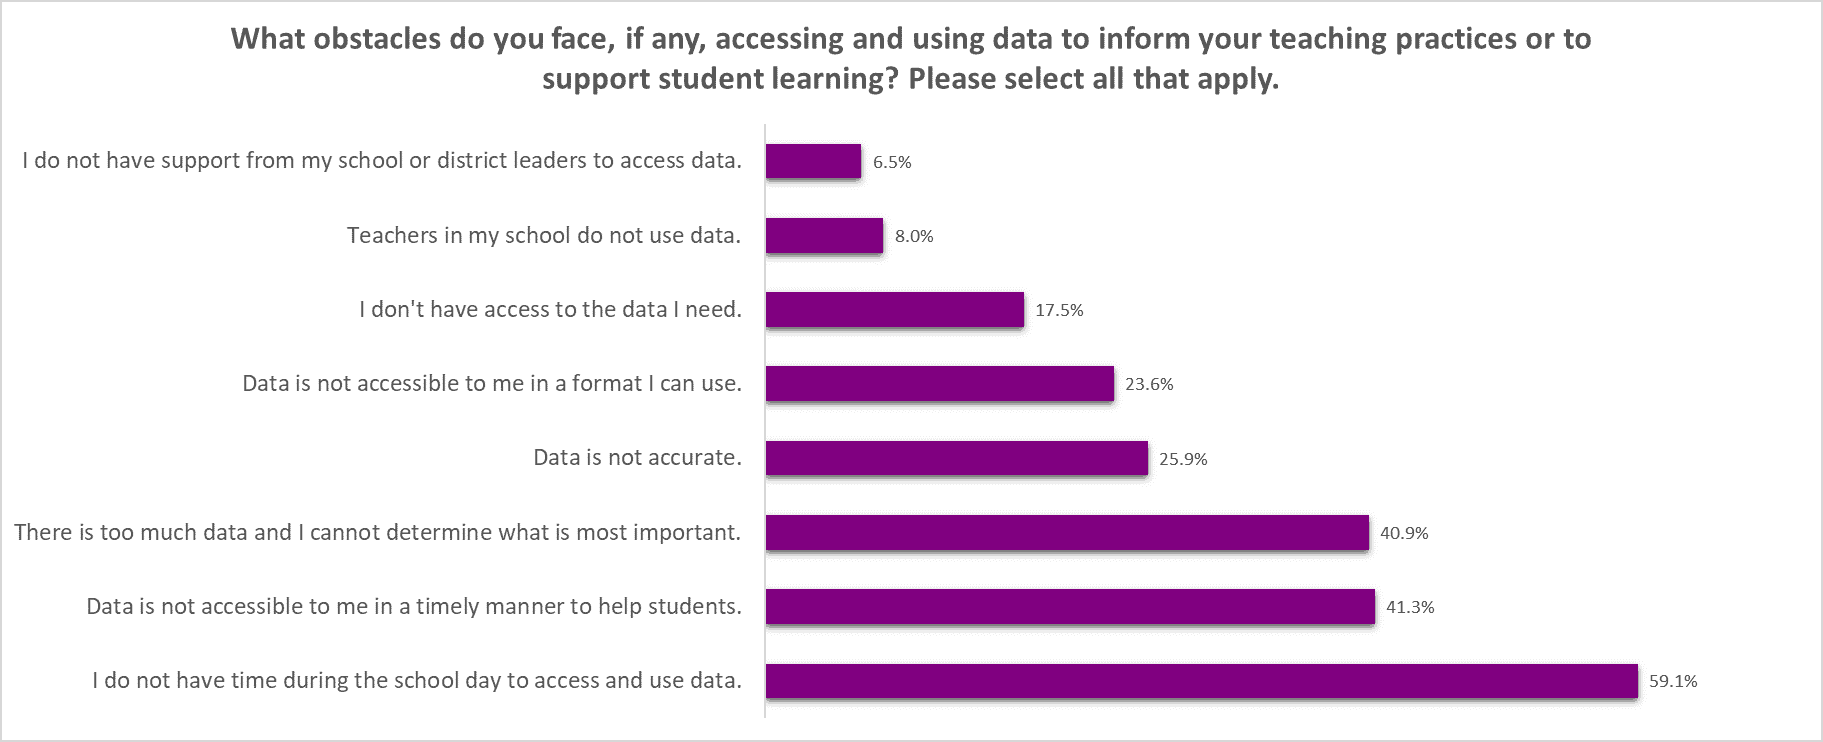
In Figure 7, teachers were asked to select all the obstacles they face, if any, in accessing and using data to inform teaching practices and support student learning. The most commonly selected answer was not having time during the school day to access and use data (59.1%), followed by data not being accessible in a timely manner (41.3%), and not being able to determine what is most important among available data (40.9%).
The least common obstacles selected were not having support from school or district leaders (6.5%), teachers in their school not using data (8%), and not having access to needed data (17.5%). Roughly one in four respondents feel that data is not accurate (25.9%).
“The little bit of data we get is not timely, not readily accessible, and not precise enough to be highly useful.” — Teacher in Edgecombe County
“Data gathered at the end of a year does not help me help those students because I will not teach them again. Data gathered from the previous year does not help me help my new students because the results do not explain what skills they are deficient in.” — Teacher in Cumberland County

In Figure 8, teachers were asked to identify the single biggest obstacle they face in using data to inform teaching practices and support student learning. More than half of respondents selected a lack of time to use data effectively (54.3%). Interestingly, the next most commonly selected option was “I don’t face any barriers,” with one in five respondents selecting this. Only 8.2% of respondents identified a lack of technology to use or access data as the biggest obstacle.
“Teachers are not given enough protected time to use data. Teachers at my school are expected to use personal time to analyze and utilize data.” — Teacher in Gaston County
Principals and colleagues
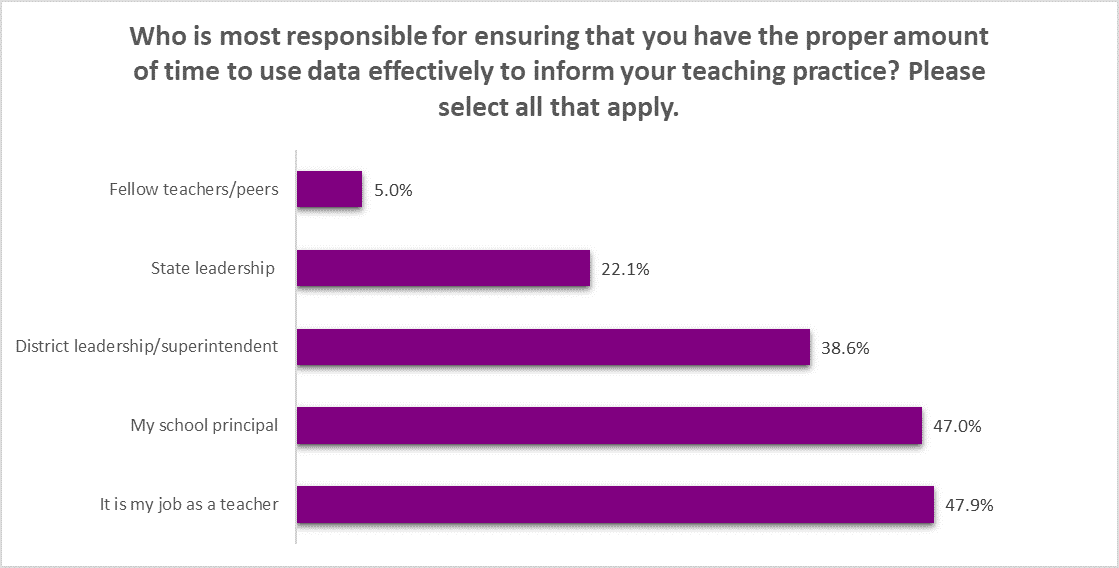
In Figure 9, teachers were asked to select all the people who are most responsible for ensuring they have time to use data effectively. This ties directly into the biggest obstacle to data use identified in Figure 8 — a lack of time to use data effectively.
Roughly half of respondents selected “my school principal” and “it is my job as a teacher.”
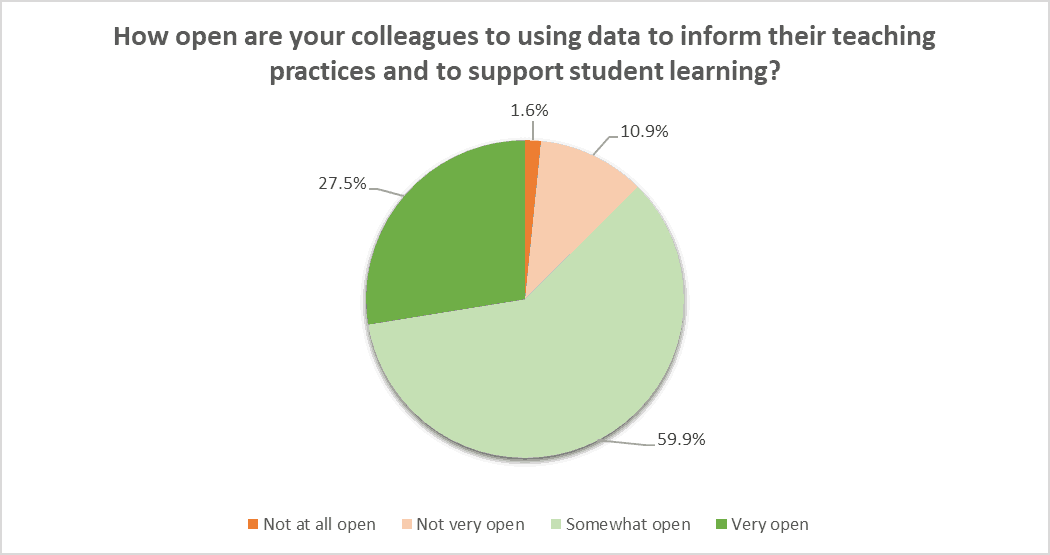
In Figure 10, roughly 87% of respondents said their colleagues are somewhat open or very open to using data to inform their teaching practices or support student learning, with only 1.6% saying their colleagues are not at all open.
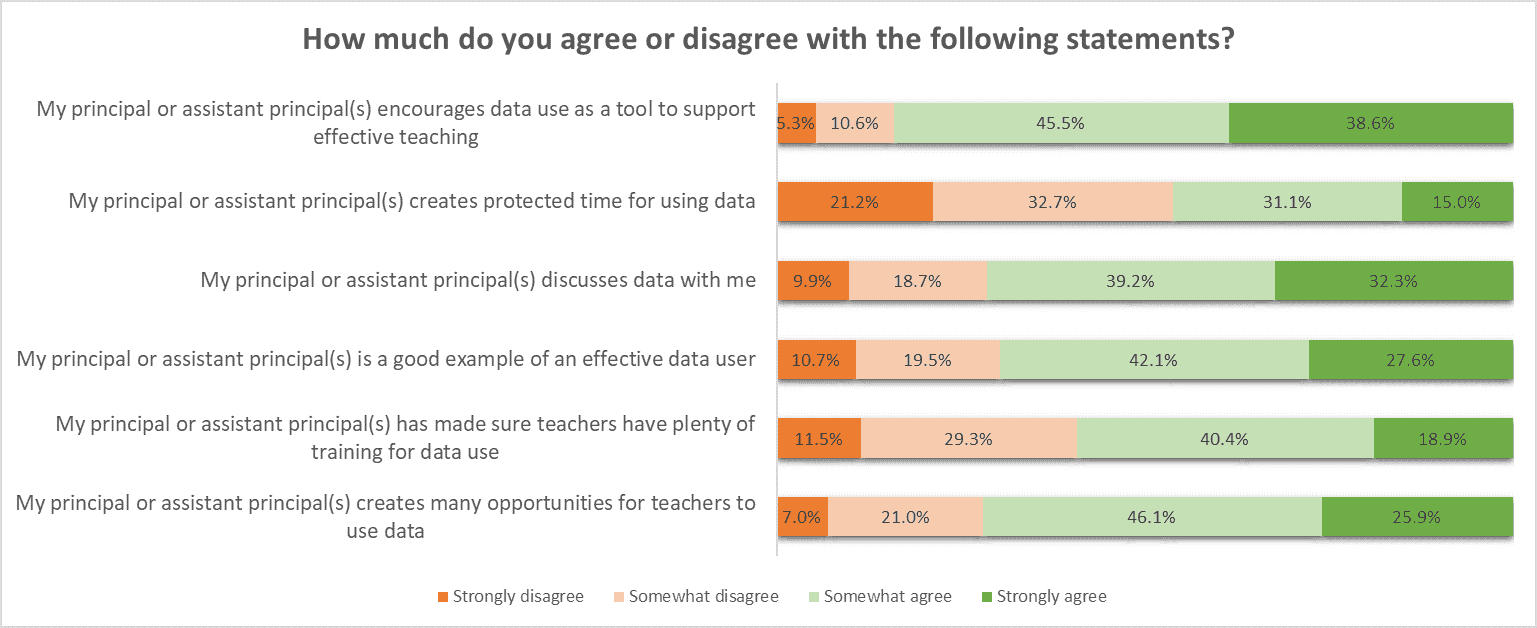
Figure 11 asked teachers to weigh in on a variety of statements related to their principal or assistant principal(s). While 84% of respondents agree that their principal or assistant principal(s) encourage data use as a tool to support effective teaching, only 46% of respondents agree that they create protected time for data use.
Roughly 70% of respondents agree that their principal or assistant principal(s) is a good example of an effective data user, and 72% of respondents agree that their principal or assistant principal(s) create many opportunities for teachers to use data.
Parents
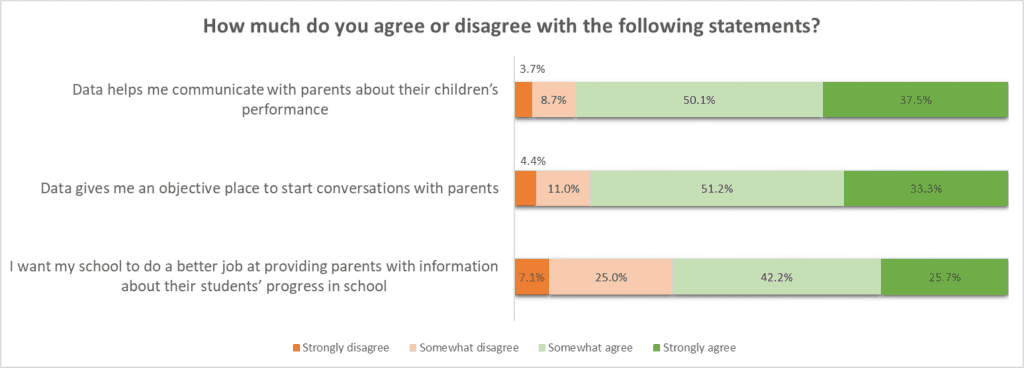
In Figure 12, teachers were asked to weigh in on statements related to communication with parents about education data. A majority of respondents agree that data helps them communicate with parents about their children’s performance (87.6%) and that data gives them an objective place to start conversations with parents (84.5%). Roughly 70% agree that they want their school to do a better job at providing parents with information about their students’ progress in school.
Standardized tests
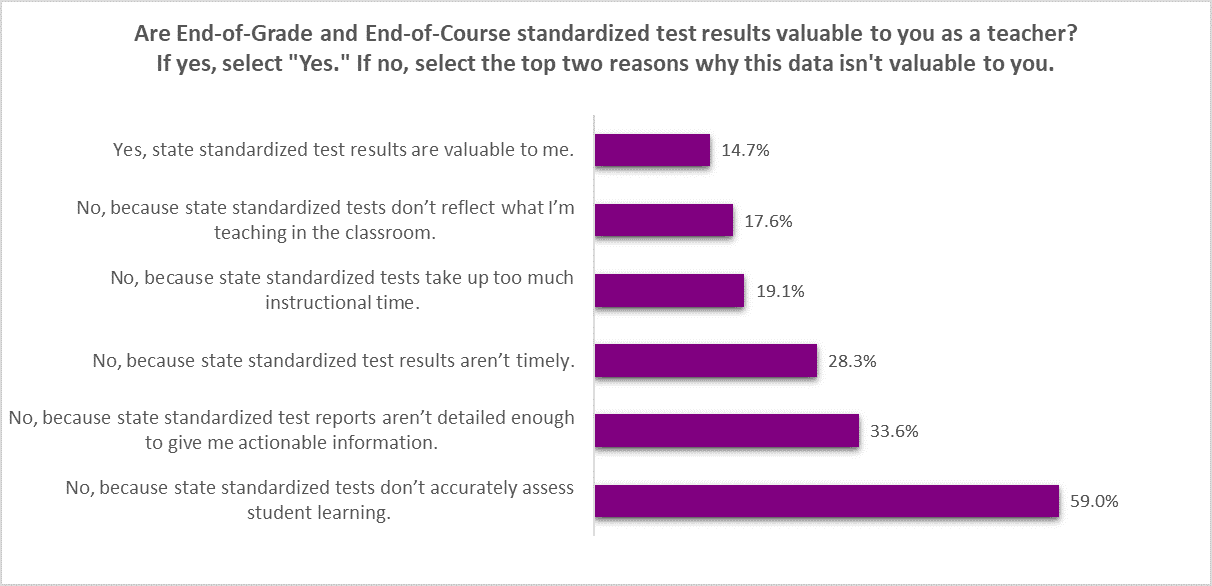
In Figure 13, teachers were asked if End-of-Grade and End-of-Course standardized test results are valuable to them. If not, they were prompted to select the top two reasons why the results are not valuable. Roughly 15% of respondents said that state standardized tests results are valuable to them.
Among those that do not find them valuable, the most commonly selected reason was because they don’t accurately assess student learning, with more than half of respondents (59%) selecting it. The next most commonly selected reason for standardized test scores not being valuable was because they aren’t detailed enough to give actionable information (33.6%) and because the results aren’t timely (28.3%).
Standardized testing was the most commonly discussed topic in the comments section of the survey. Below is a sampling of responses related to standardized test scores that speak to many of the responses in Figure 13, including feelings that standardized tests are not designed to accurately measure what students are learning in the classroom, that the results received from those standardized tests are too broad to be acted upon, and that standardized test scores are often received during the following school year, by which point teachers no longer have the same students.
“I would like to receive test results faster, identifying the number of correct answers and incorrect answers in comparison to the common core priority standards so that I can identify where I need to make improvements.” — Teacher in Johnston County
“I am a Special Education teacher for middle grades. All of my students are at least 2-4 years below grade level in reading and math. We modify curriculum all year long to meet their needs, yet force them to take the standard EOG for their grade levels. … I understand there needs to be an assessment for growth measurement, but the assessment should be better geared to their level and needs. It’s very disheartening to see a child’s face that has worked hard all year, shown adequate growth and then scores yet another ‘1’ on the EOG. They feel like failures.” — Teacher in Orange County
“Standardized test data is important but it shouldn’t be the driving force behind our jobs. We are humans teaching humans and I believe the ‘data’ derived from face to face contact, listening to, and interacting with students on an ever changing day to day basis coupled with our professional instincts is far more important for deciding what’s best in our classrooms.” — Teacher in Cumberland County
“Our county has used check-ins three times a year and the data from these is much more valuable to me as a teacher. The tests are aligned to our standards, are shorter than an EOG, and I get the data back in a timely manner. We also use the tests as a teaching tool after they are scored. Students and teachers can work together to improve learning and mastery of standards.” — Teacher in Catawba County
“As an innovative project-based school, strict state testing with proficiency and growth scores driving the ‘success’ of the school holds us captive to a very rigid curriculum. I would like to allow students the freedom to explore and dig deep into cross-curricular projects, but in doing so, there may be one topic out of many that they don’t cover as in-depth due to time constraints. … This results in negative growth, is a black eye for students and school, and [is] stressful on the teachers whose jobs are dependent on these scores (even though the students are doing college level work and learning amazing things!). So teachers like me are left to ‘teach to the test’ and not truly push the students to do anything innovative.” — Teacher in Buncombe County
“I agree with the validity of the growth model used by SAS to generate EVAAS scores, but there is not enough detail in the test results returned to us to be of much use. This data is limited to percentages of total students against the big themes of the math standards, with no detail whatsoever. Did our students miss two or three key questions? At this point, although I and my crew understand the intent of standardized testing, it is not much use to us. … It could be a useful tool, but it has become a task that gets in its own way and seems to have lost its purpose.” — Teacher in Johnston County
“State tests make teachers accountable for a curriculum, students responsible for learning the material, and parents responsible for being involved in their child’s education. I don’t think that the test tells me everything, however. Some students test well, others don’t. Some students are better guessers than others. Students may have something personal going on in their life and have a ‘bad day,’ … Visit a classroom to see what is being done. It is more than just a test — it is what we do everyday that matters.” —Teacher in Jackson County
Who participated?
This survey only included K-12 teachers is North Carolina, and the demographics of participants closely matched those of K-12 teachers in that the sample is disproportionally white and have at least a bachelor’s degree. Of the 502 teachers who answered a question about what school district they work in, 91 of North Carolina’s 115 school districts were represented.