This month on Consider It Mapped, we’re looking at the distribution of National Board-certified teachers across North Carolina. National Board certification is a rigorous process that some North Carolina teachers choose to undertake after they have been teaching for a few years. By completing this voluntary certification process, teachers further their content knowledge and teaching skills to become nationally-recognized master teachers. In recognition of this additional training and expertise, they also earn a 12 percent salary increase.
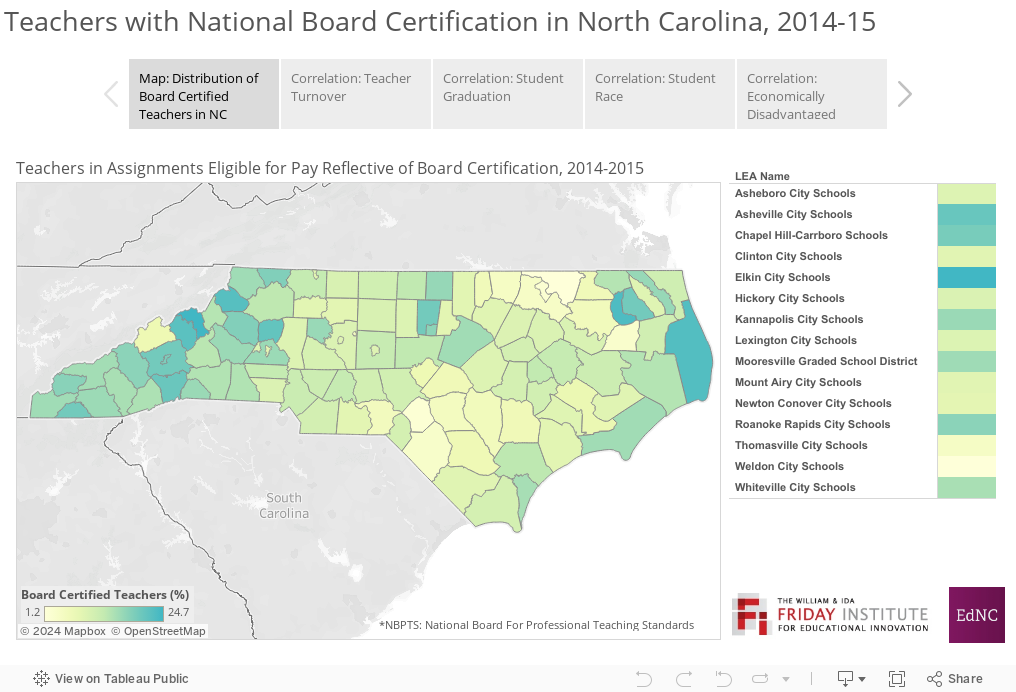
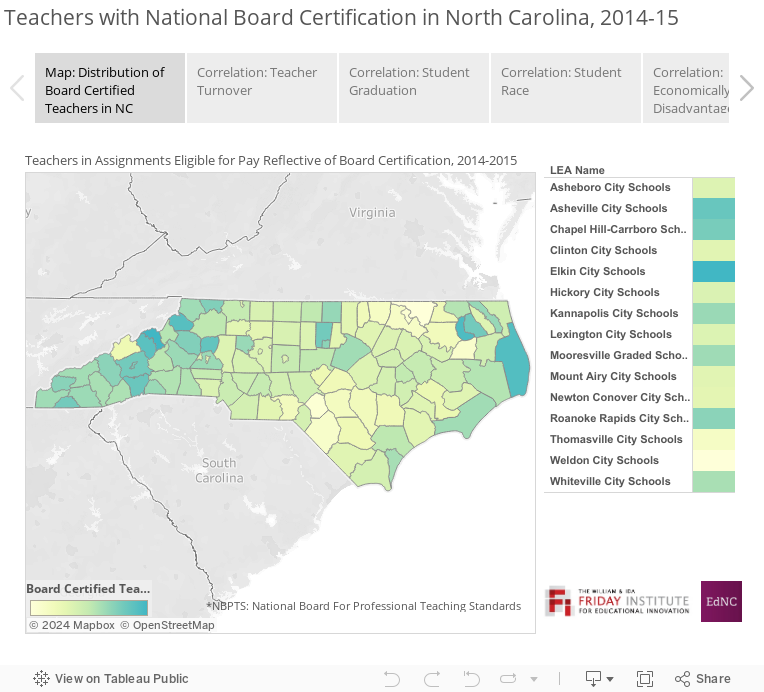
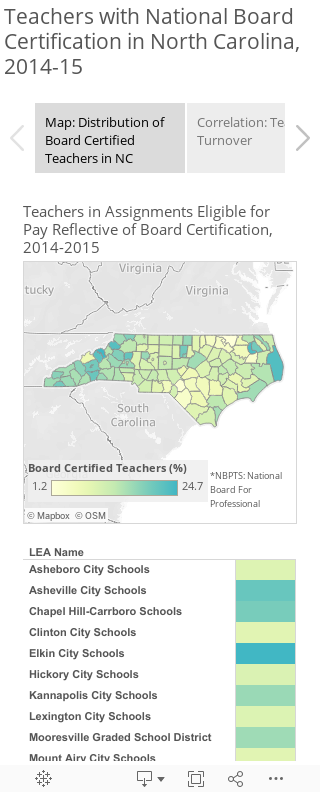
But where do these teachers teach? North Carolina boasts the highest number of Board-certified teachers in the country, but do they teach students all across North Carolina, or are they only found in certain schools? This month’s map is straightforward, showing the proportion of Board-certified classroom teachers in each school district who are eligible for the bonus pay. To be eligible for the bonus pay, a Board-certified teacher has to be teaching in the area in which she or he earned her or his Board certification.
Some might expect that the highest concentration of in-demand Board-certified teachers would be found in the state’s largest urban areas, where there are more teaching opportunities and where pay typically is higher due to larger local pay supplements. As you will see on the map, however, many districts in far western North Carolina and even a few in eastern North Carolina have the highest proportions of Board-certified teachers in the state. We use this map as a starting point to explore some of the possible reasons behind this distribution.
In addition to the map, we correlated each district’s proportion of Board-certified teachers with a few other variables, such as teacher turnover rate, student graduation rate, and student demographics (all published online by the North Carolina Department of Public Instruction by school district for the 2014-15 school year). It is important to remember when you look at these graphs that correlation is not the same as causation — in other words, just because two variables are correlated does not mean that we can declare that changes in one variable cause changes in the other variable. These correlations just give us a place to start as we begin to talk about ways to meet the needs of all students.
Our first graph compares proportions of teachers with Board certification in each district to teacher turnover rates in those districts. From the trend line in the graph (the straight diagonal line that represents the general direction of the relationship between the two variables), it appears that higher proportions of Board-certified teachers are correlated with lower rates of teacher turnover. Because this is a simple correlation, however, we cannot say for sure what may be behind this relationship. One possible explanation is that teachers who earn Board certification are more likely to stay in the profession longer, due to the pay increase, the amount of time invested in earning the certification, or other benefits of completing the certification. Another possibility, however, is that the turnover rate itself is the key. Teachers who stay in the profession longer may have more motivation to apply for Board certification; that is, when teachers decide to stay in teaching for many years, the reward of professional growth and greater pay may be worth the additional time it takes for them to earn it. In places where teachers do not stay in the profession as long, there may be less incentive to take the time to earn Board certification. The result would be more instances of teachers seeking Board-certification in districts with lower turnover rates.
In the second correlation, in which we compare the proportion of Board-certified teachers to each district’s graduation rates, higher graduation rates are correlated with a higher proportion of Board-certified teachers. Taken together, these two correlations (teacher turnover and student graduation rates) may suggest that there is some relationship between Board certification, teacher stability, and student achievement. We cannot say for sure because we do not know which outcome influences the other, but the correlations raise intriguing questions that may be worth a closer look.
The third and fourth correlations consider relationships between Board certification rates and student demographics. The third correlation — the proportion of Board-certified teachers to student race — is separated into two graphs. The first graph shows the correlation between Board-certified teachers and each district’s proportion of white students; the second graph shows the correlation between Board-certified teachers and each district’s proportion of minority students (including American Indian, Asian, Black, Hispanic, Pacific Islander, and students who identify as two or more races).
The correlation between Board-certified teachers and white students is positive, meaning that as the proportion of Board-certified teachers increases, so does the proportion of white students. Consequently, the correlation between Board-certified teachers and students of all other races is reversed: As the proportion of Board-certified teachers increases, the proportion of non-white students decreases. The fourth correlation — between Board-certified teachers and economically disadvantaged students (using free and reduced-price lunch eligibility [see last month’s maps] as a proxy for disadvantage) — also is negative: As the proportion of Board-certified teachers increases, the proportion of economically disadvantaged students decreases. Taken together, these correlations raise questions about the equitable distribution of Board-certified teachers, both in terms of district populations and concentrations of need.
All of these visualizations lead us to ask: What would it take to entice Board-certified teachers to teach in the areas of our state in which they are needed the most — for instance, in districts with the highest proportion of underperforming schools — or to encourage more teachers in those areas to pursue Board certification? Is it even necessary to achieve equitable distribution of Board-certified teachers across the state? In other words, what should this map look like? What is the optimal distribution of Board-certified teachers in North Carolina?
Do you have a map of the ideal distribution that you’d like to share, or other ideas? If so, reach out to us on Facebook or Twitter.
About the author