
As reported last week in various media outlets, school choice is alive and well in North Carolina. The number of students choosing charters, private, or home schools is going up while the number of students in traditional public schools are going down. In fact, if they were considered their own separate districts, home schools and private schools would be the third and fourth largest districts in the state respectively, behind Wake County and Charlotte-Mecklenburg Schools.
Here’s a breakdown:
Traditional schools
| 2018-19 school year | 2014-15 school year |
| 1,410,542 students | 1,437,686 students |
| Difference | – 27,144 students |
Charter schools
| 2018-19 school year | 2014-15 school year |
| 109,492 students | 69,617 students |
| Difference | + 39,875 students |
Private schools
| 2018-19 school year | 2014-15 school year |
| 102,400 students | 97,259 students |
| Difference | + 5,141 students |
Homeschools
| 2018-19 school year | 2014-15 school year |
| 142,037 students | 106,853 students |
| Difference | + 35,184 students |
Add the total number of students together for 2018-19, and that makes up about 1.76 million students divided between these institutions (and not including laboratory schools).
The percentage of total students from each type of school breaks down like this:
- Traditional: 79.9%
- Charter: 6.2%
- Private: 5.8%
- Homeschools: 8%
That still leaves traditional public schools with the largest piece of the pie. Here are the percent changes since 2014-15:
- Traditional: -1.9%
- Charter: 36%
- Private: 5%
- Homeschools: 24.8%
So, according to this data, charters and homeschool are growing the fastest. Private the slowest. And traditional schools are going backwards.
The upward trend of charter enrollment isn’t surprising. Until 2011, North Carolina capped the number of charter schools in the state at 100. Since the lifting of that cap, the creation and expansion of charter schools has been steady and rapid.
Private school growth is relatively small despite the many incentives lawmakers have given to students to attend. Opportunity scholarships, disability grants, and education savings accounts all offer state money to certain low-income students to attend private school. While the growth in this sector may not be as overwhelming as it is for charters and homseschools, it does reverse a negative trend where private schools were actually decreasing in enrollment. In the 2010-11 school year, private schools enrolled 96,229, but by 2012-13, those numbers had fallen to 95,948. They didn’t go up again until 2014-15.
Home schools, meanwhile, are second only to charter schools in their percent growth increase and have the largest number of students outside the traditional school setting.
The data on charters and traditional public schools has been available for some time in different forms, but two new reports were released in July on private schools and home schools. Let’s delve into those some more.
When we talk about private schools, there are two main categories they fall into — independent and religious.
According to the most recently released data, for the 2018-19 school year the majority (68.5%) of private school students are in religious schools.
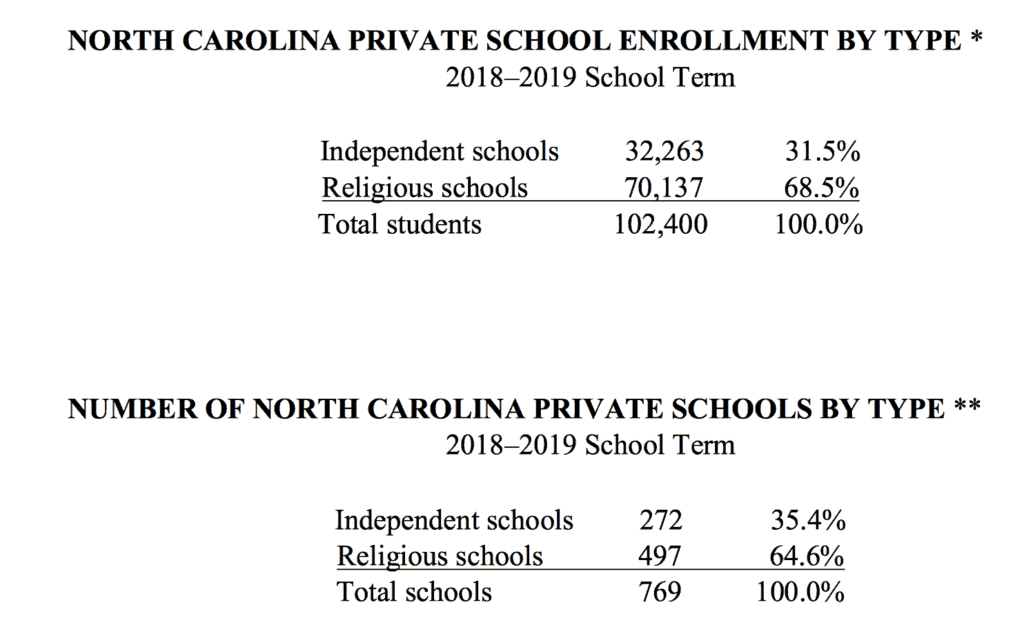

As would be expected, the counties with the largest school districts are also the counties with the largest number of students in private schools. Wake and Mecklenburg top the list with 18,567 and 18,530 respectively.
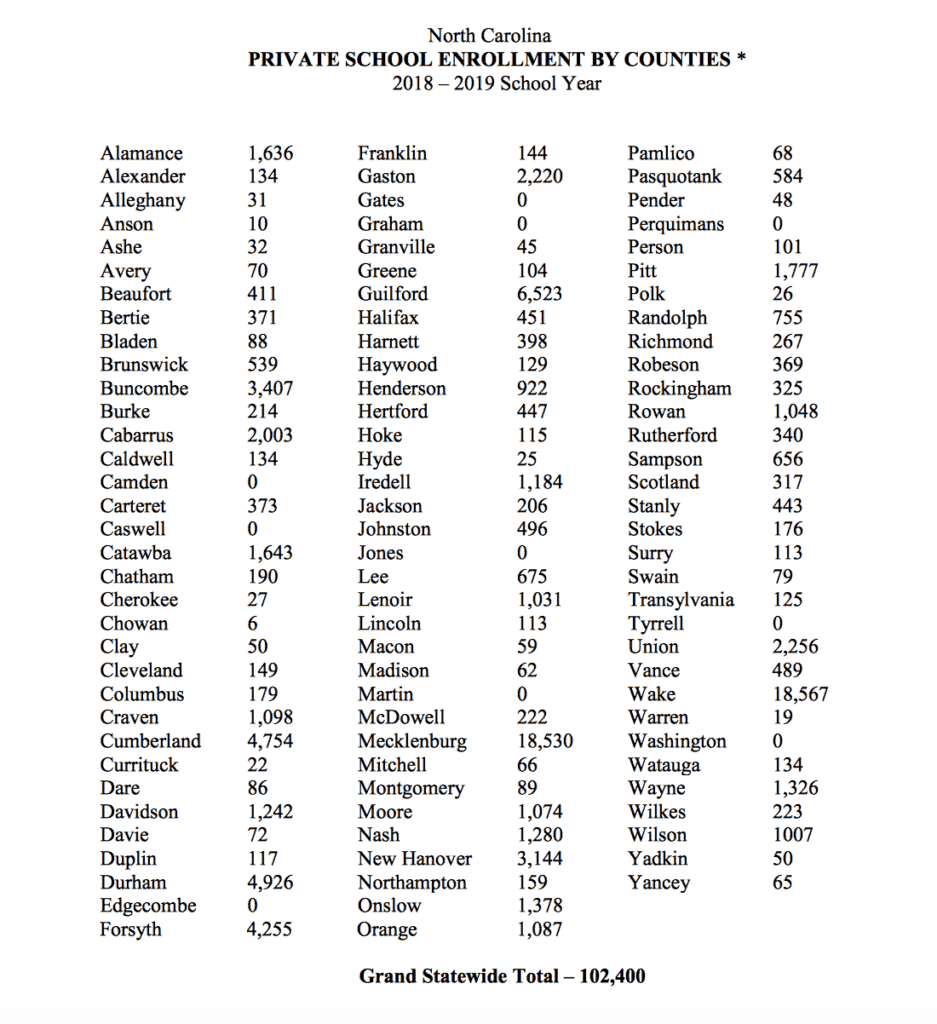

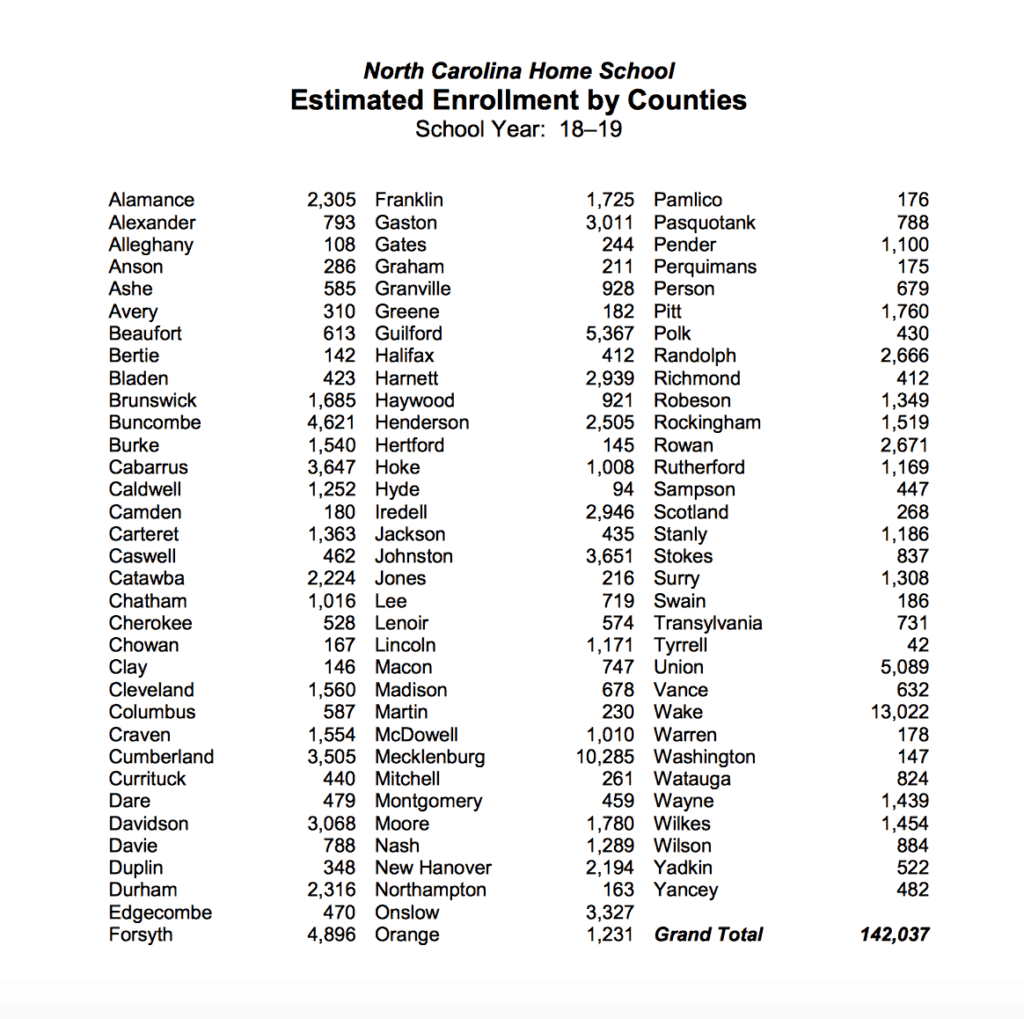
Home schools can also be divided between independent and religious. The recently released data on home schools doesn’t give enrollment by type of school, but it does give a breakdown of the total number of schools and whether they are independent or religious. Here again, the higher percentage goes to religious home schools, though it’s not quite as large as privates: 57.6% versus 64.6%. You can also see a breakdown of home school students by age.
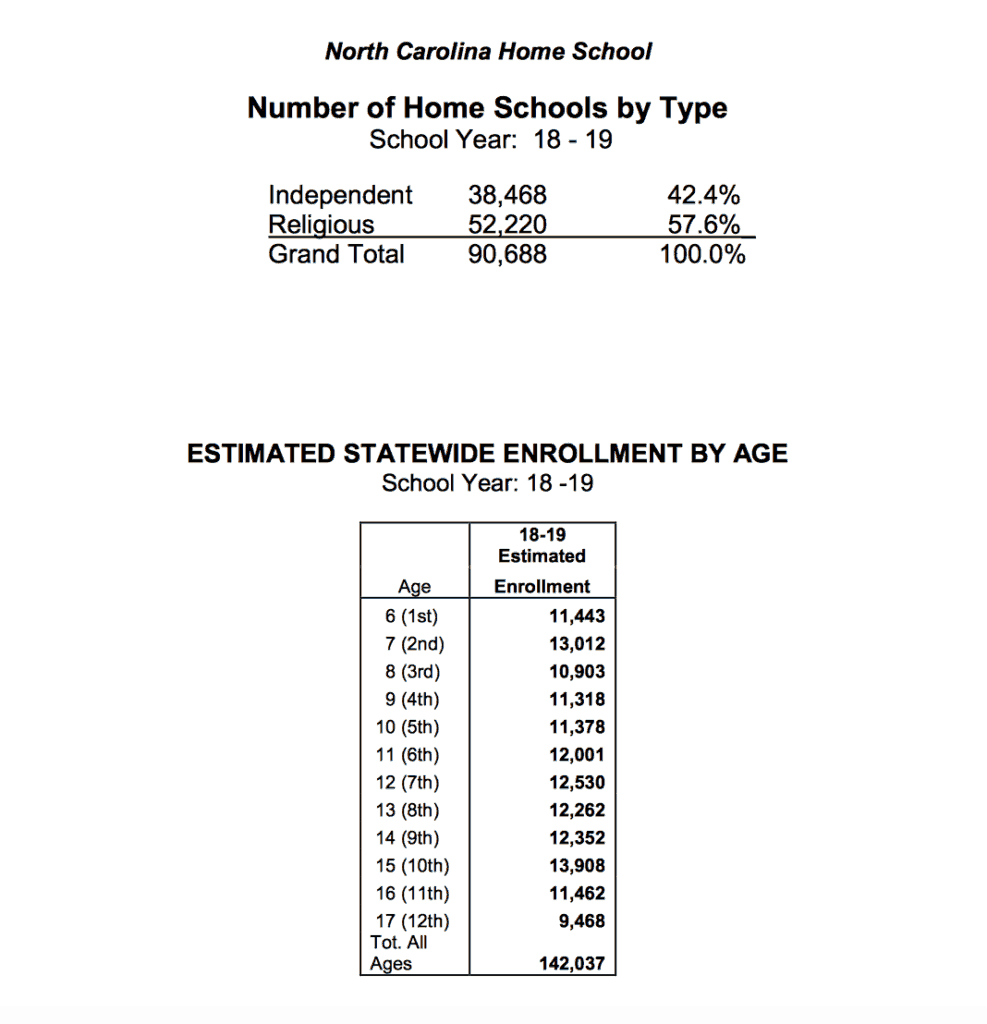

When it comes to enrollment by county, again the larger counties have the larger enrollment numbers, as would be expected.
