
School leaders and faculty at Research Triangle High School (RTHS) were excited yet frustrated. They were energized by the growth they believed they had observed in their students during the school’s first six years of existence but were also vexed by a lack of suitable data to document, inform, or even refute their anecdotal observations.
The key word, of course, is “suitable” – their frustrations were not due to a shortage of data overall. Indeed, as a public school in North Carolina, RTHS has access to academic performance data made available by the Department of Public Instruction (DPI), such as School Performance Grades (SPGs), growth scores, and standardized test results. RTHS officials also directly access all of the data generated by the Education Value Added Assessment System (EVAAS), such as test-specific measures of growth and associated breakdowns.
The problem? As a charter high school whose mission entails incubating, proving and scaling innovative models of teaching and learning, RTHS has employed methods such as personalized learning and flipped classes, which represent a significant shift from most students’ experiences prior to attending the school. Any impact from this shift can be expected to require some time to take hold; therefore, RTHS needed to be able to measure academic growth reflecting multiple years of students’ exposure to these methods, and to have a basis of comparison for those measures. And it did not have that.
In spite of the wealth of data made available through DPI and EVAAS, none satisfy all of these basic requirements. Standardized test scores alone do not reflect growth, and school-level growth scores and SPGs incorporate EOC performance that do not reflect multiple years of exposure to RTHS’ methods. Even EVAAS growth scores on upper class testing such as the ACT and SAT – while useful – do not provide any points of comparisons for charter schools, which by definition comprise their own district. And, in spite of EVAAS’ admirable efforts to demystify these data, they can nevertheless be difficult to interpret. Eric Grunden, RTHS’s chief school officer, says, “EVAAS growth data are interesting, but they don’t tell me what I really want to know.”
Of course, these challenges are not unique to RTHS. Many North Carolina charter high schools concentrate on specific teaching techniques and improving achievement among their students, and for that matter all schools seek improved methods for measuring growth.
To meet these needs, RTHS has devised and is experimenting with a deceptively simple approach to the problem, one that relies on widely available data, requires no sophisticated computations, and is easy to interpret. The basic idea is to examine change in performance from EOC tests – most of which are administered in the eighth or ninth grade – to the ACT, which is administered toward the end of the 11th grade. They do this at the school level, not the individual student level, by comparing subject-specific ACT benchmark percentages to corresponding EOC proficiency percentages for the same class cohort. By looking at the change from EOC proficiency to ACT benchmark achievement, school officials get a sense for how far this cohort has advanced from their EOC baseline – a measure of growth that reflects multiple years of learning at RTHS. Furthermore, since these data are available for all public high schools in North Carolina, there is a basis for comparison to other schools.
By taking this approach, RTHS found that their students’ ACT performance was consistently high in comparison to schools with similar EOC results for the same class cohort. Furthermore, this was true across different subjects, different demographic subpopulations, and different testing years – all of which suggests that the results are not merely a chance occurrence; rather, that RTHS’ method of instruction has had a positive impact. In other words, these data support the intuitive sense among RTHS faculty and leaders that student growth has been strong.
RTHS officials acknowledge the method is not perfect. For example, school-level data gloss over many individual student nuances, subject-specific EOC and ACT tests may not correspond perfectly, and using a single measure such as a benchmark percentage can miss some important information in the full distribution of test scores.
Nevertheless, these limitations may be worth sacrificing in the interest of meeting the more fundamental requirements of measuring multi-year growth in a comparative context. Says Grunden, “This is the best approach we’ve found to get a sense for how well we are really doing. While we don’t teach to the ACT per se, strong performance on the ACT is a natural byproduct of the things we do teach, and growth in performance from the EOC to the ACT tells us a lot about the overall effectiveness of our instruction.”
Specifics on the method
The strategy leverages two sources of data made available for all schools by DPI: proficiency rates on subject-specific EOC tests (percent of students scoring “proficient” or better) and benchmark rates on subject-specific ACT tests (percent of students meeting or exceeding the ACT-designated benchmark for each subject). Every school’s ACT benchmark rates for a given year are linked with their EOC proficiency rates from a corresponding subject based on a prior year that would generally reflect the same student cohort.
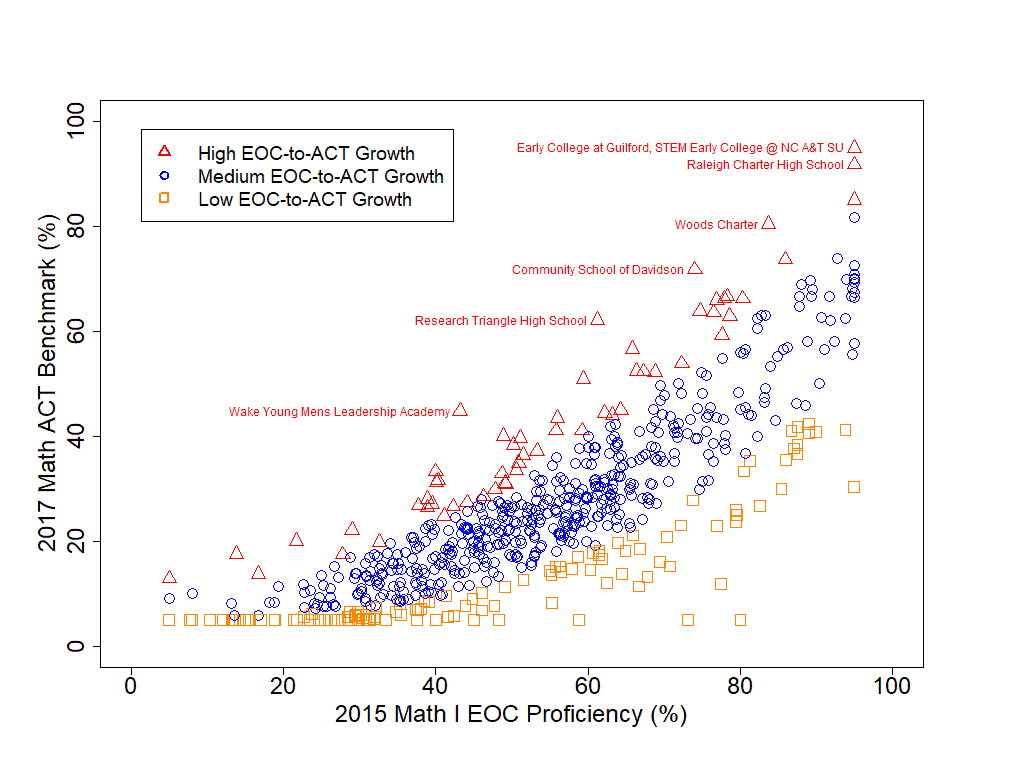
For example, 2017 Math ACT benchmark rates for each public school are linked with the same school’s 2015 Math I EOC proficiency rate. One can thereby examine ACT benchmark performance relative to EOC proficiency for each school. Similarly, 2017 Science ACT benchmark rates are linked with 2015 Biology EOC proficiency, and 2017 English ACT benchmark rates are linked with 2016 English II EOC proficiency (English II EOC is generally taken in the 10th grade).
The EOC-to-ACT change in performance can be described in any number of ways, but these results are perhaps best interpreted by considering ACT benchmark performance conditioned on a given level of EOC proficiency for the same student cohort. In other words, in the spirit of considering the EOC as a kind of baseline, one simply compares ACT performance among schools that have similar EOC results.
As an illustration, RTHS has graphically examined the distribution of relationships between these two test outcomes. In Figure 1, each symbol corresponds to a public high school in North Carolina. Schools along the upper edge of the scatter perform well on the ACT relative to other schools with comparable EOC results for the same student cohort. The graph is color coded to aid in seeing this visually, and a few schools with the highest ACT performance relative to their EOC results are labeled on the graph.
There are other options for quantifying and examining the results in this way. For example, one can consider the ratio of these two rates – say ACT benchmark percentage divided by EOC proficiency percentage. Most schools’ ratio will be less than 1.0, as the ACT benchmark represents a more stringent level of achievement than EOC proficiency, but ratios in the neighborhood of 1.0 represent a strong level of ACT achievement relative to baseline EOC performance. Since DPI restricts extremely high (>95 percent) or low (<5 percent) rates for confidentiality reasons, this should be borne in mind when interpreting these ratios – for example, a school with both EOC and ACT rates of <5 percent might artificially appear to have a very strong ratio of 1.0 if these truncated values are used.
It should be noted that this approach leverages two important attributes of these publicly available testing data. First, many students take the Math I EOC prior to high school. However, high school proficiency rates provided by DPI for the Math I EOC incorporate all students’ most recent Math I EOC scores, regardless of where taken. Thus, the publicly available Math I EOC scores do provide a comprehensive baseline for each class cohort. Second, nearly all students now take the ACT, thus providing comprehensive data on 11th grade performance to support comparisons against equally comprehensive, earlier EOC data. It is for this reason that RTHS has utilized ACT results rather than, say, SAT results – the latter could be skewed since not all students take the SAT.
Also note that this approach entails an implicit assumption that these results are not significantly impacted by any turnover in a school’s student body (e.g. from ninth to 11th grade) – otherwise an apparent change in performance could simply be attributable to a change in the make-up of the student body. RTHS has experienced low student turnover, but nevertheless has examined the data with respect to this issue – for example by comparing all ninth graders’ EOC results with those for only those students who later took the ACT while still at RTHS – and has found evidence to suggest that the results are not significantly impacted by student turnover. More generally, the EOC-ACT relationship across all schools does not appear to correlate with any change in the numbers of students taking the two exams at each school.