Editor’s note: This is the third in a six-part series on the Durham Public Schools that originally appeared at the Bull City Rising Blog. The articles are reprinted here with authors’ permission.
As we noted yesterday, Durham Public Schools trails many to most other North Carolina school systems in numerous standardized measures of performance almost any way we slice things — by looking at the largest/most urbanized districts, or all systems, or isolated for demographic or income characteristics.
There’s another comparison that’s worth looking at: how much does Durham spend on its public schools, relative to our peers? After all, given Durham’s bleeding-blue reputation and reality, it’s hard to imagine our community not being willing to pay any asked price for better schools.
The curious reality, though, is Durham’s last-place finish contrasts with the district spending significantly more local augmentation funding than any of its peers.
To me, the data that we’ll discuss over the next couple of days is hard to explain. (We’ve been trying to make sense of it ourselves.) And it puts some of DPS’ challenges in a different, and important, context that we don’t always see.
For instance, many Durhamites have raised equity concerns over the amount of resources that leave public schools for charters.
And we concur that it’s a big figure, equating to more than $500 per pupil in 2014-15.
Yet DPS’ central administrative/system overhead costs far surpass the three NC large, urban districts closest to it in student population. In fact, the difference in spending in this one category, per pupil, is greater than what Durham Public Schools loses per pupil to charters.
Ponder that for a moment. And then, welcome to the rabbit hole as we try to explain these numbers.
Durham and peer district spending: An overview
For today’s installment in our series, we’re going to compare DPS’ spending to that of North Carolina’s other large, urban districts.
North Carolina’s a big place. There are districts with fewer than 1,000 students and districts with well over 100,000 students. Indeed, even within the ten largest districts in the state, Durham (at about 33,000 students) trails mega-districts; Wake County alone has almost five times the enrollment of Durham County, for instance.
So besides an overarching look at spending, we’re going to then drill down a bit further to a subset of these districts similar in size to Durham, to control for differences due to economies of scale or population.
The latter isn’t our original idea. DPS and County leaders compared DPS spending against the three districts that we’ll also be analyzing most closely: Johnston, Gaston, and Cabarrus.
All three districts have similar enrollment numbers; they also have very similar exceptional children population ratios. Durham’s free and reduced lunch rates are the highest, but all four have nearly or more than half of their students qualifying for this, a useful proxy for SES.
Given the “red umbrella” campaigns and the like anytime the notion of state or county budget cuts impacting school spending, you’d think that Durham’s funding for schools was tenuous relative to its peers.
But that’s not so. DPS receives the 4th highest local funds in the state out of all 115 districts, surpassed only by Chapel Hill/Carrboro, Asheville, and Dare County schools.
(As we’ll discuss during this series, besides the relatively equalized state funding for schools, local communities in North Carolina can supplement public school spending; and, federal funds are available for higher-poverty districts like Durham.)
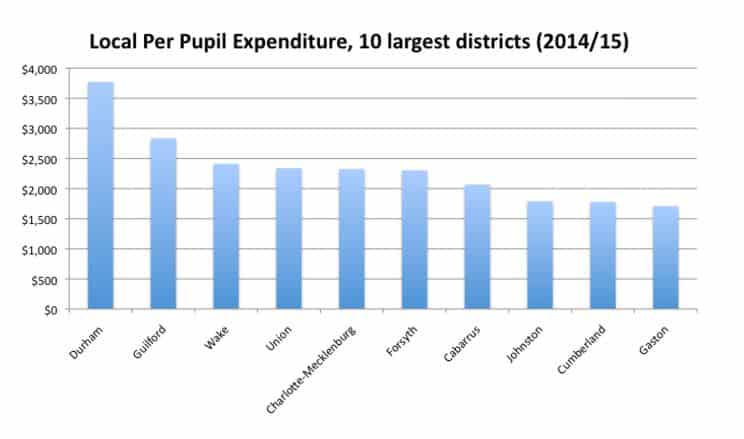
Durham Public Schools’ local per-pupil expenditure is 250% of the state average, and far exceeds the levels in the other of the ten-largest districts — including a spending level twice as high as in two similarly-sized counties, Gaston and Cabarrus:
Yet, as we saw yesterday, Durham lags almost all (and often, indeed, all) of these districts on all but a few relative measures of performance.
Of course, it’s difficult to do a same-size comparison of, say, the Durham system to that in Wake, or Charlotte, or Chapel Hill — all of which are very different sizes from Durham. Instead, as noted above, we’ll focus the analysis today and tomorrow on three relative peers among the above districts: Gaston and Cabarrus (in the metro Charlotte area), and Johnston, to the east of Wake County.
The three counties are slightly smaller (between 181,000 and 211,000 residents). Johnston and Gaston’s poverty rates are slightly lower than Durham’s (17.2% and 17.9% vs. Durham’s 18.5%), though Durham bests both in the rate of residents with a bachelor’s degree or higher (45% vs. 18% in Gaston). Cabarrus has a lower poverty rate than the others, at 13.2%
Ultimately, though, the districts’ population-served statistics are where the districts’ similarities come forth:
| Durham | Cabarrus | Gaston | Johnston | |
|---|---|---|---|---|
| No. of pupils, 2014-15 (ADM) | 33,263 | 30,077 | 31,293 | 33,836 |
| Free & reduced lunch qualifying % | 66% | 44% | 56% | 47% |
| Exceptional Children headcount | 4,536 (13.6%) |
3,632 (12.1%) |
4,421 (14.1%) |
5,375 (15.8%) |
The one area where the systems are least alike is in racial diversity; all four have lower black and Latino student enrollments than Durham and proportionately more white students.
DPS is also a lower-wealth district than these peers — though all three approach having half of their student population eligible for free/reduced lunch, at rates three or more times the incidence of poverty overall in their communities.
Despite these differences, we still think this is a useful lens, particularly for financial analysis. Starting with similar-size districts is helpful to account for staffing efficiencies and economies of scale, while the similarities in EC membership and, relatively speaking, F&RL qualification make these useful for comparative purposes.
While they’re harder to compare financially due to their larger sizes, other districts with similar racial demographics — notably Cumberland and Charlotte-Mecklenburg — performed significantly better than Durham among large districts in standardized testing, both as a whole and among non-white populations. (Notably, Charlotte has been far more progressive than Durham in its use of positive behavior intervention programs to keep students in school, relying far less on controversial, likely racially-disparate out-of-school suspensions as a technique. We wonder if this is a contributing factor to Durham’s performance gaps relative to peer systems.)
As the focus in this story is largely one of spending, we’re comfortable staying with Cabarrus, Gaston and Johnston as our peer set.
Comparing the districts’ spending
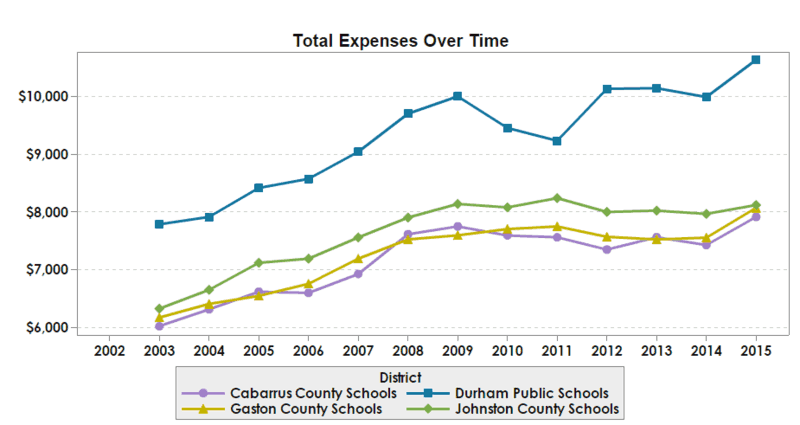
The first item to note is that in comparing DPS to these other three districts, Durham spends more on its pupils — a lot more.
As this graph from the NC DPI report card system shows, Durham’s school spending has been several thousand dollars higher than the other three similarly-sized districts for more than a decade:
Durham receives similar state funding to the three other peer local education agencies. And, thanks in part to programs such as federal support for Title I schools, Durham also has access to as much as double the federal and grant agency funding that other peer districts do.
Yet it is in the local funding amount — $131.7 million — where DPS has access to resources well beyond those of its peers. That marks nearly $75 million more in school funding than Cabarrus, DPS’ nearest peer ($56.5 million), or Johnston ($54.7 million), or Gaston ($47.0 million.)
When all is said and done, in fact, the total spending in Durham outpaces the other three districts by between $80 million and $120 million:
- Durham: $387.1 million
- Johnston: $306.8 million
- Gaston: $268.4 million
- Cabarrus: $260.5 million
Of course, not all of this money is kept by DPS. Charter schools, as DPS leadership has long pointed out, receive a portion of this money for those Durham students who leave DPS for charters.
In DPS’ case, the total spending on “non-programmed charges” — most, but not all of which was for charter schools — amounted to $18 million, a figure that far exceeded Cabarrus ($3.3 million), Gaston ($4.6 million), or Johnston ($410,000).
$18 million sounds like a lot of money. It is, indeed, a lot of money. But we have to consider that expenditure in line with the strong local funding Durham has undertaken — and in proportion to the entirety of a nearly $400 million budget.
To do so, let’s look at the 2014-15 spending in all four districts on a per-pupil basis, going back to the headcount we looked at earlier. The figures below are normalized against the number of pupils in each system. In the case of charter funding, this equates to the theoretical maximum per-student level of funding that could be available if DPS got back all the money that it loses to charter students and to other non-programmed charges.
| Description | Durham | Cabarrus | Gaston | Johnston |
|---|---|---|---|---|
| Instructional Services | $7,989 | $6,001 | $6,111 | $6,304 |
| System-Wide Support Services | $2,169 | $1,786 | $1,494 | $1,476 |
| Ancillary Services | $625 | $525 | $579 | $427 |
| Non-Programmed Charges — includes charter school funding |
$541 | $109 | $145 | $12 |
| Capital Outlay | $312 | $241 | $248 | $848 |
| Total FY 2014-15 | $11,636 | $8,661 | $8,577 | $9,067 |
| Total FY 2014-15 – less charter schools and non-programmed charges |
$11,095 | $8,553 | $8,432 | $9,055 |
Even after accounting for the per-pupil impact of charters and other government transfers, Durham still spends $2,415 per student more than the three peer counties under comparison.
On instructional services — including mainstream, special education, and alternative programs — DPS spends about $1,700 to $2,000 more than all the other districts.
At the same time, when it comes to “system-wide support services” — another way of saying central administration operations — Durham spends nearly 50% more per student than either Johnston or Gaston do, and nearly $400 per pupil more than Cabarrus.
Indeed, as we’ll talk about in tomorrow’s follow-up to this story, the difference in what Durham spends for administrative costs versus Gaston or Johnston is greater than all of DPS’ lost revenue due to charters put together. (And, there’s some interesting patterns deserving scrutiny in the instructional spending bucket, too.)
For now, what’s the bottom line?
As we saw yesterday, DPS performs no better in aggregate testing than these three districts do — indeed, DPS lags all of them. By the admittedly problematic standardized measures we wrote about yesterday, these districts perform as well or better than DPS in almost every category (save for white students.)
Yet all three districts also spend significantly less than Durham, and receive thousands of dollars less per year in per-pupil funding — even after controlling for Durham’s high charter school outflows.
This is not to say Durham shouldn’t be proud to lead our large district peers in local spending. Arguably, we should.
But the question for those who care about public education should be, are we spending money in the right ways to ensure students the best education possible?
Asking that question is not a prelude to suggesting that we spend less. Instead, it is an invitation to scrutiny: to ask if we’re getting our money’s worth (we don’t seem to be) and what our leaders have been doing in their oversight of the system (we’d sure like to know.)
Tomorrow, in the fourth part of our series, we’ll take a closer look at the differences between Durham, Gaston, Johnston and Cabarrus, in terms of where we are (and aren’t) spending money.
Data sources:


Recommended reading